


Introduction
June 1997 marks 25 years since the Norwegian Parliament decided that the centre for avalanche research and advisory services should be at the Norwegian Gcotcchnical Institute (NGI). Earlier, avalanche work had been performed, primarily by students and governmental institutions. However, the goal was to establish a group of avalanche specialists who would foster scientific knowledge and education, and give professional advice to the authorities as well as persons, companies, institutions and organizations throughout the country (Reference LiedLied, 1993).
Primarily, the scientific work was devoted to problems concerning snow avalanches and snow creep. However, in consulting work such as risk assessment, hazard zoning, recommendation of mitigative measures, etc., all kinds oi rapid mass movement have been dealt with (Reference Hestnes and Lied.Hestnes and Lied, 1980). Accordingly, the field of scientific interest has expanded over the years.
Problems involving slushflows have been a considerable part of our consulting work from the very beginning (Fig. 1). It was, however, almost 10 years before we realised the real proportions of the slushflow hazard in Norway. The eye-openers were the extensive damage and deaths which occurred throughout West Norway during the first week of March 1979, between 58° and 62° and during the last week of January 1981 in North Norway, between 65° and 69° (Reference Domaas and Lied.Domaas and Lied, 1979; Reference Hestnes and Sandersen.Hestnes and Sandersen, 1987).

Fig. 1. A small slushflow, released from a grassy gully of sporadic drainage, damaged the local police office. Sande, Gaular, West Norway, 3 March 1979. (Photograph by P. Askvoll.)
Consequently, a specific research programme on slushflows was started at NGI in 1983. The main scientific purpose was to develop objective criteria to enable identification of slushflow hazard areas and methods for slushflow prediction and control (Reference HestnesHestnes, 1985; Reference Hestnes and Sandersen.Hestnes and Bakkehøi, 1995). The present paper summarizes our experiences and scientific documentation concerning slushflow occurrence, hazard analysis and hazard prediction (cf. Reference Hestnes and Sandersen.Hestnes and Sandersen, 1995; Reference Onesli and Hestnes.Onesti and Hestnes, 1989).
Slushflow Characteristics
Slushflows are flowing mixtures of water and snow. The major part of a slushflow consists of dense material in almost laminar to fully turbulent flow depending on the velocity of the flow and the steepness and roughness of the path. Slush-flows also normally exhibit a saltation layer and large ones may have an airborne part.
A slushflow path is divided into a starting zone, track and run-out zone, the same as an avalanche path. A noticeable feature of slushflows is the fact that the ground is the gliding surface; in the starting zone as well as in the central parts of the track. Entrainment of organic and mineralogic material is normal. Therefore, slushflow deposits along the track and in the run-out zone are normally dark and dirty after thawing weather and rain (Fig. 2).

Fig. 2. Slushflows on a sparsely forested hillside in Sjånesheia, Rana, North Norway, 27–28 January 1981, were released on a sloping rock surface 200–250 m a.s.l. The arrows indicate The six starting zones. The slushflows closed the road and the railway between North and South Norway for 2 and 4 days, respectively. Cars waiting for the road to be opened after the first blockage were hit by the second slushflow and thrown off the road, causing three fatalities and five badly injured. The fourth slushflow demolished two houses and two huts and caused two more fatalities. The whole area has been abandoned and 20 houses have been removed. (Photograph by O. I. Tysnes, Dagbladet.)
Regional Occurrence
Slushflows occur in all parts of Norway. Districts exposed to high cyclonic activity during autumn and winter are most liable to slushflow hazard. This includes both western and northern Norway. Slushflows released during intense thaw in spring are frequent in inland and mountainous areas. However, they primarily affect inhabited areas in North Norway and the settlement of Longyearbyen on the island of Spitsbergen at 78° N. Within the lowlands and coastal areas of southern Norway, slushflows may occur occasionally during spring breakup, if snow and drainage conditions are favourable.
Slushflows in Norway are most frequent dining October–December but, due to limited snow depth of low density in early winter, they are less hazardous than those occurring in winter and spring. However, even slushflows in early season and small slushflows with low drops may cause considerable damage (Figs 3 and 4). Large slushflows may create flood waves in fjords and lakes. According to historical documentation, slushflows and snow avalanches are almost equally responsible for damage and economic losses.

Fig. 3. Destructive slushflows of low-density new snow. Newspapers reported two fatalities, and six injured, four houses and three cowsheds destroyed. Handnesøya, Nesna, North Norway, 16 January 1967. (Photograph by B. Madsen, Rana Blad.)

Fig. 4. A slushflow released at an elevation of 40 m above the farm destroyed four buildings. Average gradient of the path was 12.5°. Hjorteland, Suldal, West Norway, 3 March 1979. (Photograph by K. Strand. Haugesunds avis.)
Slushflow Release
Snowpack stability and slushflow release have been central problems in most of our scientific papers on slushflow (Reference HestnesHestnes, 1985yReference Hestnes and Sandersen.; Hestnes and others, 1987, Reference Hestnes, Bakkehøi, Sandersen and Andresen.1994; Reference Hestnes and Sandersen.Hestnes and Sandersen, 1987; Reference Hestnes and Bakkehøi.Hestnes and Bakkehøi, 1997). Some main results can be summarized as follows:
An abundant supply of free water in the snowpack is a principle requirement for triggering slushflows. Slushflow release occurs when the gravity component of the snowpack weight parallel to the slope exceeds basal friction and the tensile strength of the snowpack is exceeded. Critical water pressure may also develop above an impermeable layer in the snowpack (Fig. 5).

Fig. 5. The main factors controlling the relative rate of formation and discharge of free water in the snowpack.
Basal accumulation of water in the snowpack occurs when water supply exceeds discharge. The critical water supply may occur due to melting of new snow and rain during the autumn, due to high cyclonic activity in winter and during intense thaw in spring (Fig. 6). The temperature gradient of the atmosphere defines which part of a catchment area contributes water to the potential starting zone.

Fig. 6. The water level in the central part of this sloping snow-field is 1.3−1.5m. Telemark, South East Norway, 28 April 1984. (Photograph by E. Hestnes, NGI.)
Whether the snowpack will reach a critical stability during rain and snowmelt depends on a complex interaction between geomorphic factors, snowpack properties and the rate and duration of water supply. Slushflows may be released at successively increasing levels in a catchment area during weather periods of abundant water supply and rising temperature.
Most commonly, slushflows are a part of the process of breakup of drainage channels and streams but they also start from inclined bogs, depressions and open slopes, and from the transition zone between steep- and low-grade terrain. Snow-embanked, water-saturated snowfields and lakes are other potential starting zones (Figs 7 and 8).

Fig. 7. Starting zones of slushflows.

Fig. 8. Channelled slushflow track with stones and pools. A skier trying to cross the saturated snow in the stream channel was caught by the slushflow and perished. Kvam, Øystese, West Norway, 8 March 1981. (Photograph by F. Sandersen, NGI.)
Avalanche deposits, snowdrifts and ice may sometimes block natural drainage, causing water accumulation and release of slushflows. Slushflows may also start as wet slab avalanches. In such cases, liquefaction may occur instantaneously or when the snow mass reaches snowfields of higher water content. A saturated snowpack may also be triggered by sudden shock waves caused by the impact of an avalanche or a rockfall. Avalanches hitting lakes, either open or frozen, may force large bodies of water into snow-filled drainage channels and trigger slushflows (Fig. 7).
New snow of low cohesion and coarse-grained snow are most liable to start flowing. Coarse-grained snowpacks, with depth hoar at the base, provide the most favourable conditions for large slushflows. Large slushflows may also occur in stratified snowpacks and during spring break-up, when water is in abundance. A fine-grained snowpack is generally more stable than a coarse-grained one with respect to slushflow release. Snowpacks that, prior to the current weather period, are compact with hard or icy layers, normally show good stability. Hard crusts and icy layers may still have a considerable capability of absorbing induced tensile stresses after 3 days of submersion.
Human activity has led to slushflows, sometimes causing considerable damage. The main reasons are: filling in natural drainage, blocking drainage, diverting water thoughtlessly into snow-filled channels or outside existing drainage lines, etc.
Location and Ground Conditions
Slush-flows do occur within cultivated land, pasture, open forest with grass and bush vegetation, forested hillsides and in treeless mountainous terrain. The landforms and drainage basins vary widely in size, shape and geomorphic configuration. The size of the catchment area seems unrelated to the location of the starting zones.
Bare rock, ice and frozen ground often restrain infiltration of water to the ground. However, slushflows are also released on unfrozen ground. Along drainage courses, crown surfaces are normally located at sloping-rock surfaces and local drops in inclination, or in connection with pools or stones where water is ponding and the strength of the snow-pack is reduced. Slushflow releases, as a function of water supply, time, snowpack properties and ground conditions, have been examined (Reference Hestnes, Bakkehøi, Sandersen and Andresen.1Hestnes and others, 1994). Sloping rock surfaces are typical of starting zones with the highest frequencies of slushflow release (Fig. 9), while abundant water is needed to release slushflows from bogs of low gradient and flat-lying basins (Reference HestnesHestnes, 1985; Reference Hestnes, Bakkehøi, Sandersen and Andresen.Hestnes and Sandersen, 1987).

Fig. 9. Drainage on a sloping rock surface is a frequent location of slushflows. A small slushflow is released within a larger slushflow track on an open slope. Sjånesheia, Rana, North Norway, 28 January 1983. (Photograph by E. Hestnes, NGI.)
Slushflows are released at almost any level within drainage basins and at different levels and ground conditions in the same basin. The inclination in the starting zones normally varies between 0° and 30°. The highest slope angles are located in drainage courses and open slopes. The crown may be point- or slab-like. Observed heights and widths are between 0.1 and 7.0 and 1 and 1500 m, respectively (Reference HestnesHestnes, 1985; Reference Hestnes, Bakkehøi, Sandersen and Andresen.Hestnes and others, 1994).
Down-Slope Propagation and Run-Out
The size, down-slope propagation and run-out of slushflows depend on the size and shape of the starting zone, the geomorphic characteristics (local topography and roughness) of the path, the amount of snow, the texture and structure of the snowpack and the amount and intensity of the water supply. The size may range from a few square metres to several square kilometres.
The major morphological characters of starting zones and tracks have been described by Reference HestnesHestnes (1985). Channelled starting zones and flow paths are primarily connected to drainage channels or low water supply. However, they may also occur on open slopes (Figs 8 and 9). Scar-like starting zones and broad open paths are typical features of large slushflows. Bowl-like starting zones are typical for slushflows released from snow-embanked saturated snowfields and lakes. Enormous amounts of slush may sometimes drain from such starting zones.
Slushflows, in new snow of low cohesion and coarsegrained snow, tend to spread out downwards somewhat similarly to a loose-snow avalanche. The normal down-slope progress in dense fine-grained snow and stratified snow, forms flow paths with nearly parallel sides, if the gradient does not change. Extreme run-out is normally coupled with excessive water in connection with large slushflows, new snow or coarse-grained snow. After deposition of the masses, surplus water will drain out if the ground slopes.
Slush-flows often terminate in rivers, lakes and fjords. When terminating freely in the terrain, the inclination of the run-out zones normally is > 5° . Measured average angles (alpha angles) from the crown to the bottom boundary of the main accumulation of slush, varies between 3° and 20°, averaging 12.5°.
Return Periods and Climate
Large slushflows are most frequent in districts of recurrent favourable weather conditions assuming other conditions are similar. The size differences will even up over a long period of time. However, in Norway there will always be regional differences due to a large variety in ground conditions and climate. Prognostic values of expected maximum precipitation are useful when estimating return periods (Fig. 10) (Reference Hestnes and Sandersen.Hestnes and Sandersen, 1995).

Fig. 10. Return period of expected maximum precipitation during January–March at the meteorological station in Geiranger, North West Norway.
Starting zones on slopes exposed to wind during frontal passages will normally be most susceptible to releases. They receive the highest influx of sensible and latent heat from the atmosphere, and thus the highest amount of melt water, and also often the highest amount of precipitation. During spring thaw, catchment areas facing the incoming radiation reveal favourable slushflow conditions (Reference Hestnes, Bakkehøi, Sandersen and Andresen.Hestnes and others, 1994).
Hazard Evaluation
Due to the fact that water is part of the driving force, evaluation of slushflow hazard is much more complicated than evaluation of avalanche hazard. Slushflow prone areas are identified based on the summarized geomorphic characteristics and climate indices as well as historical evidence and estimation of run-out.
Newspapers and historical documents are important sources of information. Unfortunately, these sources primarily deal with destructive events (Figs 2–4). Eye-witnesses may have additional information.
Working on “flowing mixtures of water and snow” one must be aware that this phenomenon has no unique name in documents or among people. In fact, a confusing mixture of descriptive terms is used. Thus, written information has to be interpreted and questions have to be instructive in a non-leading way, to acquire correct knowledge (Reference Hestnes, Bakkehøi. and SivardièreHestnes and Sandersen, 1995).
Typical predictors of potential slushflow hazard are:
Water accumulation in snowpack (depressions, level ground);
High water table and drainage atop snow in channels;
Slumping snow on sloping rock in brooks;
Minor slushflows in drainage channels;
Slush-flows observed in the district;
Abundant water supply (precipitation, snowmelt);
Persistent or increasing rainfall, temperature and wind.
Normally, there will be no potential hazard without any such signs, unless a sudden blocking of drainage or supply of water into snow-filled channels or genuine terrain should occur.
Snowpack stability is a result of the changes of the snowpack throughout the winter and the weather conditions during the critical period of water supply. The texture and structure of the ultimate snowpack can be deduced from local meteorological records (Reference Hestnes, Bakkehøi, Sandersen and Andresen.Hestnes and Sandersen, 1987; Reference Hestnes and Sandersen.Hestnes and others, 1987, Reference Hestnes, Bakkehøi, Sandersen and Andresen.1994).
Snow-pit observations at the potential slushflow sites are, however, preferable to meteorological analysis. Stress testing with a ski pole is used as an indicator of strength reduction of the snowpack due to submersion. The fluctuation of water level in the snowpack is an important stability indicator. Quantitative methods for in-situ stability testing of water-saturated snow would be welcome.
A sharp rise of water level in drainage courses is critical to slushflow release. Site-specific factors like location, aspect and drainage condition, as well as different snow-related factors, are controlling the fluctuation of water level and timing of peak water during high-water influx. Pressure transmitters may be used for supervision of water fluctuation at critical locations (Reference Hestnes and Bakkehøi.Hestnes and Bakkehøi, 1997).
The registered duration of rain and snowmelt before slushflow release due to cyclonic activity is 5–36 hours. The observed melting periods during the spring thaw normally persisted for 5–16 days; however, the intense period is sometimes less than 24 hours.
The water supply to the snowpack is controlled by the energy balance at the snow surface, i.e. the duration of the melting period and the complex interaction of the following factors:
Precipitation (type and intensity);
Wind (speed and gusting, i.e. turbulence);
Humidity (saturation);
Temperature (height);
Radiation (intensity).
Meltwater production as a function of these parameters has been discussed by Reference Hestnes and Sandersen.Hestnes and others (1987). A relation between three of the parameters and the contribution of meltwater is shown in Figure 11.
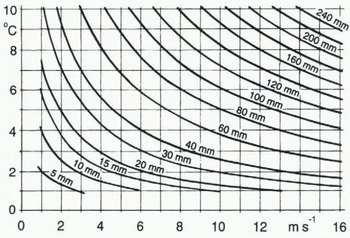
Fig. 11. Meltwater per day as a function of temperature and wind speed. Humidity 100%.
During acute periods, hazard prediction and warning are currently updated. The analyses are based on meteorological records and forecasts, as well as on-line access to quantified prognosis (Fig. 12) and weather charts from the Norwegian Meteorological Institute (Reference Hestnes, Bakkehøi. and SivardièreHestnes and Sandersen, 1995).

Fig. 12. Meteogramme. The quantified 48 hour weather forecast has a 3 hour resolution and is updated every 6th hour. Legend: cloudiness (high, medium, low, fog— in units of 1/8), air pressure (mbar), temperature (°C), precipitation (mm) and wind velocity (kt). Meteogrammes of 2, 5 and 7 days can be obtained from the Norwegian Meteorological Institute for any location in Norway.
Estimation of Water Supply
Reliable estimates of water supply are important in acute hazard prediction. The amount of rain and snowmelt received per unit area in the starting zones is estimated, based on records from the nearest meteorological stations transformed to the actual slushflow sites (Reference Hestnes, Bakkehøi, Sandersen and Andresen.Hestnes and others, 1994). Estimations may also be carried out based on prognostic input data.
Aerological diagrams (radiosonde data) serve as a basis for transforming the recorded temperature values, because weather conditions with inversion or a constant temperature below 1000 m are very frequent.The wet adiabatic lapse rate is used, only if in accordance with the aerological observations.
The humidity at the site is calculated using the registered water-vapour pressure and corrected temperature. The type and amount of precipitation is estimated based on the transformed temperature values, recorded precipitation characteristics, topographic conditions and subjective judgements.
Extrapolation of wind speed is also normally required. The recorded wind speed is then transformed to the slushflow sites by an empirical formula involving distance, height differences and roughness parameters. Often the wind field also has to be corrected for convergence or divergence. The complete formula and the parameters involved have been shown by Reference Hestnes, Bakkehøi, Sandersen and Andresen.Hestnes and others (1994).
Calculation of snowmelt is primarily based on an energy-balance model outlined for western Norway (Reference HarstveitHarstveit, 1984). Generally, the contribution due to changes in the internal energy of the snowpack, the heat flux from the ground and energy gained from rainwater is negligible and can be disregarded. In bad weather, with heavy cloud cover, the net radiation of the snow cover is also small compared with the latent- and sensible-heat fluxes from the atmosphere.
Multiple calculations are carried out to minimize the error in estimation of the total water supply. The period of water contribution to the snowpack is subdivided into time intervals of almost uniform conditions. Each interval has a new set of transformed input values. Rainfall and meltwater estimations are undertaken within each interval. The total amount of rain and meltwater is given by adding the estimated values.
Back-calculation of the water supply of 80 slushflow events indicates that meltwater accounts for 5–45% of the total water supply in periods of cyclonic warm fronts. Rainfall usually contributed less than 5%, but it was also as much as 65% of the water supply during spring-thaw situations. Net radiation constitutes 20–50% of the energy budget during spring breakup (Reference Hestnes, Bakkehøi, Sandersen and Andresen.Hestnes and others, 1994).
World-Wide Knowledge of Slushflows
The phrase “flowing mixtures of water and snow” was encountered in the English literature, before 1980, almost exclusively in reports from uninhabited Arctic and subArctic regions, and related to the spring break-up or intensive snowmelt periods during the summer (Reference WashburnWashburn, 1979). In seeking information about the phenomenon, a questionnaire was distributed world-wide in 1988 (Reference Hestnes and Onesti.Hestnes and Onesti, 1988; Reference Onesli and Hestnes.Onesti and Hestnes, 1989).
The purpose of the questionnaire was to determine the geographical distribution of slushflow activity, as well as to collect information concerning the commonest nomenclature, release conditions, periods of occurrence, type of terrain upon which they occur, geomorphic activity, type of damage and hazard control. Secondly, we wanted a general view of the current level of understanding of the formation process and ongoing research activities in this field in various countries.
Persons with first-hand experience of die slushflow process were identified via the questionnaire. The answers have definitely established that slushflows occur in lower latitudes as well as in the Arctic and that the slushflow hazard has not received the emphasis deserved. Dr S. Myagkov, Leader of the Snow Avalanche and Mudflow Laboratory, Moscow State University, has pointed out that within the former Soviet Union slushflows are common from Arctic to subtropical regions. It is more than likely that slushflows occur in all countries having a seasonal snow cover. The frequency-seems to reflect the climatic conditions and infiltration capacity of the substratum.
Other main characteristics are:
Heavy rainfall may cause slushflows at any time during the winter, particularly in areas with a marine west-coast type of climate where winter rainfall is common.
Stream courses and shallow depressions are the commonest locations of starting zones and slushflows are a significant geomorphic agent.
There is an increasing encroachment of human activity into potential slushflow zones.
The questionnaire also revealed that no country seems to have a unique term relating to the phenomenon. Consequently, other countries have the same difficulties of identification and communication about slushflows as does Norway. In fact, some scientists claim there is no such entity between wet-snow avalanches and water flow. In this respect, we have been accused of bungling the understanding of snow avalanches.
Nevertheless, numerous names have been used by scientists and practitioners when describing “flowing mixtures of water and snow” (cf. Reference BreyfoggleBreyfoggle, 1984). Some of the following English terms might be familiar to readers: wet-snow avalanche, slush avalanche, slurry avalanche, slush torrent, slushflow, snow–water flow, flood, rain-on-snow event, oddball avalanche, etc.
To resolve the terminology and seek a unique scientific term, participants in the Circum-Arctic Slushflow Workshop in Kirovsk, Russia, in 1992 decided to recommend slushflow as an overall term for all “flowing mixtures of water and snow”. The term is the same as that used by Reference Washburn and Goldthwait.Washburn and Goldthwait (1958). Dr. Washburn has approved the recommendation as well as the previous questionnaire.
Summary
Slushflows — flowing mixtures of snow and water — are a major natural hazard in Norway. According to historical documentation, slushflows and snow avalanches are almost equally responsible for both damage and economic losses. Districts exposed to high cyclonic activity during the winter are most liable to slushflow hazard. Slushflows released during intense thaw in the spring primarily affect uninhabited areas. Slushflows are released when the gravity component of the snowpack weight parallel to the slope exceeds basal friction and the tensile strength of the snowpack is exceeded. Whether the snowpack reaches a critical stability during rain and snowmelt depends on a complex interaction between geomorphic factors, snowpack properties and the rate and duration of water supply. Drainage courses, shallow depressions, snow-embanked water-saturated snowfields, bogs and lakes are potential starting zones. New snow and coarse-grained snow are the most liable to start flowing and tend to spread out downwards. A rapid rise of water level in the snowpack is critical to slushflow release. Hazard prediction and warning are based on field observations, meteorological records and forecasts, and on-line access to quantified prognosis and weather charts. Prognostic values of water supply can be estimated. Our scientific work has revealed that slushflows are a world-wide phenomenon and that the results of our studies in Norway have general validity.
Acknowledgements
The author wishes to thank all those who have contributed to the knowledge of slushflows: local informants, journalists, photographers, students, scientists and authors of scientific papers, from all over the world. Specifically, I wish to lake the opportunity of expressing my thanks to former co-authors, L. Andresen, S. Bakkehøi, L.J. Onesti and F. Sandersen and colleagues and respondents world-wide, for stimulating discussions and fruitful co-operation.
The author also wish to thank the Norwegian Meteorological Institute which made meteorological data available and their representative K. Harstveit for stimulating discussions. Special thanks go to the encouraging staff at the local Road Department in Rana for their assistance and excellent accommodation during 6 years of field research.
The scientific work on slushflows has received financial support from the former Royal Norwegian Council for Scientific and Industrial Research, the National Fund for Natural Disaster Assistance, the Norwegian Pool for Natural Perils, the Norwegian Hydrological Committee, the Nansen Foundation, the Norwegian Railroad Authorities, the Norwegian Road Authorities, the County Road Authorities of Nordland, the Norwegian Geotechnical Institute and the Department of Geology, Indiana University, U.S.A. This support is gratefully acknowledged by the author and his colleagues at the Norwegian Geotechnical Institute.


