


INTRODUCTION
Bomb radiocarbon (14C) was produced in the 1950–1960s from atmospheric thermonuclear weapons testing primarily in the Northern Hemisphere (Hesshaimer et al. Reference Hesshaimer, Heimann and Levin1994). This period is increasingly viewed as a near-universal marker of the beginning of the Anthropocene (Turney et al. Reference Turney, Palmer, Maslin, Hogg, Fogwill, Southon, Fenwick, Helle, Wilmshurst, McGlone, Bronk Ramsey, Thomas, Lipson, Beaven, Jones, Andrews and Hua2018). Since peaking in the early 1960s, tropospheric Δ14C has declined over time due to exchange with both the terrestrial (Trumbore Reference Trumbore2000) and ocean (Druffel and Suess Reference Druffel and Suess1983; Broecker et al. Reference Broecker, Peng, Ostlund and Stuiver1985) reservoirs, and also the burning of 14C-free fossil fuels (Hesshaimer and Levin Reference Hesshaimer and Levin2000). Fortuitously, bomb 14C provides a unique way to “age” recent (less than ∼60 years old) organic matter within 1–3-year resolution by accelerator mass spectrometry (AMS). Thus, quantifying the incorporation of bomb 14C into different pools or tissues allows for estimating residence times and sources of carbon, and is a powerful tracer to study the modern global carbon cycle (Hua and Barbetti Reference Hua and Barbetti2004).
Tropospheric records of bomb 14C are based on atmospheric CO2 captured by alkaline solution and flasks from land (e.g., Levin and Kromer Reference Levin and Kromer1997; Turnbull et al. Reference Turnbull, Mikaloff Fletcher and Ansell2017), aircraft (e.g., Telegadas Reference Telegadas1971), and tree-ring records (e.g., Stuiver and Quay Reference Stuiver and Quay1981; Yamada et al. Reference Yamada, Yasuike and Komura2005) from a small but increasing number of locations on Earth (Hua et al. Reference Hua, Turnbull and Santos2022). These records show differences in the magnitude and timing of the bomb spike across the northern and southern hemispheres due to location and size of bomb detonation, atmospheric transport, and mixing times (Hesshaimer and Levin Reference Hesshaimer and Levin2000). With growing interest in studying the global carbon cycle, and increased accessibility of measurements of 14C by AMS, sampling locations added in the past two decades have led to better spatial and temporal representation (Levin et al. Reference Levin, Hammer, Kromer, Preunkert, Weller and Worthy2022). Hua et al. (Reference Hua, Barbetti and Rakowski2013, Reference Hua, Turnbull and Santos2022) compiled bomb 14C records to develop a set of synthetic datasets that accounted for atmospheric transport and mixing. These calibration curves are specific to five latitudinal zones, and offer improved regional dating accuracy, but the potential for local deviations from these zonal curves has not been fully characterized.
The objective of this work was to develop a century-long bomb 14C record for the southern Colorado Plateau region of the southwestern United States. The Colorado Plateau is a remote area spanning parts of Arizona, Utah, Colorado, and New Mexico. It is characterized by low population density, high elevation, and a generally arid environment. This region has a bimodal precipitation pattern, with winter snow and rain (November–April) and summer monsoon rainfall (July–September). We took advantage of annual plants as unique samplers of atmospheric 14CO2 to construct this record. Annual plants can have certain advantages over traditional flask sampling and tree-ring records. First, annual plants complete a lifecycle in less than one year (usually one season). In contrast to long-lived plants like trees, annual plants do not have nonstructural carbon stored from previous years that can be used to grow biomass (e.g., tree rings; Carbone et al. Reference Carbone, Czimczik and Keenan2013; McDonald et al. Reference McDonald, Chivall, Miles and Bronk Ramsey2019) in subsequent years. Thus, with the exception of the initial seed from which it is grown, all carbon in an annual plant is produced from atmospheric CO2 assimilated within the same year or season. Second, annual plants sample the atmosphere through photosynthesis over many days to months, integrating the atmospheric 14CO2 signal over longer periods than flask sampling (minutes to hours). Finally, annual plants are common and widely distributed, and include many crops and non-native weedy species that can be found across ecosystems and therefore are often present in herbaria collections.
The value of annual plants as a proxy for atmospheric 14CO2 has been known for many years (Godwin Reference Godwin1969). Annual plants have been used to develop short term (< 10 years) site-specific background atmospheric 14CO2 records to accurately date recent terrestrial organic matter when anthropogenic fossil fuel emissions may cause localized lower 14CO2 relative to the northern hemispheric average (Carbone et al. Reference Carbone, Czimczik and Keenan2013; Richardson et al. Reference Richardson, Carbone and Keenan2013; Furze et al. Reference Furze, Huggett, Aubrecht, Stolz, Carbone and Richardson2018, Reference Furze, Huggett and Chamberlain2020). Creatively, annual plants have been collected across large spatial scales to map and quantify contributions of fossil fuel derived CO2 to the atmosphere in a given year (Hsueh et al. Reference Hsueh, Krakauer, Randerson, Xu, Trumbore and Southon2007; Riley et al. Reference Riley, Hsueh and Randerson2008; Wang and Pataki Reference Wang and Pataki2010, Reference Wang and Pataki2012). Most recently, Hüls et al. (Reference Hüls, Börner and Hamann2021) created a 75-yr 14CO2 record from annual plants (agricultural wheat seed archives) documenting bomb 14C as well as the fossil fuel contributions over the past four decades.
In recent decades, archived herbarium specimens have increasingly been used to study the impact of global change on plants (Meineke et al. Reference Meineke, Davis and Davies2018; Lang et al. Reference Lang, Willems, Scheepens, Burbano and Bossdorf2019). Specific examples include early studies investigating the effects of rising atmospheric CO2 on both stomatal density (Woodward Reference Woodward1987) and leaf isotopic composition (δ13C; Peñuelas and AzcónBieto Reference Peñuelas and Azcón-Bieto1992), as well as the effects of increasing temperature on both phenology (Willis et al. Reference Willis, Ellwood and Primack2017) and herbivory (Meineke et al. Reference Meineke, Classen, Sanders and Jonathan Davies2019). We are not aware of herbarium records having been used previously to develop a long-term record of 14CO2 in the atmosphere.
Here, we present the application of an herbarium collection of annual plants to develop a smoothed annually resolved record of bomb spike 14C, from 1910 to 2021. We describe the 14C timeseries derived from analysis of 100 individual annual plant samples, and compare these samples to existing western U.S. records, as well as the most current calibration curves for the region. We then use smoothing techniques to develop a synthetic, annual-resolution (summertime values) curve with uncertainty for local dating of terrestrial organic matter. Finally, we discuss the potential to use annual plants, including leveraging of herbaria collections, to complement existing records and further improve understanding of local-to-regional variation in tropospheric 14CO2.
METHODS
Annual Plant Samples
Archived annual plant specimens were sampled from the Deaver Herbarium (ASC) at Northern Arizona University in Flagstaff, Arizona, USA (Thiers Reference Thiers2022). We chose herbarium specimens based on annual plants species that had the best representation and abundance during the period 1950–2016. Herbarium specimens in order of abundance include Xanthisma gracile, Townsendia annua, Plantago argyraea, Erigeron divergens, Bromus rubens, and Bromus rigidus. We prioritized specimens from Coconino and Yavapai counties, which include the southern Colorado Plateau and the adjacent Arizona transition zone of the Mogollon Rim. From each specimen, ∼10 mg of leaf, flower, and/or inflorescence material was removed with tweezers, weighed, and placed in a glass vial. We attempted to sample different regions of each specimen, both basal and distal, to ensure that sampling was representative of the atmosphere during the entire period of growth. We were careful to avoid areas of the plant that had been attached with glue or tape to the specimen mounting paper. Figure 1 shows an example of a Xanthisma gracile specimen from 1964 that was sampled for 14C.
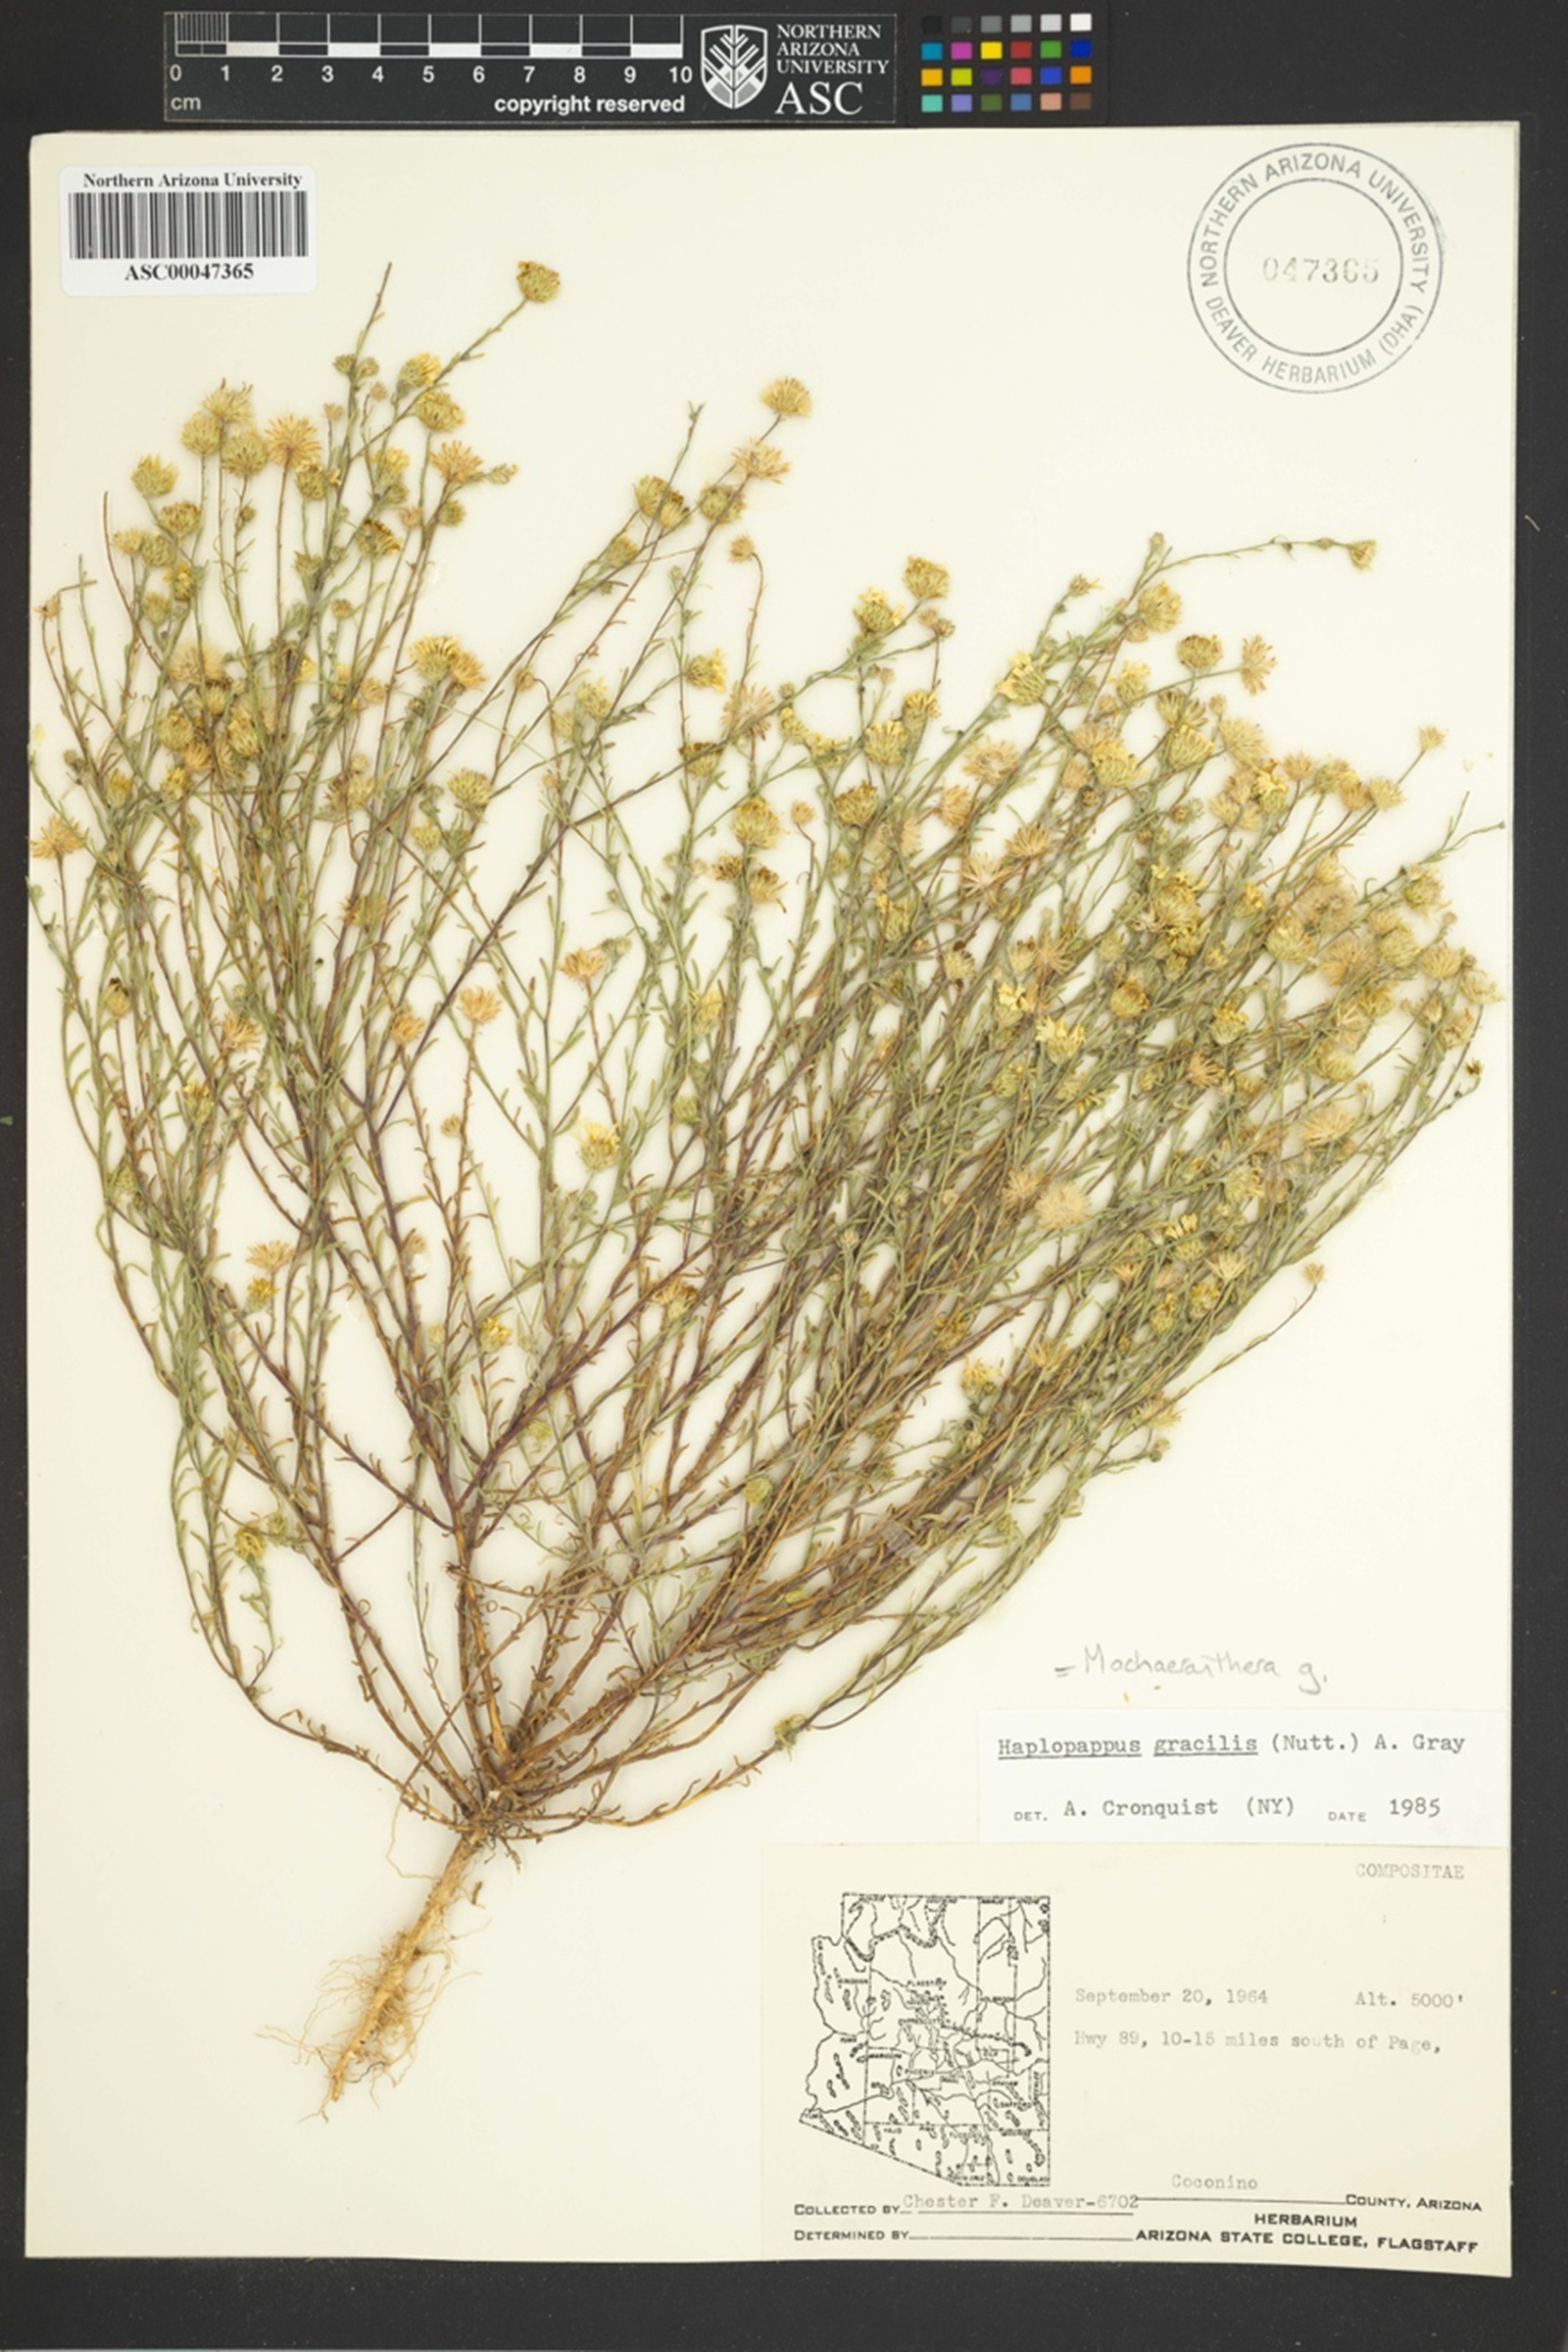
Figure 1 Example of a Deaver Herbarium annual plant specimen (Xanthisma gracile) that was harvested in 1964 at the peak of bomb spike in Flagstaff, Arizona, USA.
Additional annual plants were collected by the authors in the Flagstaff area from 2015–2021. These include Bromus tectorum, Lupinus kingii, Ambrosia acanthicarpa, and Solanum lycopersicum. Plants were harvested at the end of the summer growing season (August and September). After oven-drying at 60°C, leaves were homogenized with mortar and pestle. No chemical pretreatment or washing of plant material was conducted on herbarium specimens or field samples. Potential carbon contamination by dust or human oils was assumed to be minimal in comparison to the carbon in the sample.
14C Analyses
All annual plant samples were prepared for 14C analysis in 2021 at the Arizona Climate and Ecosystem (ACE) Isotope Laboratory at Northern Arizona University. For each sample, approximately 2.5 mg of dry organic matter was weighed into a tin capsule and converted to graphite using the Automated Graphitization Equipment (AGE 3, Ionplus, Switzerland). The 14C content of the graphite was measured using accelerator mass spectrometry (AMS) on a Mini Carbon Dating System (MICADAS, Ionplus, Switzerland). The data (decay corrected Δ14C) are reported in per mil (‰) following standard methods (equation 3.19) summarized in Trumbore et al. (Reference Trumbore, Sierra and Hicks Pries2016). Instrument error is reported for all Δ14C data; for most samples, it was approximately 1–2‰.
Data Analyses
Annual plant Δ14C values were compared to the most current synthetic records for the Northern Hemisphere zone 2 from Hua et al. (Reference Hua, Turnbull and Santos2022) referred to as NHZ2 summer and NHZ2 monthly from here on. From 1950 to 1972, the NHZ2 summer is a compilation of samples from atmospheric CO2 captured by alkaline solution (in Spain, Israel, and Senegal) and tree rings (Oregon, Arizona, Mexico, Japan, and South Korea) from clean-air sites. From 1973 to 2019, Hua et al. (Reference Hua, Turnbull and Santos2022) does not distinguish different zones for the Northern Hemisphere record and synthesizes many more samples and locations across the Northern Hemisphere. The NHZ2 monthly is derived from similar records as the NHZ2 summer with additional curve fitting and smoothing. We compared our data against the NHZ2 monthly record, with the difference (commonly reported as ΔΔ14C) calculated as (annual plant Δ14C) – (NHZ2 Δ14C), using the NHZ2 value for the month in which the annual plant was harvested. To account for the potential integration of 14C in annual plant biomass as the plant grows, the difference between annual plant Δ14C and the mean NHZ2 value of the previous 1, 2, and 5 months was also calculated, representing integration times of 2, 3, and 6 months, respectively. Total error for ΔΔ14C was combined in quadrature from the NHZ2 monthly dataset 1σ uncertainty, and the annual plant AMS instrument error.
To develop an annual resolution 14C smoothed record applicable for the southern Colorado Plateau centered near Flagstaff from 1911–2021 (nicknamed RITA, Radiocarbon In Terrestrial Annuals), we used loess smoothing (PROC LOESS in SAS OnDemand for Academics, https://welcome.oda.sas.com/; SAS Institute Inc., Cary NC, USA) to fit a nonparametric local regression surface. We used the original date of collection for all annual plants, and because our dataset was lacking any samples collected between the spring of 1952 and the summer of 1959 we used 1950–1959 data (annual summertime means) from NHZ2 as a secondary constraint. We weighted our observations as the reciprocal of the squared analytical uncertainty (average 2‰), while we weighted NHZ2 summer values using the reported 1σ uncertainty (average 6‰, with a range from 2‰ to 11‰. We then compared the resulting RITA curve (Supplemental Table S1) against the NHZ2 summer curve, as well as the 1850–2015 curve presented by Graven et al. (Reference Graven, Allison and Etheridge2017). Uncertainty estimates (1σ) for the RITA curve were calculated from the LOESS regression residuals, and hence these can be interpreted as the expected range within which an individual new measurement might fall, conditional on the data and our regression model.
RESULTS
Annual Plant Sample Characteristics
All 100 annual plant samples (Table 1) grew in Arizona, within proximity to the small city of Flagstaff (Figure 2a). Annual plant samples spanned more than a century, growing between 1910–2021 (Figure 2b), with a larger proportion of samples intentionally selected in the 1960–70s to best capture the rapid changes caused by the bomb spike. Increased sample numbers were also prioritized for the last decade 2010–2021 to better document the flattening of the curve and continuation below 0‰. There were no annual plants sampled in the years 1953–1958. The majority of the annual plant samples were harvested at the end of the spring (May–June) and summer (August–September) seasons in correspondence with the bimodal precipitation pattern in Arizona (Figure 2c). Samples were dominated by those that grew within 50 km of Flagstaff (Figure 2d) at an elevation of over 2000 m (Figure 2e). We estimate the average lifespan, or atmospheric 14C sampling/integration period, of the plants before being harvested was 1–3 months, and at most 6 months.
Table 1 Annual plant samples collected near Flagstaff, Arizona, USA. All samples were analyzed for 14C content in 2021 at Northern Arizona University’s Arizona Climate and Ecosystems Isotope Laboratory. Plant materials sampled are leaf (L), flower (F) and inflorescence (I, for grasses only indicating the seedhead).

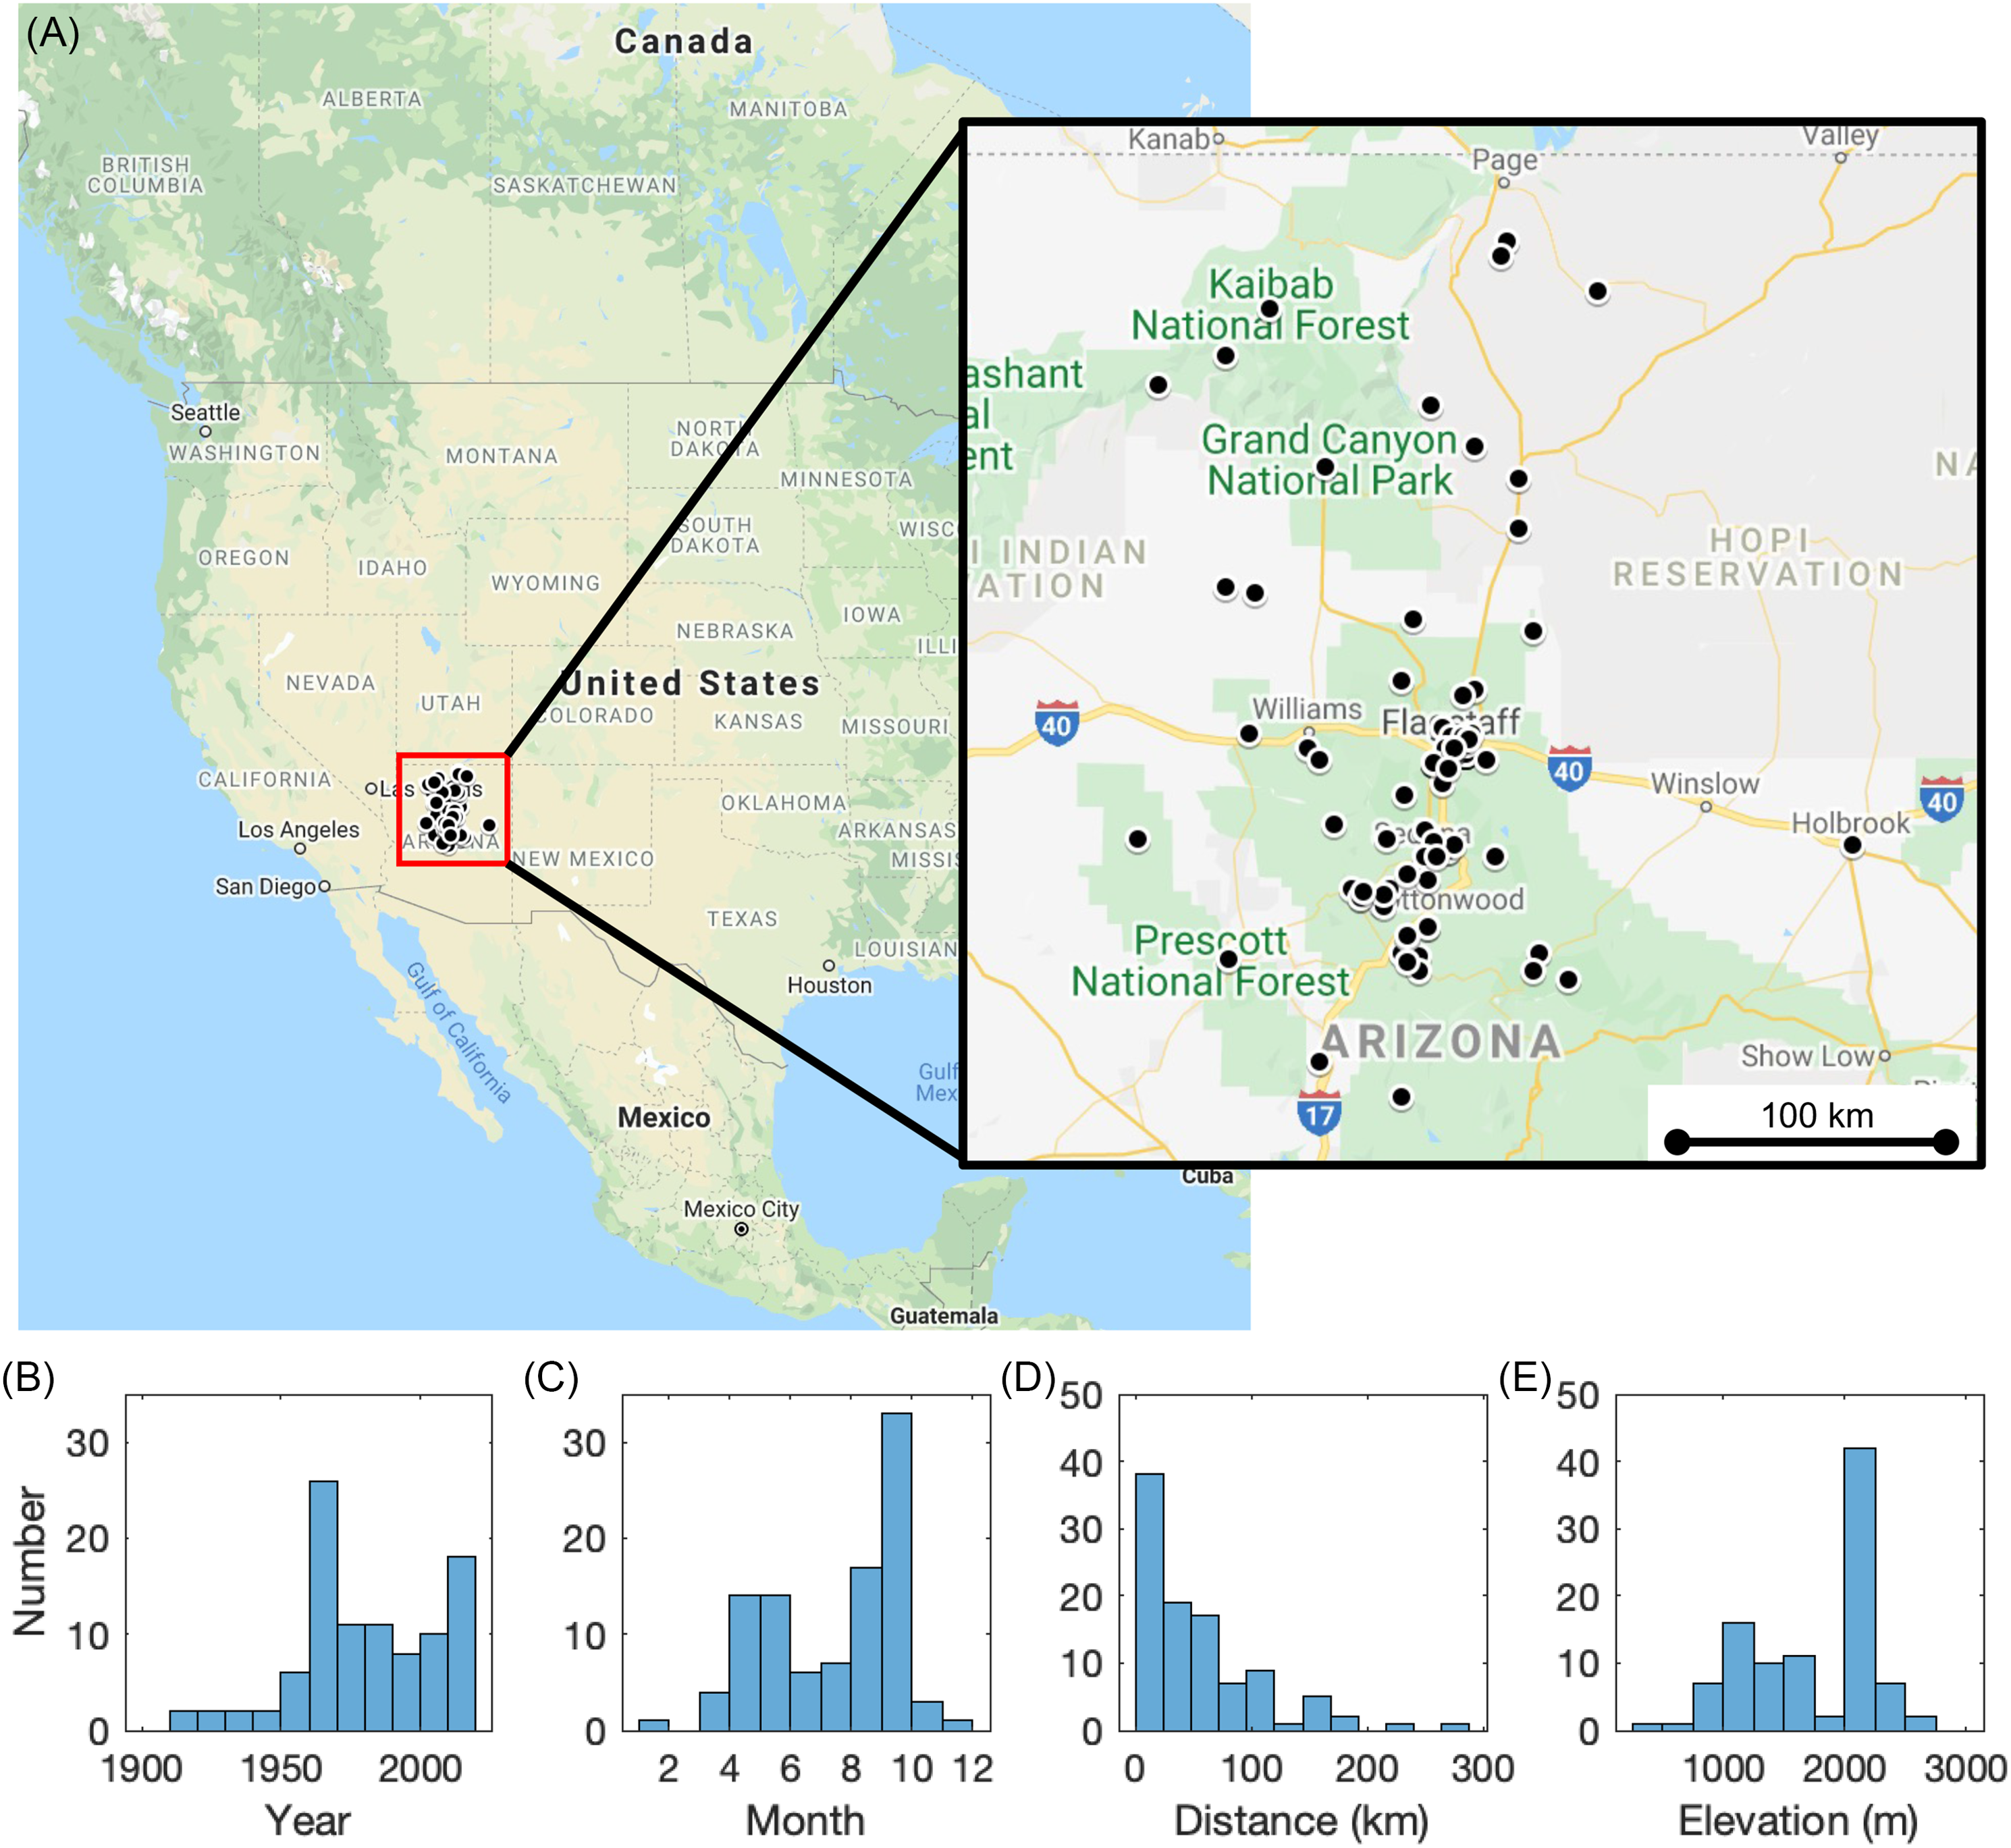
Figure 2 Annual plant sample characteristics. (A) map showing North America with inset of the area surrounding Flagstaff; black dots represent locations where the 100 annual plant samples were collected. Histograms of annual plant samples (B) year of growth; (C) month of sample collection; (D) distance (km) from Flagstaff, AZ, USA; and (E) elevation (m).
Annual plant Δ14C separated by genera are plotted against the NHZ2 summer record (Figure 3a–f). Annual plant Δ14C ranged from –44‰ in 1951 to 797‰ in 1964. In comparison to the NHZ2 record, no measurable bias in Δ14C was detected in the samples when ΔΔ14C was analyzed by genera of annual plant, elevation, or proximity to Flagstaff. There was a minor bias in Δ14C depending on month of harvest (see Supplemental Figures S1 and S2a–c). The samples that deviate largely from the NHZ2 record (ΔΔ 14C < –100‰) in Supplemental Figures S1 and S2 occurred between October 1962 and July of 1963 and are discussed below.

Figure 3 Radiocarbon data (‰). (A) For 100 annual plant samples with Xanthisma (blue), Townsendia (red), Plantago (orange), Erigeron (purple), Bromus (green), Various other species (light blue). Error is smaller than the size of the symbol. Black line is the summertime annual zone 2 Northern Hemispheric record from Hua et al. (Reference Hua, Turnbull and Santos2022) with reported error shaded grey. (B) Linear regression of pre-bomb period (1910–1952; ‰ ± instrument error). (C–F) Zoomed-in plots of same data shown in (A) for specific years; y-axis plots differ across plots. Error is much smaller than the size of the symbol.
Pre-Bomb 14C
The pre-bomb period with samples between 1910 and 1952 shows a strong decline with a slope of –0.6‰ per year (r2 = 0.7 p<0.001; Figure 3b). This trend is similar to that observed previously (Stuiver and Quay Reference Stuiver and Quay1981). The decline in the Δ14CO2 of the atmosphere is called the Suess effect (Keeling Reference Keeling1979) following work by Hans Suess (Suess Reference Suess1955; Revelle and Suess Reference Revelle and Suess1957) and is caused by the addition of 14C-free CO2 to the atmosphere from anthropogenic burning of fossil fuels. However, the annual plant sample Δ14C values are lower (–8±2‰, mean ± 1SE, n = 11) than the NHZ2 record, indicating a higher local anthropogenic background which coincides with major timber and railroad industries centered in Flagstaff (Reid Reference Reid2014).
Bomb Spike 14C
Differences between the NHZ2 record and the annual plants occurs with the rise and peak of the bomb spike in the 1960s. Figure 4 shows the difference in Δ14C between the annual plant samples and the NHZ2 monthly record where values below zero pre-1964 indicate the annual plant values were lower than the NHZ2 monthly record and values above zero post-1964 indicate annual plant values were higher than the record. This suggests a delayed rise (1962–1963) and fall (1964–1966) in atmospheric Δ14C in comparison to the NHZ2 monthly record. We explored whether some of this difference in timing could be due to different integration time (or growing time) of the plants. Increasing the integration time improved the agreement of the records, however even with a 6-month integration time (maximum estimated for these plant species, and likely not most representative) there is still a delay in peak of the bomb spike in comparison to the NHZ2 records.

Figure 4 Difference (ΔΔ14C‰) between the annual plant radiocarbon data and NH zone 2 monthly radiocarbon record from Hua et al. (Reference Hua, Turnbull and Santos2022) for integration times of the same month (black dots), 2 months (red dots), 3 months (blue dots), and 6 months (magenta dots). Smoothed spline lines of same colors to show patterns more clearly. X error bars represent the integration time of the NH zone 2 record. Y error bars represent ± combined reported error of both datasets. Dashed horizontal line is 0‰. Dashed vertical line is January 1964.
The annual plants have elevated Δ14C in comparison to the NHZ2 records since 2015, differing from the summer values by as much as 4‰ (3±1‰, mean ± 1SE, n = 8), and only reaching zero in 2021, one to two years later than NHZ2 (Figure 3f). Finally, there is a noticeable flattening of the curve in 2020 and 2021, attributed to reduced fossil fuel emissions during the COVID-19 pandemic (Liu et al. Reference Liu, Ciais and Deng2020).
RITA Curve
Discrepancies between our annual plant samples and the most current synthetic record (see Figures 4 and 5) justify the need for more local records for accurate 14C dating of terrestrial organic matter. While generally similar to annual-resolution summer atmospheric Δ14C records presented by Hua (NHZ2) and Graven et al. (Reference Graven, Allison and Etheridge2017), our smoothed RITA curve (Supplemental Table S1) is slightly but consistently lower (more negative Δ14C, by ≈6±2‰, mean ± 1SD) than the Graven curve over the period 1910–1949; the average RITA uncertainty over this period is 5‰. RITA does not rise as rapidly in the early 1960s as either NHZ2 or Graven, although RITA’s peak value (800 ± 27‰, mean ± 1σ) in the summer of 1964 is intermediate between NHZ2 (784 ± 33‰) and Graven (836‰). In individual years between 1970 and 1985, deviations of up to ±15‰ between RITA and both NHZ2 and Graven are common. The RITA uncertainty during this period is 7‰ vs. NHZ2 of 9‰. Beginning in 1988, when RITA (at 158±6‰) is lower than either NHZ2 (172 ± 5‰) or Graven (175‰), the distance between all three curves progressively shrinks over the following two and a half decades. By about 2000, the difference between the three curves is reliably less than 5‰, which is comparable to the year-over-year decrease in Δ14C in all three curves, and similar in magnitude to the RITA uncertainty of 6‰. Intriguingly, since the summer of 2015 RITA has been somewhat higher than NHZ2, particularly in the most recent years. The strong 1-year lag autocorrelation (r = 0.84, over the period 1980–2019) of differences between RITA and NHZ2 shows that there are systematic discrepancies between our local record and NHZ2, which persist over time and cannot be attributed to random error.

Figure 5 Comparison of Δ14C‰ of subannual tree ring records from Washington (Sitka spruce, blue dots), Oregon (SNO White oak, red dots), atmospheric records from California (China lake, light blue dots), annual plant radiocarbon data (black dots), RITA record (black line), NH zone 2 annual (blue line) and NH zone 2 monthly (red line) radiocarbon record from Hua et al. (Reference Hua, Turnbull and Santos2022). Y error bars represent reported uncertainty estimates.
NH Zone 2
In Figure 5, we compare the annual plant data and RITA record to the NHZ2 curves (annual and monthly), and existing bomb 14C records of subannual tree rings of Sitka spruce from Washington (Grootes et al. Reference Grootes, Farwell, Schmidt, Leach and Stuiver1989), the Sheridan Novitiate Oak (SNO; white oak) in Oregon (Cain et al. Reference Cain, Griffin, Druffel-Rodriguez and Druffel2018), and atmospheric CO2 captured by NaOH at China Lake, California (Berger et al. Reference Berger, Fergusson and Libby1965, Reference Berger and Libby1966, Reference Berger and Libby1967, Reference Berger and Libby1968, Reference Berger and Libby1969, Reference Berger, Jackson, Michael and Suess1987). The datasets are difficult to quantitatively compare due to differences in the timing of sample collections, but visually the annual plant record and RITA curve have a delayed rise and also a muted bomb peak in comparison to the other records. The annual plant data and RITA record are most similar to the NHZ2 curve, confirming the location of the Flagstaff region within NH Zone 2 along with the Oregon record, whereas the Washington and California records are believed to be in NH Zone 1 (Hua et al. Reference Hua, Turnbull and Santos2022).
DISCUSSION
Unique Regional 14C Record
Our annual plant record of 14CO2, derived primarily from herbarium specimens, generally agrees with the regional synthetic record by Hua et al. (Reference Hua, Turnbull and Santos2022), but, surprisingly, our data show that there is some evidence for a more delayed arrival of the bomb spike in the southwestern U.S. than has been previously believed. With annual plants, we were able to identify independent herbarium specimens that differed in their active growing season, and spring versus summer phenologies, due to the steep elevation and climate gradient in Arizona. This sampling allowed for fine resolution independent 14C measurements in October of 1962, March, May, and July of 1963 that recorded a delayed arrival of the rise in the bomb spike. Additional specimens in 1964–66 recorded a delay in the subsequent decline in the bomb spike. By broadening our search parameters to include a wider radius around Flagstaff, it may be possible to include samples from a larger number of sites, all of which could still be considered “regional,” and thereby improve the temporal resolution of our record during this period when the atmospheric 14CO2 signal is extremely dynamic. This delay is most likely due to atmospheric circulation, where the polar and sub-tropical jet moved northward during this time period introducing air masses from the south with lower Δ14CO2 values (Hua et al. Reference Hua, Turnbull and Santos2022). Another explanation for the delay could be that the annual plants are not sampling the well-mixed atmosphere due to their proximity to the soil surface and are thus influenced by microbial decomposition and plant respiration sources, which would not yet have incorporated bomb carbon at this time. But, in the region we sampled, the vegetation canopy tends to be very open, and the near-surface air space is extremely well ventilated. Finally, we also note that Flagstaff falls ∼600–650 km between multiple testing sites in Nevada (upwind) and New Mexico (downwind), where low-yield atmospheric weapons testing took place as early as 1945, but mainly in the 1950s and early 1960s (Enting Reference Enting1982), and we therefore cannot rule out these potential impacts on our localized record.
Our annual plant data also noticeably deviate from estimated tropospheric 14CO2 in the last decade. Elevated 14C values could be due to cleaner air (i.e., less local fossil fuel contributions) due to the remoteness, as well as high elevation (>2000 m) in much of the region we sampled. Elevated 14C values may also be the result of increased wildfires in the western U.S. (Zhuang et al. Reference Zhuang, Fu, Santer, Dickinson and Hall2021) and localized biomass burning due to recent forest management efforts, which re-introduce bomb 14C (Randerson et al. Reference Randerson, Enting, Schuur, Caldeira and Fung2002; Schuur et al. Reference Schuur, Trumbore, Mack and Harden2003; Heckman et al. Reference Heckman, Campbell, Powers, Law and Swanston2013) into the atmosphere during the summer growing season.
Accurate dating of recent terrestrial organic matter require that we take these regional to local scale deviations in the annual plant data into consideration. This is particularly crucial for dating faster cycling organic matter pools, like plant respired carbon and stored mobile plant carbon pools, where deviations of just 2–4‰ in the local background atmosphere can impact the attribution of current year carbon versus previous year’s carbon (Carbone et al. Reference Carbone, Czimczik and Keenan2013).
Potential of Annual Plants as Widespread Samplers of Tropospheric 14CO2
Annual plants have several characteristics that make them appealing to use as samplers of CO2. These include: no carryover of nonstructural carbon pools from previous years, atmospheric integration times of weeks to months, and widespread abundance in both space (many are weeds or crops) and in time (due to herbaria collections and short lifespans). Our data additionally show that the genus of plant was not associated with any detectable bias in the measured 14C, thus many species of annual plants may be available for this purpose. For terrestrial carbon cycling studies, annual plants record the 14CO2 that the ecosystem (plants and soil) experience, and thus may be more accurate for dating or attributing sources than “free” atmospheric records.
There are also disadvantages to annual plants as samplers of 14CO2 that lead to uncertainties that should be addressed. These include specimen curation and preparation that may introduce contamination to the 14C measurement. However, the primary disadvantage we encountered in this analysis was uncertain sampling integration time. Most annual plants have short lifespans of 1–3 months, but up to 6 months; herbarium records indicate the date of collection but provide no information about when the plant germinated. An individual leaf could integrate carbon from the atmosphere over just weeks. Determining this integration time for individual plant types and tissues would be important for higher time resolution records. This integration time may depend on how much plant tissue can be sampled for 14C, i.e., whether the whole plant is being sampled or just a few leaves. Alternatively, for certain applications, annual plants could be purposely grown from seeds (e.g., “iso-meters;” Körner et al. Reference Körner, Asshoff and Bignucolo2005; Carbone et al. Reference Carbone, Richardson, Chen, Davidson, Hughes, Savage and Hollinger2016), and the observed period of growth used to estimate the atmospheric integration time more accurately. More detailed understanding of how the 14C of the atmospheric is incorporated into different annual plant tissues of stems, leaves, flowers, seeds, and their nonstructural carbon, could better inform the use of herbaria data for new records. We also note that tree ring records may have much larger integration time uncertainty than annual plants, as tree nonstructural carbohydrate pools stored in bole tissue integrate years of photosynthetic activity (Carbone et al. Reference Carbone, Czimczik and Keenan2013; Richardson et al. Reference Richardson, Carbone and Keenan2013).
We believe the ease of sampling and positive characteristics discussed above largely outweigh this time integration uncertainty and provide exciting potential for the use of annuals plants as widespread samplers of the past and future 14CO2. Utilizing large numbers of herbarium collections that extend decades to centuries into the past (Lang et al. Reference Lang, Willems, Scheepens, Burbano and Bossdorf2019) could allow for expansion to higher time resolution and greater spatial representation of 14CO2 records, and mapping of local-to-regional deviations from the hemispherical averages. Since AMS samples sizes can be very small, the amount of tissue collected should not present a problem for most herbarium specimens. Also, many herbaria recognize the value of allowing specimens to be subsampled for chemical and genomic analyses, as long as specimens are properly annotated. Finally, because many herbarium collections can be queried remotely online the time and effort required to identify potential specimens is, remarkably, quite minimal. Future sampling campaigns of annual plants could also include annual plants as recorders of the fossil fuel imprint on specific locations for carbon accounting purposes. Finally, we note that in addition to calls for increased high resolution flask sampling (Levin et al. Reference Levin, Hammer, Kromer, Preunkert, Weller and Worthy2022) annual plants could potentially complement information used to constrain Earth System Models (Graven et al. Reference Graven, Allison and Etheridge2017) to understand global and regional scale exchange fluxes of the modern carbon cycle.
CONCLUSIONS
We used 100 annual plants that grew between 1910 and 2021 as a “proof of concept” to create a record of 14CO2 for the region near Flagstaff, Arizona, USA. This record is dominated by five commonly occurring annual plant species in the area, and most samples were previously archived herbarium specimens. We provide a localized synthetic record from which dating of recent terrestrial organic matter tissues and pools may be more accurate than synthetic global records. With increasing access to, and decreasing costs in AMS analyses, our results highlight the potential of planted and wild annual vegetation, as well as archived in herbarium collections, for increased time and spatial resolution of 14C records.
ACKNOWLEDGMENTS
We thank A.Z. Richardson for expert assistance with 2017–2021 annual plant identification and harvesting. NSF grant #1919506 provided AGE3 instrumentation to graphitize annual plants for AMS analyses. We gratefully acknowledge the financial support of the Office of the President and Vice President of Research at Northern Arizona University for support in acquiring the MICADAS. Any use of trade, product, or firm names in this paper is for descriptive purposes only and does not imply endorsement by the U.S. Government. We thank Q. Hua and two anonymous reviewers for their helpful feedback in revising this manuscript.
SUPPLEMENTARY MATERIAL
To view supplementary material for this article, please visit https://doi.org/10.1017/RDC.2023.5


 Open access