


1. INTRODUCTION
High-mountain glacier ice cores serve as invaluable environmental archives for the reconstruction of past climate and atmospheric composition. Due to their close proximity, ice core records retrieved from high-altitude glaciers and ice caps often allow to track environmental changes in the most densely populated and industrialized regions in the world. Environmental paleo records from ice cores are generally obtained through the chemical analysis of the entrapped atmospheric air, and the impurities which were transported as wet or dry deposition to the surface of a glacier and preserved in the ice over time. Among the ensemble of impurities used as reconstruction proxies, trace elements (TEs) play a substantial role. TE concentration records from high-altitude ice cores can provide a wide range of regional and global scale information such as for example on volcanism (Kaspari and others, Reference Kaspari2009b; Kellerhals and others, Reference Kellerhals2010; Gabrielli and others, Reference Gabrielli2014), sources and variations of atmospheric mineral dust (Kaspari and others, Reference Kaspari2009a), and in particular, historical changes of the various forms of atmospheric anthropogenic pollution (Correia and others, Reference Correia2003; Hong and others, Reference Hong2004; Schwikowski and others, Reference Schwikowski2004; Barbante and others, Reference Barbante2004; Gabrieli and others, Reference Gabrieli2011; Lee and others, Reference Lee2011; Eichler and others, Reference Eichler2014, Reference Eichler, Gramlich, Kellerhals, Tobler and Schwikowski2015, Reference Eichler2017; Uglietti and others, Reference Uglietti, Gabrielli, Cooke, Vallelonga and Thompson2015; Grigholm and others, Reference Grigholm2016; Eyrikh and others, Reference Eyrikh2017; Beaudon and others, Reference Beaudon, Gabrielli, Sierra-Hernández, Wegner and Thompson2017; Sierra-Hernández and others, Reference Sierra-Hernández, Gabrielli, Beaudon, Wegner and Thompson2018).
For reconstructing past climatic and environmental changes, the use of pristine ice cores, where the multiple proxy information has not been disturbed by post-depositional processes such as melting, infiltration, and refreezing, is advantageous to ensure a reliable reconstruction (Zhang and others, Reference Zhang, Kang, Gabrielli, Loewen and Schwikowski2015). For this reason, ice cores from high-altitude cold glaciers, which do not experience significant meltwater percolation between different annual layers, are the preferred objects of investigation. However, potential drilling sites are more and more difficult to find as many high-mountain glaciers worldwide are retreating or are in danger of melting (Zemp and others, Reference Zemp, Hoelzle and Haeberli2009; Huss and others, Reference Huss2017) due to the current global temperature increase (Marcott and others, Reference Marcott, Shakun, Clark and Mix2013). To continue using ice cores from high-altitude areas as environmental archives in the future, it is crucial to understand to what extent proxy information in ice core records is altered by post-depositional melting processes.
Several studies have been addressing this issue. In the case of the stable oxygen isotope ratio (δ18O) the annual signal can be smoothed due to meltwater percolation making any reconstruction of past temperature impossible (Thompson and others, Reference Thompson1993). The major ion record can also be dramatically disturbed as detected in a 16 m section of an ice core from upper Grenzgletscher, Swiss Alps (Note: the same ice core investigated here) (Eichler and others, Reference Eichler, Schwikowski and Gäggeler2001). Concentration records of some major ions in this core were well preserved, but others were depleted to values close to the detection limit due to relocation with percolating meltwater. An elution sequence was postulated to explain the preferential removal of certain ionic species. Pavlova and others (Reference Pavlova2015) showed that partial melting and refreezing, a process frequently occurring in temperate glaciers, can even result in relocation and release of persistent organic pollutants, substances with low water solubility. However, the influence of meltwater percolation on TE records still remains largely unclear as there has been no systematic investigation so far. Wong and others (Reference Wong, Hawley, Lutz and Osterberg2013) focused on 12 TEs associated with insoluble dust and observed that artificial meltwater infiltration in Greenland snow pits lowered TE concentrations, but in spite of that, the TE seasonality was still conserved. They concluded that especially particle bound rare-earth elements (REEs) are relatively immobile with meltwater percolation. In another study, profiles of both crustal and anthropogenic originating TEs of a snow pit from Mt. Ortles glacier, Italian Alps, did not seem to be notably altered even though significant melt events occurred during summer (Gabrieli and others, Reference Gabrieli2011).
Here, we discuss the behaviour of 35 TEs in a 50 m segment of an ice core from upper Grenzgletscher, Switzerland. At the centre of this segment, a 16 m section is located that was affected by meltwater percolation induced by a lateral meltwater inflow, presumably originating from a crevasse system. This core section consisted of firn at the time of infiltration (Eichler and others, Reference Eichler, Schwikowski and Gäggeler2001). This unique setting allows comparing the affected, and unaffected TE profiles above and below to characterize the impact of melting processes. Particular attention is given to providing an approach for explaining the observed TE patterns, and how the outcome of this study may contribute to the future interpretation of TE ice core records disturbed by meltwater percolation events.
2. MATERIALS AND METHODS
2.1. Ice core characteristics, detection of meltwater percolation and dating
The 50 m ice core segment investigated in this study was part of a 125 m long ice core recovered from upper Grenzgletscher, Monte Rosa massif, southern Swiss Alps (4200 m a.s.l.; 45°55′28″ N, 7°52′3″ E) in October 1994 (Eichler and others, Reference Eichler, Schwikowski and Gäggeler2000a, Reference Eichlerb, Reference Eichler, Schwikowski and Gäggeler2001; Müller-Tautges and others, Reference Müller-Tautges2016). Continuous negative borehole temperatures indicated that the upper Grenzgletscher consists of cold firn and ice down to a depth of 125 m. The borehole temperature profile also revealed an unusual local temperature maximum of −1 °C at a depth of 28 m (18 m w.e.) (Eichler, Schwikowski, Gäggeler, and others, 2000). This maximum was attributed to a lateral inflow of meltwater at 19–20 m (11–12 m w.e.) presumably due to a crevasse system in the glacier, subsequent percolation through the underlying firn layers, partial refreezing and drainage along the former firn/ice transition located at ~35 m (24 m w.e.) at the time of the drilling (Eichler and others, Reference Eichler, Schwikowski and Gäggeler2001). Refreezing of meltwater generally leads to an increased ice temperature due to the release of latent heat (Schwikowski and others, Reference Schwikowski, Schläppi, Santibañez, Rivera and Casassa2013).
The age-depth relationship of the ice core was established by combining annual layer counting of signals with strong seasonal variations (NH4+ and δ18O) together with reference horizons from Saharan dust falls (1947, 1977 and 1990), atmospheric nuclear weapons tests (1950s and 60s), and the 1986 Chernobyl reactor accident (Eichler and others, Reference Eichler2000b). The obtained timescale was supported by nuclear dating with 210Pb and fitting a simple kinematic ice flow model through the data. The 125 m long ice core covered the time period of 1937–94 with a dating uncertainty of <1 year for the period 1970–94 and ± 2 years for the period 1937–69.
The determined mean annual accumulation rate at the drilling site was 2.7 m w.e. Comparison of annual accumulation rates at the upper Grenzgletscher site and annual precipitation rates at the 50 km distant weather station, Col du Grand St Bernard (2469 m a.s.l., Eichler and others, Reference Eichler2000b; Mariani and others, Reference Mariani2014), indicates that the upper Grenzgletscher retains an all-year precipitation record. This is in contrast to the nearby Colle Gnifetti saddle (1 km away) with strong wind erosion especially during winter (Döscher and others, Reference Döscher, Gäggeler, Schotterer and Schwikowski1995).
2.2. Sample preparation and trace element analysis
The ice core sections were stored in polyethylene tubes at −20 °C until sample preparation. The segment between 2.2 and 52.2 m, corresponding to the time period 1980–93, was analyzed for this study. This includes the section affected by meltwater percolation between 19 and 35 m. This section consisted of firn when meltwater infiltration occurred (Eichler and others, Reference Eichler, Schwikowski and Gäggeler2001). The segments 13.3–14.7 m (within the year 1991) and 43.4–44.4 m (within the year 1982) could not be sampled as there was no ice remaining after previous analyses.
To remove possible contamination caused by the drilling procedure, previous sample preparation, or storage, the outer surface of the ice core sections was removed with a band saw, fitted with a Teflon-coated saw guide and tabletop, at −20 °C in the cold room at the Paul Scherrer Institute. In total, 550 samples with a cross-section of ~1.6 × 1.6 cm and lengths ranging from 4 to 15 cm (average of 8.3 cm) were cut resulting in an average sampling resolution of 41 samples per year. Ice samples from a core depth below 20.0 m were rinsed with ultrapure water (18 MΩcm quality, Milli-Q® Element system, Merck Millipore, Burlington MA, USA) under a class 100 laminar flow clean bench to remove the outer ~0.2 cm containing potential contamination from the stainless steel saw blade and/or the handling. Firn samples above this depth were decontaminated by scraping all faces (~0.3 cm) with a ceramic knife (Boker USA, Lakewood CO, USA) since rinsing was not possible due to high porosity (density <0.7 g cm–3). This decontamination procedure has been well established for discrete TE analysis (Eichler and others, Reference Eichler2012). All decontaminated samples were transferred into polypropylene tubes (Sarstedt, Nümbrecht, Germany), which were cleaned five times with ultrapure water and once with 0.2 M HNO3 prepared from ultrapure HNO3 (Optima™, Fisher Chemical, Loughborough, UK) beforehand.
The samples were acidified with concentrated ultrapure HNO3 to 0.2 M, melted at room temperature, and analyzed using discrete inductively coupled plasma sector field mass spectrometry (ICP-SF-MS, Element 2, Thermo Fisher Scientific, Bremen, Germany). Concentrations, either in low (LR) or medium resolution (MR), of 7Li (LR & MR), 23Na, 24Mg, 27Al, 44Ca, 45Sc, 51V, 55Mn, 56Fe, 59Co (all MR), 60Ni, 63Cu, 66Zn (all LR & MR), 85Rb, 88Sr, 90Zr, 95Mo, 109Ag, 111Cd, 121Sb, 133Cs, 138Ba, 139La, 140Ce, 141Pr, 146Nd, 147Sm, 153Eu, 172Yb, 182W, 205Tl, 206Pb, 207Pb, 208Pb, 209Bi, 232Th, and 238U (all LR) were determined. A microconcentric nebulizer (apex Q, Elemental Scientific, Omaha NE, USA) together with an autosampler (CETAC ASX-260, Teledyne Cetac, Omaha NE, USA) was used for sample introduction. 103Rh served as the internal standard to correct for intensity variations during sample introduction, and for plasma fluctuations. External calibration with seven different liquid calibration standards was used for quantification. Concentrations of each element in the calibration standards were adapted to account for their different concentrations in glacier ice. Correlation coefficients for linear regressions of the calibration curves were consistently higher than 0.999. This calibration procedure has been successfully employed in previous studies (Knüsel and others, Reference Knüsel, Piguet, Schwikowski and Gäggeler2003; Eichler and others, Reference Eichler2012, Reference Eichler2014, Reference Eichler, Gramlich, Kellerhals, Tobler and Schwikowski2015, Reference Eichler2017).
2.3. Data evaluation
Raw data were evaluated following the method described by Knüsel and others (Reference Knüsel, Piguet, Schwikowski and Gäggeler2003). Concentrations were blank-corrected by subtracting a procedural blank (Table 1). Procedural blank concentrations were determined by analysing ~8 cm long ice sticks of frozen ultrapure water. These sticks were prepared like the ice core samples and were either decontaminated with ultrapure water or a ceramic knife as described above. The instrumental detection limit was defined as 3 σ of the measurement blank consisting of 22 measurements of ultrapure water (Table 1). Concentrations below the detection limit were substituted with half the value of the detection limit. A reduced dataset consisting of equidistant data points was created out of the blank-corrected dataset for each TE by calculating average concentration values for each month within the time period 1980–93 covered by the investigated ice core segment, assuming homogeneous precipitation distribution throughout the year (or equal binning).
Table 1. Detection limits (DLs), procedural blank concentrations* of the discrete ICP-SF-MS analysis, concentration ratios between the mean concentration of the meltwater-affected section and the unaffected sections, mean concentrations within the unaffected part of the ice core segment (time periods 1980–84 and 1990–92)†, ionic radii in aqueous solution‡ and hydrated radii§ of the investigated TEs. Where more than one oxidation state is stated, the mean of the respective radii is listed.

* Errors given correspond to 1σ.
† Standard errors are given.
‡ Values from Marcus (Reference Marcus2015).
§ Values from Nightingale (Reference Nightingale1959) or David and others (Reference David, Vokhmin and Ionova2001).
‖ Procedural blank including decontamination by rinsing samples with ultrapure water.
# Procedural blank including decontamination by scraping all sample faces with a ceramic knife.
3. RESULTS AND DISCUSSION
3.1. Data presentation and characterisation
Ice core concentration records of selected TEs (Ag, Cd, Cs, Eu, Na, Pb, Tl) covering the period 1980–93 are shown in Figure 1. The entire ice core was previously analyzed for the main soluble inorganic cations and anions using ion chromatography (IC) (Eichler and others, Reference Eichler2000b, Reference Eichler, Schwikowski and Gäggeler2001). Thus, concentrations of Na, Mg and Ca have been determined by two independent analytical methods and can, therefore, be used to assess the reproducibility and representativeness of the data. Our measurements of Ca, Na and Mg concentrations agree well with the concentration records obtained by IC. For example, the Na+ and the Na concentration profiles (Fig. 1) reveal a strong correspondence between each other (R 2 = 0.81) despite different sampling and analytical methods, and the long-term storage between the two studies.
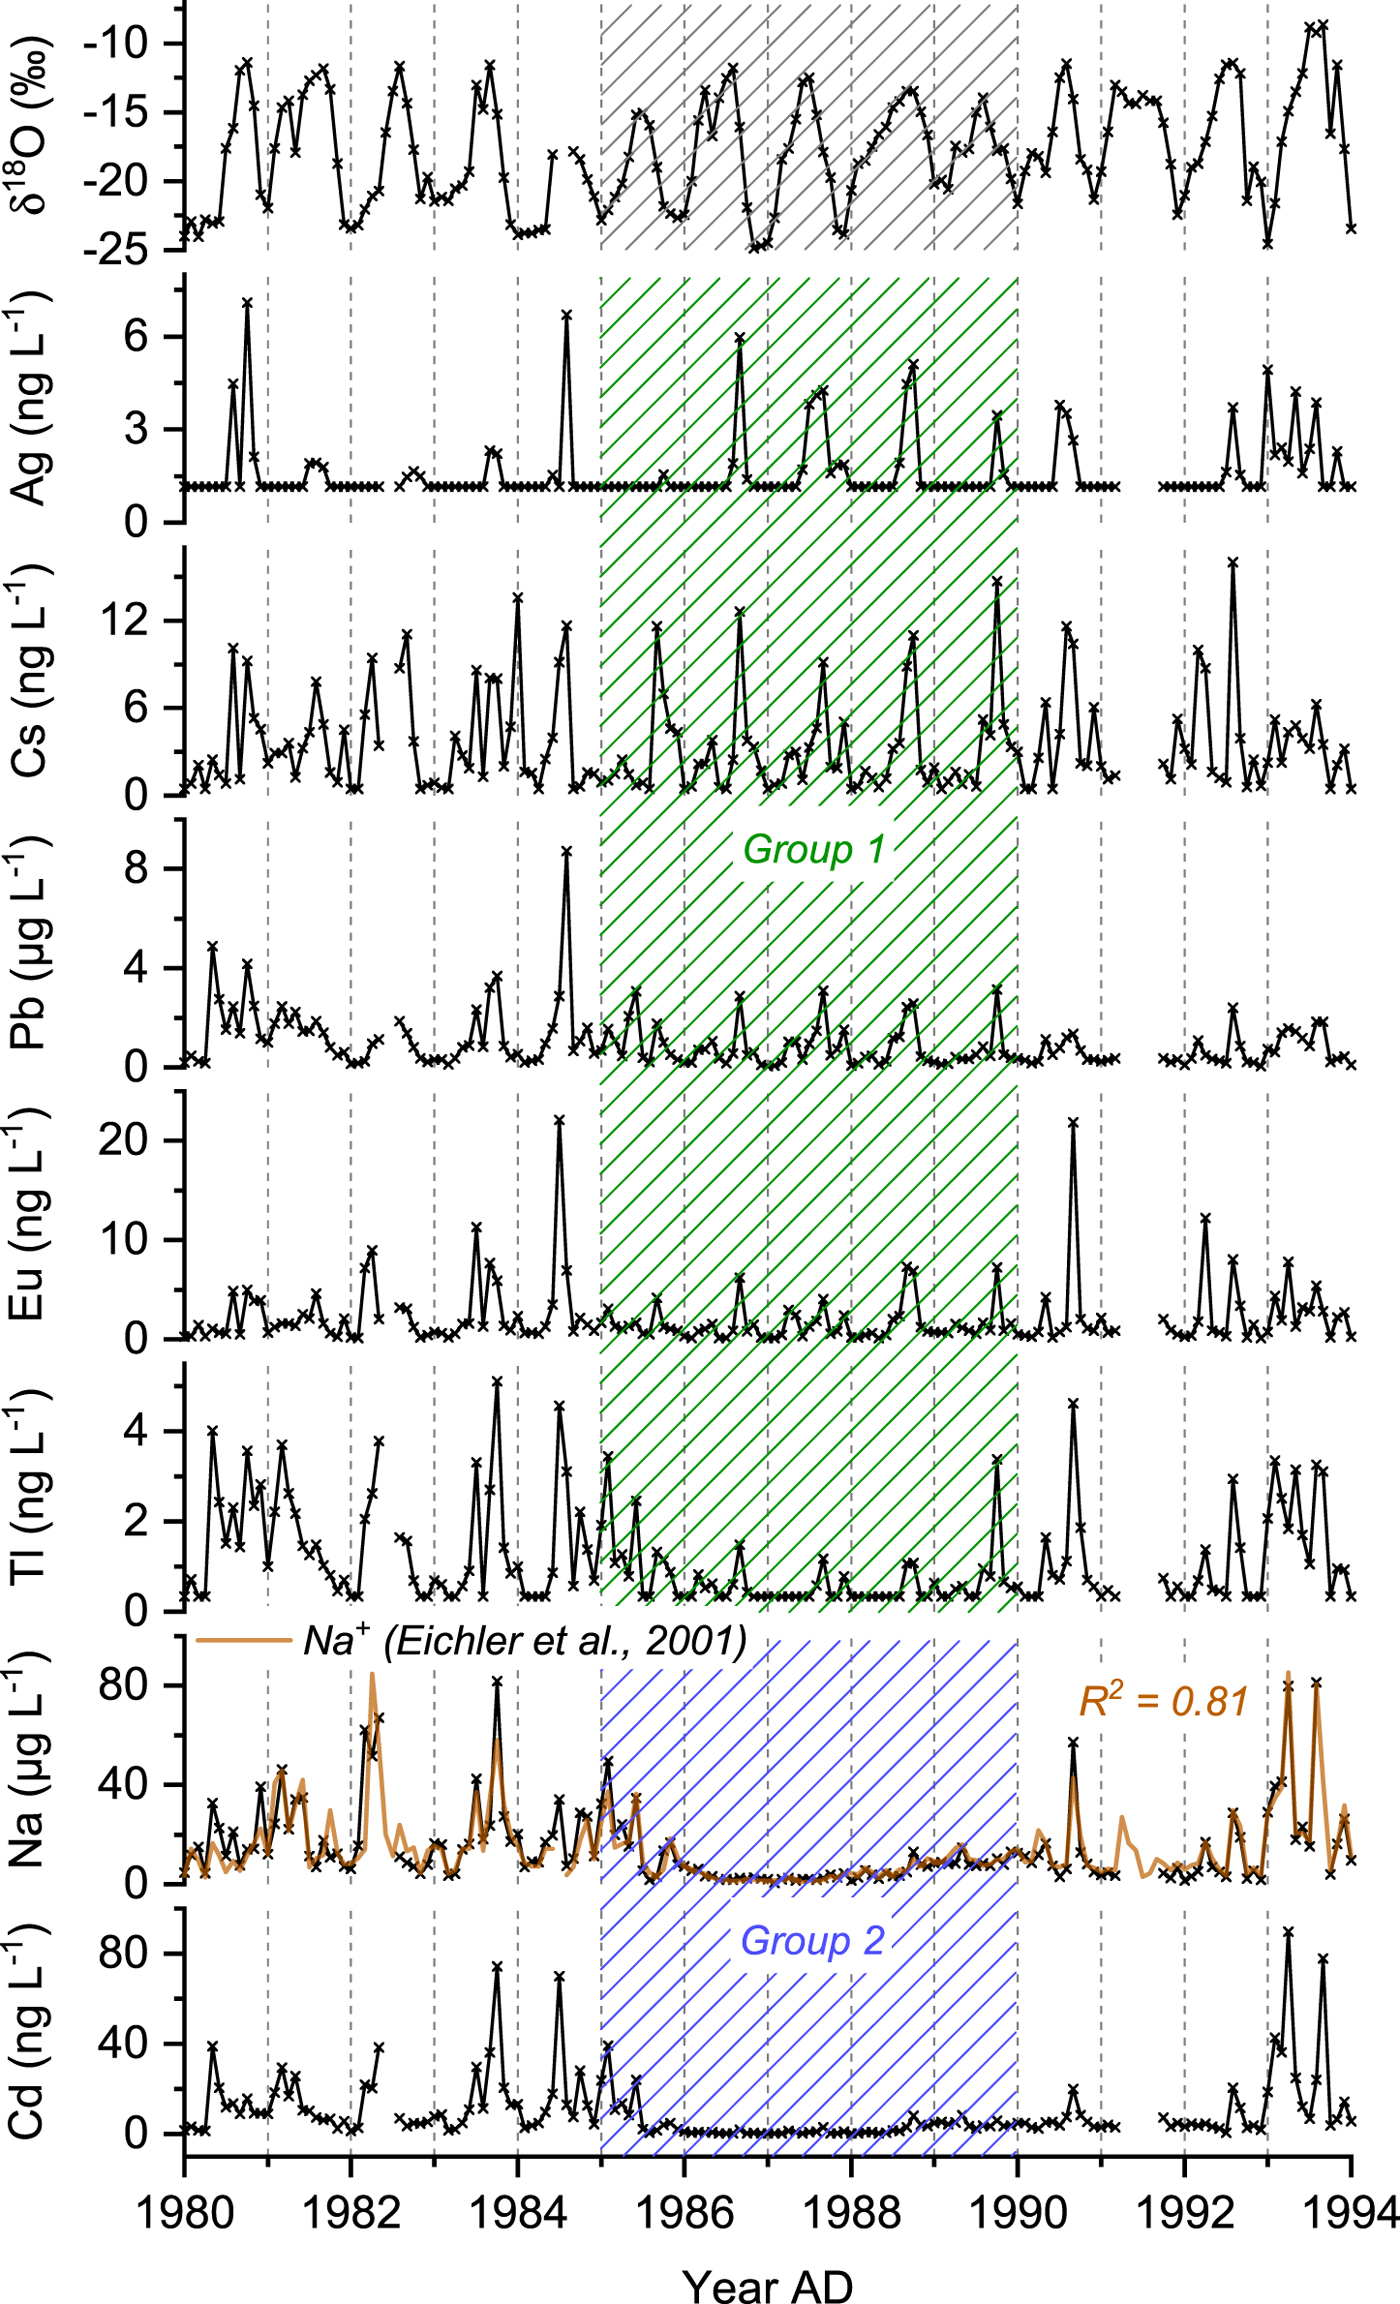
Fig. 1. Monthly mean concentration records of Ag, Cs, Pb, Eu, Tl, Na and Cd representing group 1 and 2 TEs and covering the period 1980-93 corresponding to the ice core segment from upper Grenzgletscher analyzed and discussed in this study. For comparison, the δ 18O and the Na+ records reported by Eichler and others (Reference Eichler, Schwikowski and Gäggeler2001) are shown. The shaded area (1985–89) indicates the section affected by meltwater percolation.
In general, concentration records of all 35 TEs reveal a very distinct seasonal pattern with high summer and low winter concentrations. This seasonality, typical for high-Alpine sites, is the result of stronger convection in summer allowing polluted air masses from the planetary boundary layer to reach the high-altitude sites of the Alps, while in winter, they are decoupled from the underlying air masses (Baltensperger and others, Reference Baltensperger1997). The pronounced seasonal variability is also visible in the record of water stable isotopes (δ18O), in line with temperature data from the nearby weather station Col du Grand St. Bernard (Eichler and others, Reference Eichler, Schwikowski and Gäggeler2001; Mariani and others, Reference Mariani2014, Fig. 1). Depending on the identifiability of the seasonal pattern within the meltwater-affected period 1985–89, the investigated 35 TEs were split into two groups. TEs of group 1, including Ag, Al, Bi, Ce, Cs, Cu, Eu, Fe, La, Li, Mo, Nd, Pb, Pr, Rb, Sb, Sc, Sm, Tl, Th, U, V, W, Yb and Zr, keep their seasonal concentration pattern. Group 2 TEs, comprising Ba, Ca, Cd, Co, Mg, Mn, Na, Ni, Sr and Zn, are significantly depleted and no seasonality can be identified. This is exemplarily shown in Figure 1 with Ag, Cs, Eu, Tl, Pb for group 1 TEs and Cd, Na representing group 2 TEs.
These observed anomalies within the time period 1985–89 coincide with the observations of ion fractionation made by Eichler and others (Reference Eichler, Schwikowski and Gäggeler2001). In their study, they postulated that meltwater percolated through the firn layers at the time of infiltration, primarily along the grain surfaces, removing impurities by drainage at the firn/ice transition. We suggest that the same process caused the disturbed and depleted concentration profiles of some TEs. Apparently, TEs were removed with different efficiencies; while some were almost completely depleted, others were not affected or only affected to a minor degree.
3.2. Quantification of concentration depletion in the meltwater-influenced section
To quantify and directly compare the different behaviour of the 35 TEs, a ratio between the mean concentration of the meltwater-affected section (1986–88) and the unaffected sections (1980–84 and 1990–92) was calculated for each TE (Table 1). The transition periods, corresponding to the years 1985 and 1989, and the year 1993 were not included in this analysis. The latter showed exceptional elevated summer values for many TEs compared with the previous years. The closer the concentration ratio for a certain TE is to one, the less affected the record in the meltwater-influenced section is. Correspondingly, the closer the ratio is to zero, the more affected the record is. In addition to the influence of meltwater percolation, the concentration ratio can be impacted by changes in atmospheric TE emissions or by changes in the transport of TEs from the emission sources to the high-Alpine sites. For example, the Pb concentration record reveals preserved seasonal variations, but also shows an overall slight decreasing trend (Fig. 1), which is due to declining anthropogenic Pb emissions since the 1970s (Schwikowski and others, Reference Schwikowski2004). Regarding possible changes in transport, the similar seasonal cycles of Cs concentrations during the period 1980–93 indicate a nearly constant dust input to this high-Alpine site. Thus, we assume that among those three factors that can have an influence on the concentration ratio, meltwater-induced relocation processes are dominant and outweigh possible changes in emissions or transport dynamics, especially, on such a short timescale as discussed here. All TEs had ratios between zero and one, except for Ag (1.22 ± 0.23) (Table 1). Concentrations of Ag are to a large extent below the detection limit (Fig. 1, Table 1) and the annual summer maxima within the meltwater-influenced section are more pronounced probably due to elevated emissions in the period 1985–89.
A rank of preservation was established by arranging all TEs in ascending order according to their concentration ratio. This qualitatively shows the relative degree of impact of meltwater percolation on the different TEs within the affected section. The rank of preservation plotted against the concentration ratio (Fig. 2) demonstrates the impact observed for the 35 TEs and their distinct fractionation after meltwater percolation. Ca shows the strongest depletion, whereas Ag is the least depleted. Group 1 TEs possess a ratio between 0.38 ± 0.07 (Tl) and 1.22 ± 0.23 (Ag) occupying ranks of preservation 1–25, while group 2 TEs have ratios between 0.08 ± 0.02 (Ca) and 0.26 ± 0.07 (Zn), corresponding to the ranks 26–35. The steady decline of the concentration ratios indicates a preferential elution of TEs after meltwater percolation.
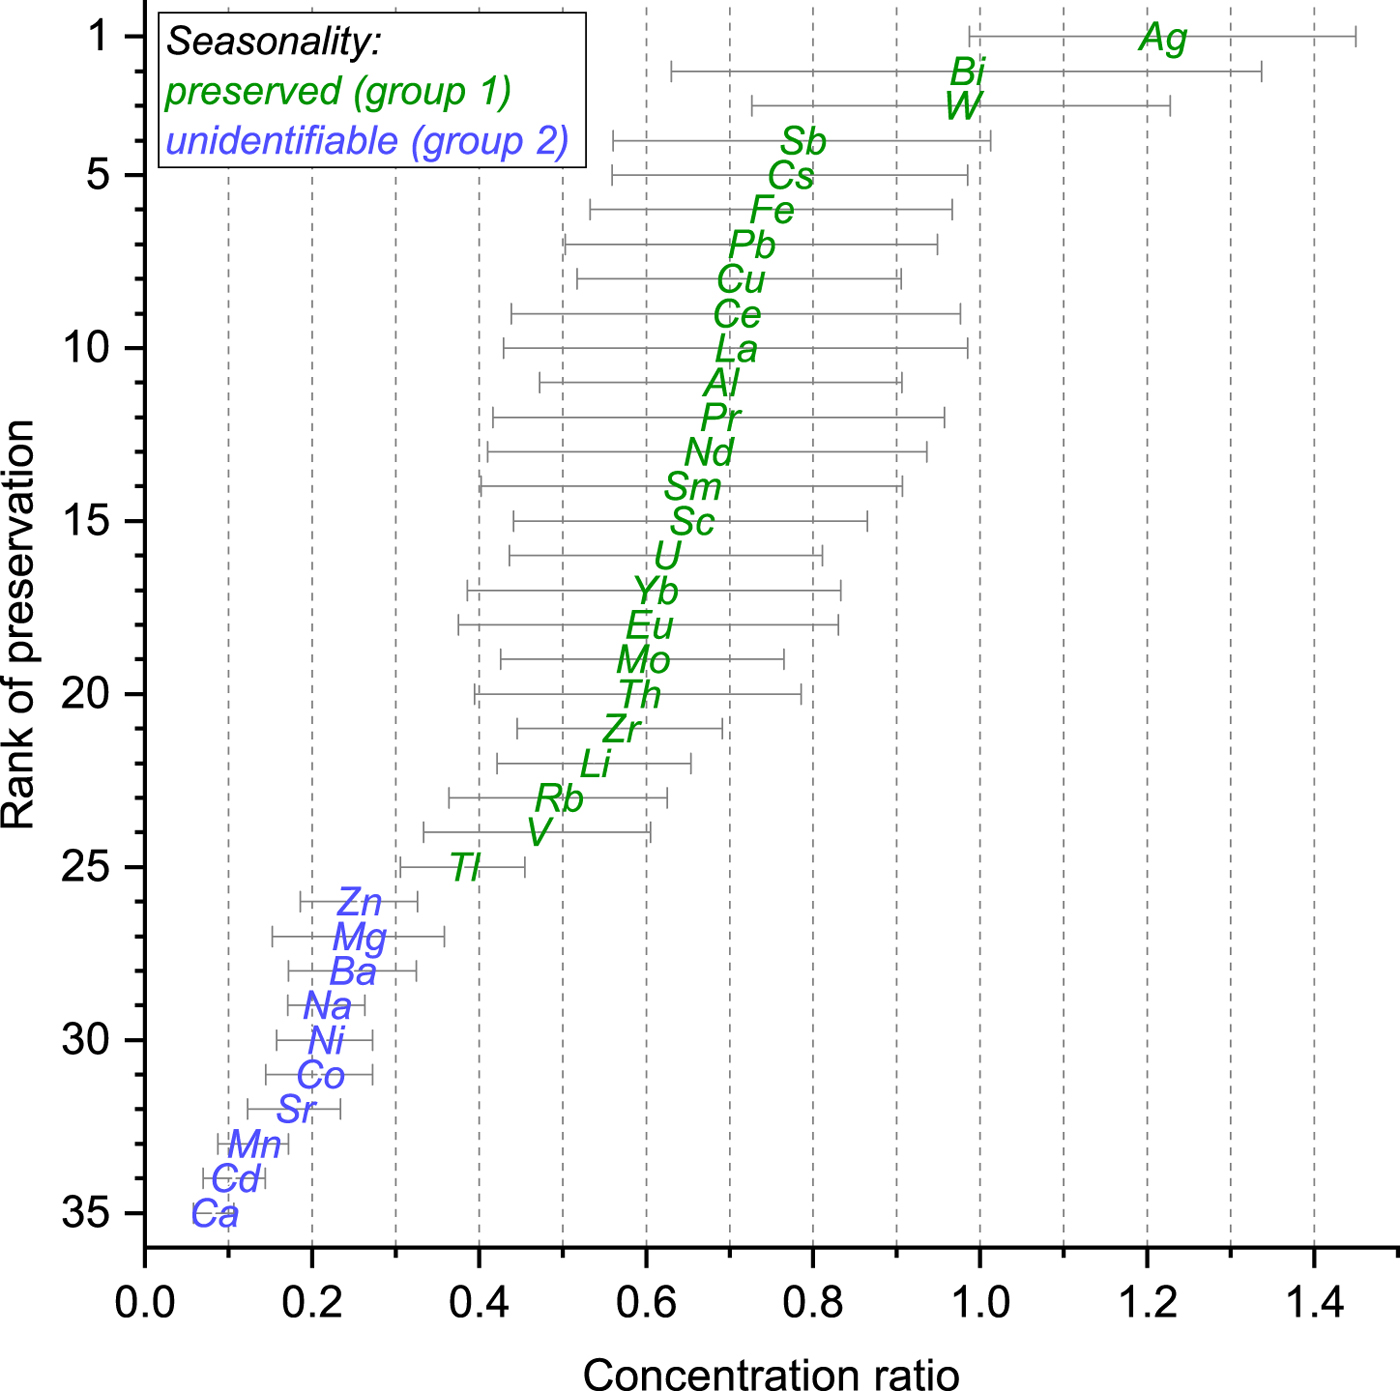
Fig. 2. Rank of preservation plotted against the concentration ratio for each TE. The concentration ratio is defined as the ratio between the mean concentration of the meltwater-affected section (1986–88) and the unaffected sections (1980–84 and 1990–92). Colour coding of the symbols indicates whether a TE kept its seasonal concentration pattern (group 1) or shows a significant depletion and no seasonality can be identified (group 2) within the section affected by meltwater percolation.
3.3. Causes for preferential elution of TEs
A fractionation of water-soluble major ions was already observed by Eichler and others (Reference Eichler, Schwikowski and Gäggeler2001) within the section of this ice core that consisted of firn when meltwater percolation occurred. K+, Na+, Mg2+, Ca2+ and SO42− were substantially depleted, whereas NH4+, F−, Cl− and NO3− showed a well-preserved seasonality. A separation of Na+ and Cl– of the initial deposited sea salt aerosol particle supported their conclusion that the different leaching efficiencies were not predominantly caused by precipitation formation or atmospheric scavenging processes. Rather, the different efficiencies were the result of post-depositional rearrangement processes during snow metamorphism causing a redistribution of chemical species according to their solubility in ice. The incorporation of NH4+, F−, Cl− and NO3− into the ice lattice led to their relative immobility with meltwater percolation. On the contrary, K+, Na+, Mg2+, Ca2+ and SO42−, which have lower solubility in ice, were excluded to grain boundaries where they were more prone to being removed. The assumption that meltwater only percolated along grain surfaces in the firn layers and did not affect the interior of the crystals is corroborated by the completely preserved δ18O record (Eichler and others, Reference Eichler, Schwikowski and Gäggeler2001, Fig. 1).
We assume that post-depositional snow metamorphism significantly affects the spatial distribution of TEs in snow, firn and ice. Snow metamorphism involves water vapor fluxes which can lead to a mass turnover of up to 60% of the entire ice mass per day inducing changes in the snow microstructure (Pinzer and others, Reference Pinzer, Schneebeli and Kaempfer2012). During snow metamorphism, initially deposited snowflakes are transformed by continuous sublimation/evaporation and subsequent condensation processes into firn grains, since larger grains grow at the expense of smaller ones (Davis, Reference Davis, Davies, Tranter and Jones1991). The rearrangement of TEs within the ice structure during grain growth depends on two properties: (1) the water solubility of the TE or its compounds (e.g. water-insoluble dust particles vs. soluble sea salt aerosols) and (2) their solubility in ice. These factors determine their incorporation in glacier ice and are discussed in the following section considering also the major sources of the investigated TEs.
3.4. Incorporation of TEs into glacier ice
Among the set of 35 TEs discussed in this study, the majority are of geogenic origin deposited with mineral dust: Al, Ba, Bi, Ca, Cs, Fe, Li, Mg, Mn, Na, Rb, Sr, Th, Tl, U, W, Zr and the REEs (Ce, Eu, La, Nd, Pr, Sc, Sm, Yb) (Gabrielli and others, Reference Gabrielli, Cozzi, Torcini, Cescon and Barbante2008; Gabrieli and others, Reference Gabrieli2011). About two-thirds of the mineral dust at the nearby Colle Gnifetti site originate from the Saharan desert (Wagenbach and Geis, Reference Wagenbach, Geis, Leinen and Sarnthein1989). In Alpine ice cores, Na does not only reflect contributions from mineral dust but also contributions from marine sea salt aerosols (Eichler and others, Reference Eichler, Schwikowski, Furger, Schotterer and Gäggeler2004). Anthropogenic atmospheric pollution is represented by elevated concentrations of Ag, Cd, Co, Cu, Mo, Ni, Pb, Sb, V and Zn at alpine sites (Van de Velde and others, Reference Van de Velde1999, Reference Van de Velde2000; Barbante and others, Reference Barbante2004; Schwikowski and others, Reference Schwikowski2004; Gabrielli and others, Reference Gabrielli, Cozzi, Torcini, Cescon and Barbante2008; Gabrieli and others, Reference Gabrieli2011). Nevertheless, those TEs can also be, to a minor extent, of mineral dust origin. In addition, Bi, Cd and Tl can be tracers for volcanism (Kaspari and others, Reference Kaspari2009a; Kellerhals and others, Reference Kellerhals2010; Gabrielli and others, Reference Gabrielli2014).
In the atmosphere, aerosol particles comprising TEs can be incorporated into the core of snow crystals by acting as ice nuclei as it is known for mineral dust aerosols (Szyrmer and Zawadzki, Reference Szyrmer and Zawadzki1997). Accumulation of supercooled water droplets onto ice crystal surfaces (riming) or direct impaction of aerosol particles on snow crystals usually results in the enrichment of impurities at the edges of the crystal (Mosimann and others, Reference Mosimann, Weingartner and Waldvogel1994; Pruppacher and Klett, Reference Pruppacher and Klett2010). As explained above, we suggest that these processes play a minor role in determining the final location of TEs in ice. The location is predominantly determined by the effect of snow metamorphism.
3.4.1. Water-insoluble TEs
Al, Fe, Zr and the REEs likely originated from water-insoluble mineral dust as particles containing these TEs typically reveal a water solubility of <10% (Greaves and others, Reference Greaves, Statham and Elderfield1994; Birmili and others, Reference Birmili, Allen, Bary and Harrison2006; Hsu and others, Reference Hsu2010; Li and others, Reference Li2015). Those particles are most likely enriched at grain boundaries during snow metamorphism, even if initially deposited as condensation nuclei in the snow grain interior. Such an enrichment of Fe and Al was shown for clear bands in Greenland ice (Della Lunga and others, Reference Della Lunga, Müller, Rasmussen and Svensson2014). Although enriched on grain surfaces, their insolubility in water results in immobility with meltwater, explaining the retention of their seasonality within the section affected by meltwater percolation (Fig. 2). This interpretation is in agreement with the work performed by Wong and others (Reference Wong, Hawley, Lutz and Osterberg2013), where artificial meltwater infiltration in Greenland snowpack showed that, in particular, REEs are relatively immobile during meltwater percolation, and tend to keep their seasonally varying signal.
3.4.2. Partially water-soluble TEs
Compounds exhibiting low water solubility like terrestrial Ba, Ca, or Mg sulphate and carbonate salts are present as ions below their solubility limit. Compounds featuring high water solubility like salts of alkali metals (Cs, Na, Li, Rb) predominantly occur as ions in snow and ice. These ions can be either incorporated into the ice lattice or segregated to grain boundaries during snow metamorphism.
Ions might be incorporated into the ice lattice following two different mechanisms. First, they can substitute water molecules located on lattice sites as suggested for NH4+, F–, Cl– and NO3– (Zaromb and Brill, Reference Zaromb and Brill1956; Eichler and others, Reference Eichler, Schwikowski and Gäggeler2001; Petrenko and Whitworth, Reference Petrenko and Whitworth2002). To be incorporated into the ice lattice site without significant additional strain, chemical impurities need to be of similar size and type as the oxygen atom of the water molecule to be substituted (Wolff, Reference Wolff1996). The more similar in size dopants are compared to that of a water molecule (diameter 2.75 Å), the more likely is substitution on lattice sites (Hobbs, Reference Hobbs1974). Second, impurities can also occupy interstitial sites as proposed for K+ regarding the incorporation of KOH in the ice lattice (Petrenko and Whitworth, Reference Petrenko and Whitworth2002). Hexagonal ice Ih possesses two kinds of interstices denoted as capped trigonal (Tc) and uncapped trigonal site (Tu). The Tu site (Fig. 3), which features a distance between its centre and the edges of 2.95 Å, has been shown to be a more stable host for interstitial species such as water molecules (Itoh and others, Reference Itoh, Kawamura, Hondoh and Mae1996).
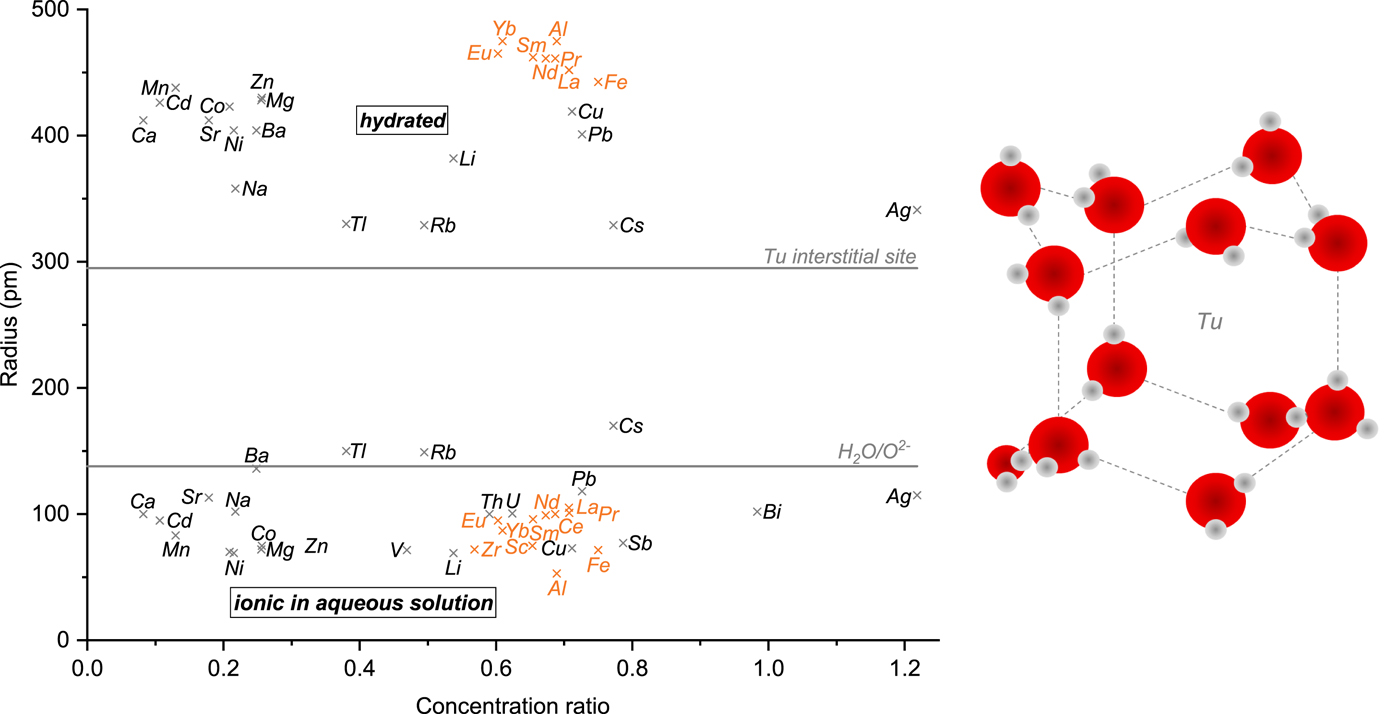
Fig. 3. Left: Hydrated and ionic radii in aqueous solution (Table 1) plotted against the concentration ratio of the corresponding TEs. Data points shown in orange represent TEs which are most likely not present as ions but rather as insoluble compounds. The radius of a water molecule and the distance between the centre and the edges of the uncapped trigonal (Tu) interstitial site in ice Ih, likely to host interstitials, are depicted as horizontal lines. Right: Sketch of the Tu site (adapted from Itoh and others, Reference Itoh, Kawamura, Hondoh and Mae1996). Oxygen and hydrogen atoms are shown as red and grey spheres, respectively.
Hereafter, we discuss factors possibly influencing whether TEs associated with (low) water-soluble compounds are incorporated into the ice lattice or segregated to grain boundaries. Our analysis reveals that the concentration and the atomic mass of TEs appear to have a major effect whereas TE size does not seem to play a role.
3.4.2.1. Influence of trace element size
For examining the influence of atomic size on the two possible ways of incorporation in ice (occupation of Tu interstitial space or a lattice site), we assumed that TEs originating from (low) water-soluble compounds are present as ions. Accordingly, we investigated the relationship between the concentration ratios of the TEs and the corresponding ionic radii in aqueous solution as well as the hydrated ionic radii (Table 1, Fig. 3). No significant correlation (R 2 < 0.05) was found either between the hydrated or the ionic radii in aqueous solution and the concentration ratio, even after removing Al, Fe, Zr and the REEs primarily not present as ions but insoluble particles (Fig. 3). There is also no evident dependency between the concentration ratio and the distribution of the ionic radii in aqueous solution around the radius of a water molecule; TEs having a similar ionic radius as the water molecule such as Ba, Rb, Tl do not have the highest concentration ratios. Except for Cs, Rb and Tl, all other TEs have smaller ionic radii than that of the water molecule suggesting that they could substitute water molecules on lattice sites. Concerning a possible occupation of the Tu interstitial site, it appears that the ionic radii are invariably smaller than the distance between the centre and the edges of the Tu interstitial site. This means that all TEs could be incorporated interstitially if present as ions. In contrast, hydrated ionic radii of all TEs are significantly larger than the radius of the Tu site implying that incorporation with a hydration shell is unlikely. Our results suggest that although almost all TEs could substitute a water molecule or be interstitially incorporated into the ice lattice if present as ions, the size of TEs is not the controlling factor affecting their preservation in the presence of meltwater.
3.4.2.2. Influence of trace element concentrations and atomic mass
One fundamental property of a TE in glacier ice is the average concentration it exhibits; this generally reflects the corresponding atmospheric concentration levels (Kaspari and others, Reference Kaspari2009b). Concentrations of TEs can be largely site-specific, such as mineral dust related TEs (Beaudon and others, Reference Beaudon, Gabrielli, Sierra-Hernández, Wegner and Thompson2017). Here, the mean concentrations of each TE within the two unaffected parts of the ice core segment (1980–84 and 1990–92, Table 1) were assumed to be representative of an ice core segment where no meltwater percolation took place. This assumption is justified because mean TE concentrations in ice cores from the nearby Colle Gnifetti saddle (Barbante and others, Reference Barbante2004; Schwikowski and others, Reference Schwikowski2004; Gabrieli, Reference Gabrieli2008), the Dôme de Goûter, Mont Blanc Massif (Barbante and others, Reference Barbante1999) and from a snow pit from Alto dell'Ortles glacier located in the Eastern European Alps (Gabrieli and others, Reference Gabrieli2011) are largely within the same orders of magnitude. Nevertheless, it should be noted that these reported mean concentrations do not cover exactly the same time period.
Figure 4 shows the mean concentration for each TE (logarithmic scale) plotted against the respective concentration ratio together with an exponential fit. A significant negative correlation (R 2 = 0.25) was observed indicating that TEs occurring in low concentration tend to have higher concentration ratios whereas TEs with higher concentrations are mostly associated with low concentration ratios. This trend becomes even more pronounced if the TEs associated with insoluble particles (Al, Fe, Zr, REEs) are excluded (R 2 = 0.41). Based on these results, we suggest that atmospheric concentration levels are a major driving force determining whether TEs originating from (low) soluble compounds are incorporated into the ice lattice or segregated to the grain surfaces. Abundant TEs such as Ca, Mg, Mn, Na, or Zn are likely to be segregated to the grain boundaries, since their concentrations exceed solubility limits in ice, and are thus prone to relocation by meltwater. TEs present in ultra-trace amounts including Ag, Bi, Cs, Sb, or W tend to be incorporated into the ice lattice as indicated by a strong preservation of these TEs in the meltwater-affected section.
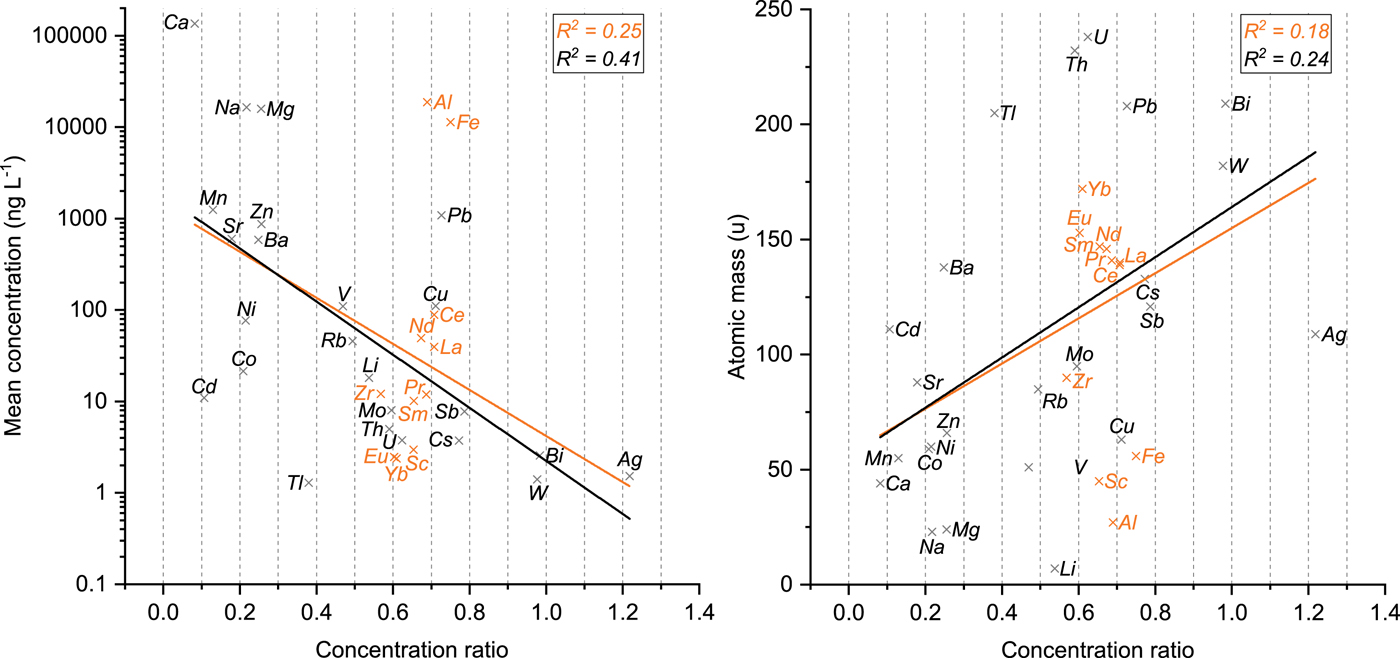
Fig. 4. Left: Mean concentration within the unaffected part of the ice core segment (logarithmic axis, time periods 1980–84 and 1990–92, Table 1) plotted against the concentration ratio of each TE. Right: Atomic mass of the measured isotopes (data from Rumble, Reference Rumble2017) plotted against the concentration ratio of each TE. The orange lines represent an exponential (left) and a linear fit (right), respectively including all 35 TEs (corresponding correlation coefficients in orange). The black lines represent the fit excluding Al, Fe, Zr and the REEs (corresponding correlation coefficients in black).
A significant correlation coefficient of R 2 = 0.18 was obtained for a linear fit between the atomic mass of the measured isotopes and the concentration ratio (Fig. 4). The fact that heavier TEs tend to be related to higher concentration ratios is presumably linked to the dependence between the average concentration in ice and the atomic mass. The average concentration in glacier ice serves as an indicator for the atmospheric concentration level, which is by itself connected to the overall abundance of a TE. Abundant TEs significantly contributing to the composition of the Earth's crust generally possess lower masses compared with the ones with higher masses that are rarer (Allègre and others, Reference Allègre, Manhès and Lewin2001). Like the mean concentration, the correlation becomes stronger (R 2 = 0.24) if TEs related to insoluble particles are excluded.
Our analysis showed that TEs originating from (low) water-soluble compounds present in ultra-trace amounts and characterized by large atomic masses tend to be preserved, while no influence regarding the size of TEs could be identified. TEs related to mineral dust particles are likely to be enriched at grain boundaries, but resistant to meltwater percolation due to water insolubility.
3.5. Implications
This study advances the understanding of TE preservation patterns in ice cores from glaciers partially affected by melting. This is necessary for evaluating the potential of TEs as environmental proxies, especially for future interpretation of paleo atmospheric TE ice core records from high-mountain glaciers. High-mountain glaciers are increasingly prone to melt processes even in the highest accumulation areas (Zhang and others, Reference Zhang, Kang, Gabrielli, Loewen and Schwikowski2015).
Among the set of TEs contained in mineral dust, Al, Bi, Cs, Fe, Li, Rb, Th, Tl, U, W, Zr and the REEs (Ce, Eu, La, Nd, Pr, Sc, Sm, Yb) stand out at the investigated high-Alpine site due to their resistance to mobilisation by meltwater percolation (Figs 1, 2). Ba, Ca, Mg, Mn, Na and Sr, however, showed concentration records heavily impacted by meltwater percolation (Figs 1, 2), and are therefore not recommended to be used as mineral dust proxies in cases where meltwater formation occurred.
Within the group of TEs representative of anthropogenic atmospheric pollution, Cd, Co, Ni and Zn were significantly depleted in the section affected by meltwater, thereby their seasonal variation could not be identified anymore (group 2, Figs 1, 2). These TEs are commonly emitted to the atmosphere due to human activities such as metallurgic processes or fuel combustion (Pacyna and Pacyna, Reference Pacyna and Pacyna2001). In contrast, Ag, Cu, Mo, Pb, Sb and V exhibited an exceptional robustness regarding post-depositional melting processes (group 1, Figs 1, 2). In this group, Pb has been extensively used as a proxy for metal smelting, mining activities, coal combustion and use of leaded gasoline in ice cores (Huo and others, Reference Huo, Yao and Li1999; McConnell and others, Reference McConnell, Lamorey and Hutterli2002; Schwikowski and others, Reference Schwikowski2004; Shotyk and others, Reference Shotyk2005; Li and others, Reference Li, Yao, Tian, Xu and Li2006; Osterberg and others, Reference Osterberg2008; Lee and others, Reference Lee2011; Eichler and others, Reference Eichler2012). Based on these observations, we suggest that Ag, Cu, Mo, Pb, Sb and V could still serve as tracers to reconstruct and estimate the impact of human emissions to the atmosphere (Galloway and others, Reference Galloway, Thornton, Norton, Volchok and McLean1982) from melt-affected ice core archives. However, Cd, Co, Ni and Zn records should be interpreted with caution due to probable meltwater mobility.
Regarding volcanism, in addition to the previously mentioned Pb and Sb, Bi and Tl tend to be reliable proxies in melt-affected ice core records. Also, volcanic ejection material is often enriched in Cd and Zn (Nho and others, Reference Nho, Le Cloarec, Ardouin and Tjetjep1996), but as discussed above, the use of Cd and Zn as tracers is not recommended.
Group 1 TEs, with their pronounced and less affected seasonal concentration variability, could also serve as markers for annual layer counting to establish the chronology of ice cores affected by post-depositional melt processes.
Our study demonstrates that many TEs are still valuable environmental proxies even if partial melting occurs at high-Alpine sites. One should note that our results are not rigorously transferable to ice core archives from other locations. Our findings show that the preservation of TEs during melting is determined by their concentrations and the dust mineralogy. Both parameters are site-specific. For instance, TE concentrations in ice cores from the remote Greenland and Antarctic ice sheets (Candelone and others, Reference Candelone, Hong, Pellone and Boutron1995; Vallelonga and others, Reference Vallelonga2003) can be up to three orders of magnitude lower compared with Alpine sites. According to our findings, the low concentrations at these sites could generally favour preservation of TEs during melting. In contrast, higher TE concentrations occur in ice cores from the Tibetan Plateau, especially for mineral dust related TEs (Beaudon and others, Reference Beaudon, Gabrielli, Sierra-Hernández, Wegner and Thompson2017; Sierra-Hernández and others, Reference Sierra-Hernández, Gabrielli, Beaudon, Wegner and Thompson2018). At these sites, concentration records of (low) water-soluble mineral dust related TEs assigned to group 1 in our study could be significantly disturbed by meltwater percolation. Contrariwise, higher mineral dust loading favours the presence of water-insoluble particles, less prone to meltwater relocation.
4. CONCLUSIONS
The analysis of 35 TEs in a 50 m ice core segment from upper Grenzgletscher is presented here. This segment of the ice core comprised a 16 m section that consisted of firn when an inflow and percolation of meltwater occurred. The special setting of sections unaffected by meltwater above and below this melt-affected section in the studied ice core segment provided good references for characterising the TE response to post-depositional melting processes at high-Alpine sites.
Some TEs revealed significant concentration depletion due to meltwater-induced relocation, whereas others were well preserved depending on their water solubility and location at the grain scale. TEs linked to insoluble particles, typically enriched at grain boundaries, were found to be mostly preserved, because their insolubility in water results in immobility with meltwater percolation. In the case of TEs present as (low) soluble compounds, variable mobility with meltwater was observed presumably due to a different microscopic location in the ice structure. We suggest that for those TEs, the concentration present is the major driving force determining their incorporation into the ice lattice or segregation to the grain surfaces. The size of the corresponding ions has a negligible effect. Further studies, preferably using direct in situ techniques, are needed to corroborate this indirect assessment of TE location in ice.
Based on their immobility with meltwater percolation, we propose that Ag, Al, Bi, Cu, Cs, Fe, Li, Mo, Pb, Rb, Sb, Th, Tl, U, V, W, Zr and the REEs (Ce, Eu, La, Nd, Pr, Sc, Sm, Yb) may still be applicable as robust environmental proxies in ice cores from Alpine glaciers partially affected by melting. In contrast, concentration records of Ba, Ca, Cd Co, Mg, Mn, Na, Ni, Sr and Zn are prone to significant depletion.
Site-specific variations in TE concentrations and mineralogy are likely to modify our established classification. Thus, TE response to post-depositional melting processes may vary between remote sites and heavily polluted regions.
ACKNOWLEDGEMENTS
Funding by the Swiss National Science Foundation (SNSF, Grant No. 155999) is gratefully acknowledged. We also thank Leonhard Tobler for introducing SEA to the ICP-MS analysis and Jacinta Edebeli for improving the English of the manuscript. We greatly appreciate the detailed comments and suggestions of the two anonymous referees. They helped to improve the clarity of the manuscript.


 Open access