


Introduction
Since its invention over 30 years ago, the atomic force microscope (AFM) has become firmly established as a high-performance tool for applications throughout biology, materials science, chemistry, and physics. The AFM’s core capability, namely nanoscale structural characterization by imaging topography (height), has only improved with time (Figure 1). In addition, a number of other modes have been developed over the years that interrogate functional behavior by sensing electrostatic, capacitive, magnetic, and related tip-sample interactions.
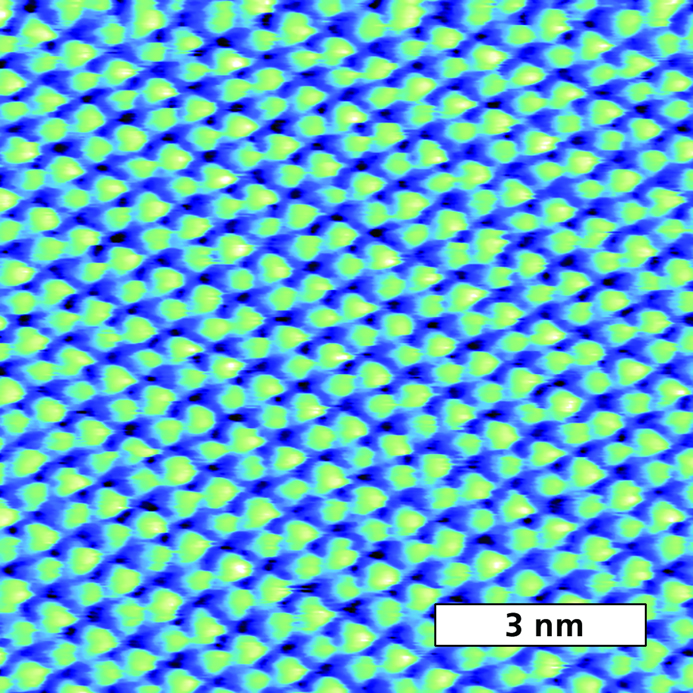
Figure 1 Topography image of crystalline β-DBDCS, an organic semiconductor, demonstrating lattice-scale resolution. Acquired in water with tapping mode on the Cypher S with blueDrive photothermal excitation. Sample courtesy S. Y. Park, Seoul National Univ., J. Gierschner, IMDEA Nanociencia, and E. Gnecco, Univ. Jena.
Many of these modes are dynamic methods, in which the cantilever is driven to oscillate at a specific frequency or frequencies. Probably the most familiar dynamic mode is tapping mode for imaging topography. However, other examples are Kelvin probe force microscopy (KPFM) for electrical characterization, magnetic force microscopy (MFM) for magnetic interrogation, and bimodal AFM for evaluating mechanical properties, where the cantilever is oscillated at two frequencies simultaneously.
Dynamic approaches are widely used because they offer distinct advantages in terms of performance, as discussed below. Therefore, improving AFM performance when operating in dynamic modes is an important aspect of instrument development. This is especially true for new applications with challenging requirements such as ever-higher spatial resolution, operation in non-ambient environments, and improved quantitative accuracy.
Here, we describe a recent instrumentation innovation for dynamic modes, blueDrive photothermal excitation. Implemented on the Cypher family of AFMs by Oxford Instruments Asylum Research, blueDrive provides improved performance for imaging in tapping mode and other dynamic modes. This article describes blueDrive, explaining its operating principles, comparing it to conventional approaches, and showing results that illustrate its value in a range of research areas.
Practical Considerations for Dynamic Modes
Tapping mode
For discussion purposes we focus on a specific dynamic mode: tapping mode, also called intermittent contact (AC) or amplitude-modulated (AM) mode. In tapping mode, the cantilever is driven at a constant frequency near or at its lowest flexural resonance (typically tens to hundreds of kilohertz for conventional cantilevers). An early AFM imaging innovation [Reference Zhong1], tapping mode is the most widely used AFM imaging mode today. Tapping mode quickly gained popularity because of greatly reduced sample and tip damage compared to contact mode imaging. Later, the resonance behavior of the cantilever was recognized as a rich source of information about the tip-sample interaction. In the simplest implementation, the phase response of cantilever oscillation can provide useful material contrast. More advanced analyses also have been developed to extract detailed nanomechanical and nanoelectrical properties from the cantilever response [Reference García and Pérez2].
Piezoelectric excitation
With few exceptions, tapping and other dynamic modes have been achieved on AFMs using piezoelectric excitation. A small piezoelectric actuator “chip” attached to the cantilever holder is driven with a sinusoidal voltage, causing the cantilever to mechanically oscillate at the desired frequency. Piezoelectric excitation is widely used because it is straightforward and inexpensive to implement.
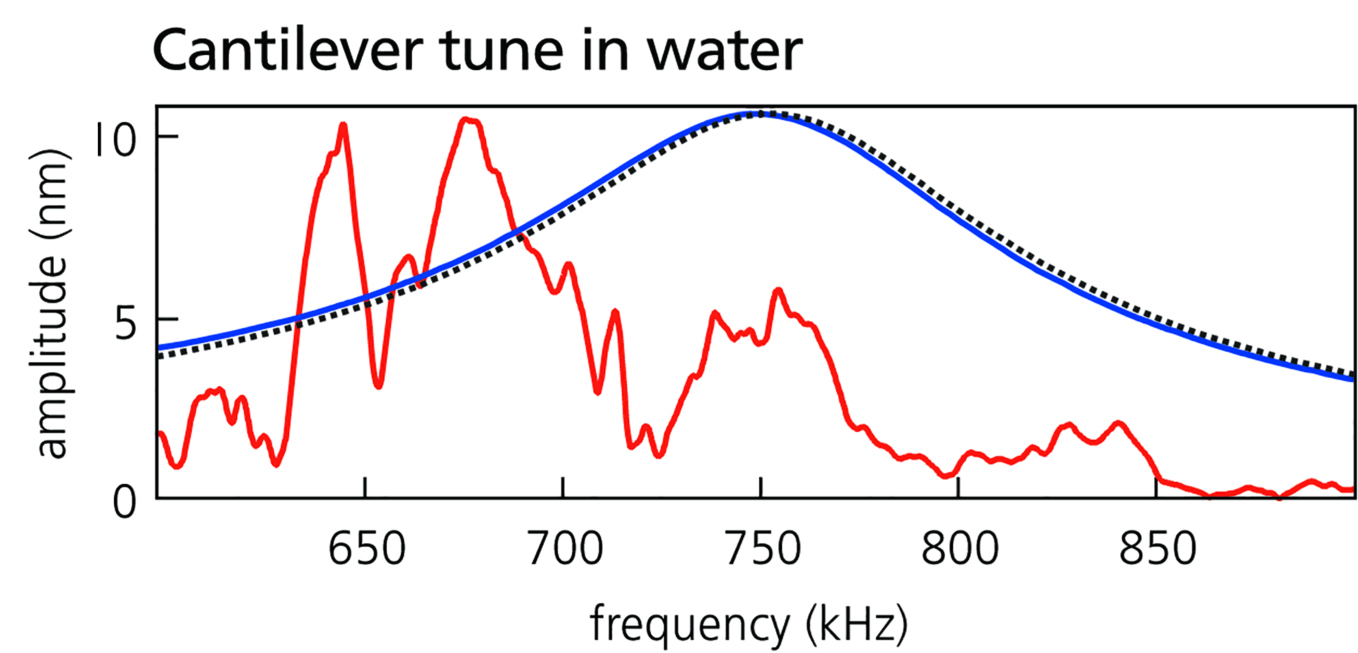
However, the response of a piezo-driven cantilever is far from ideal. Figure 2 shows amplitude versus frequency spectra (also known as tunes) for cantilevers in air and water. As seen in the red curves, the cantilever’s amplitude can vary strongly with frequency and contains irregular peaks and troughs. This “forest of peaks” occurs because piezoelectric excitation couples the AFM’s larger mechanical system directly to the cantilever [Reference Schäffer3]. Moreover, mechanical coupling usually varies during operation, so the cantilever response is not stable but fluctuates in time. Such behavior is usually adequate for operation in ambient conditions but nonetheless can make tapping-mode imaging frustrating and overly complicated. It also keeps other dynamic modes that need a clean, stable, and frequency-independent response from reaching their full potential.
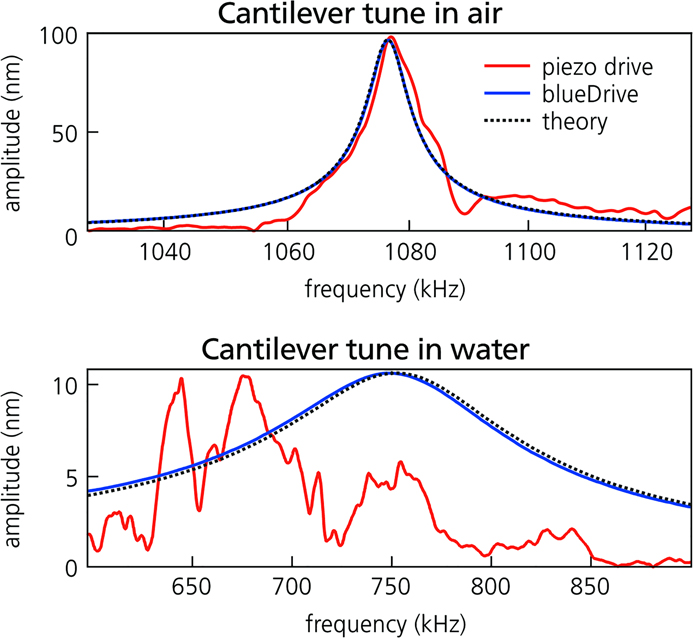
Figure 2 Spectra or “tunes” of cantilever response amplitude versus frequency for the same cantilever actuated by piezoelectric excitation (red curves) and blueDrive photothermal excitation (blue curves) in air (top) and in water (bottom). The black dashed lines represent the response predicted by simple harmonic oscillator theory. Results are shown for a small, gold-coated, arrow-shaped cantilever used for high-speed imaging. Acquired on the Cypher ES.
Photothermal excitation
An alternative drive mechanism is photothermal excitation, which offers a convenient solution to the obstacles presented by piezoelectric excitation. In this approach, a second laser, in addition to the primary one for optical beam detection, is focused on the cantilever near its base. The laser power is intensity-modulated in time, inducing local heating in the cantilever. This creates time-dependent stress gradients, which cause the cantilever to mechanically oscillate. In metal-coated cantilevers excitation is enhanced through the bimetallic effect, in which the difference in thermal expansion coefficient between the cantilever and the coating causes additional bending. The modulation frequency is adjusted to match the desired oscillation frequency, and the overall power is adjusted to obtain the desired oscillation amplitude.
Historically, photothermal excitation was only available to researchers willing to develop the necessary custom AFM instrumentation [Reference Umeda4,Reference Ratcliff5]. The introduction of blueDrive by Oxford Instruments Asylum Research, a photothermal excitation option for the Cypher family of commercial AFMs [Reference Labuda6], removes this constraint. As Figure 2 illustrates, blueDrive provides excellent performance in tapping mode. Because the photothermal mechanism directly excites the cantilever and does not couple to other system resonances, the forest of peaks is avoided in both air and water. In fact, the photothermally excited response (blue curves) closely matches theoretical predictions (dashed lines).
Stable Imaging in Liquid
For many systems of current and emerging interest, information on structure and properties must be acquired in liquid to be relevant (or sometimes even valid). As well as cells and biomolecules for biology and medicine, today’s applications include self-assembly of supramolecular networks for optoelectronics and electrochemical processes in ionic liquids for energy-storage technologies. Moreover, the highest possible spatial resolution—not just nanoscale, but even molecular or atomic scale—is usually needed for the greatest insight.
Piezoelectric excitation in liquid
However, progress in these areas is severely hindered by the difficulties of using piezoelectric excitation for tapping mode in liquid. As the spectra in Figure 2 show, the forest of peaks is typically much worse in liquid than air because the liquid volume adds extra resonances to the mechanical coupling. Also, because the cantilever resonance is much broader in liquid (Figure 2), piezoelectric excitation often induces multiple narrower peaks within the main resonance. These effects can make it difficult to identify a suitable peak for tapping-mode operation, and satisfactory imaging conditions are often found only by trial and error. Maintaining stable imaging can also require frequent adjustments (to setpoint, drive amplitude, etc.) as the response drifts in time due to changes in liquid temperature and volume.
Photothermal excitation in liquid
In contrast, photothermal excitation with blueDrive produces a clean cantilever response with a single resonance peak, even in liquid (Figure 3, top left). As a result, tapping-mode operation in liquid is straightforward. This not only makes experiments in fluid easier but also makes analysis less complicated. Furthermore, the cantilever response is much more stable with blueDrive (Figure 3, bottom left), eliminating the need for adjustments during imaging. Unattended imaging for many hours with blueDrive has been demonstrated [Reference Labuda6].
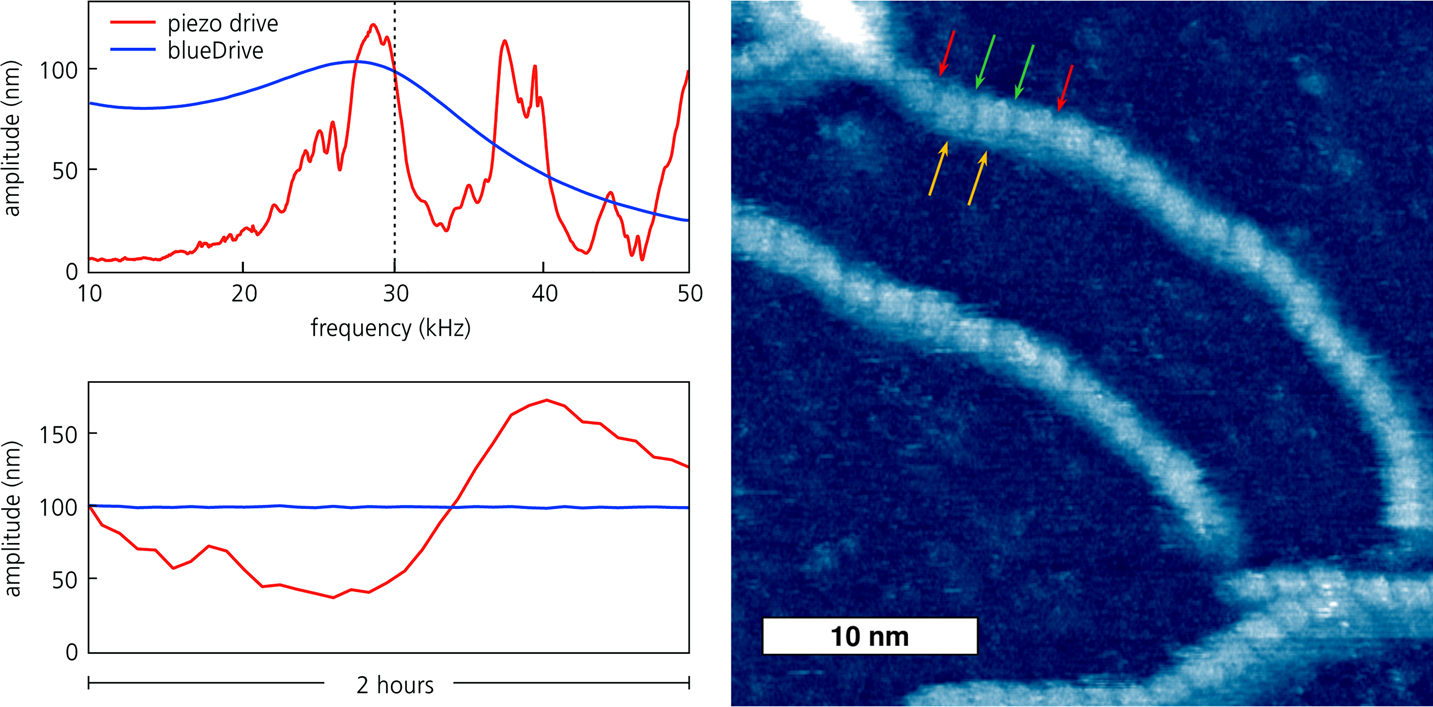
Figure 3 (top left) Comparison of cantilever response in water for piezoelectric excitation (red) and blueDrive photothermal excitation (blue). (bottom left) Amplitude stability for the same conditions. (right) Tapping-mode topography of DNA imaged in buffer with blueDrive on the Cypher ES. The red arrows show the spacing between three turns of the DNA helix; the green and gold arrows indicate the major and minor grooves, respectively.
Perhaps the most obvious applications that would benefit from photothermal excitation are biological samples. For over 20 years, researchers have used AFM to image proteins, nucleic acids, lipid and protein membranes, fibrils, and other molecular assemblies. For these systems, imaging under physiologically relevant conditions (in liquid and at elevated temperature) is not just beneficial but can literally make a life-or-death difference.
The advantages of blueDrive for imaging biological samples is dramatically illustrated in Figure 3 (right). This image clearly resolves not just individual DNA molecules but also fine structural details such as the helix pitch, and the major and minor grooves (nominal values 3.4 nm, 2.2 nm, and 1.2 nm, respectively). By making liquid imaging simpler and more stable, blueDrive allows researchers to focus on biological questions and not the data-taking process.
Improvements to fluid imaging also benefit AFM investigations of electrochemical processes. Electrochemical effects are relevant to many avenues of research including catalysis, batteries, corrosion, protein folding, and biofuel production. While macroscale electroanalytical methods are well established, few capabilities exist for studying nanoscale effects such as how the structure and properties of interfaces affect electrochemical reactions.
Combining blueDrive with an electrochemistry cell makes the AFM a valuable tool for real-time monitoring of electrochemically driven processes. Figure 4 shows an example of in situ monitoring of copper crystal growth. Crystals were first deposited from an acidic aqueous solution of copper sulfate and were then stripped away by changing the potential of a gold electrode. Unlike the shifting forest of peaks produced by piezoelectric excitation, the photothermal drive response remains constant with time irrespective of the fluid volume. This enables uninterrupted imaging for the entire length of experiments, even during continuous fluid perfusion.
Figure 4 Time sequence of topography images showing electrochemical growth (0 to 46.2 s) and stripping (52.8 to 99 s) of copper in acidic aqueous solution. Imaged in tapping mode on the Cypher ES with blueDrive photothermal excitation and the Electrochemistry Cell. Image width = 200 nm.
Capturing Nanoscale Dynamic Processes
Fast scanning
Figure 4 also demonstrates the AFM’s ability to directly observe dynamic processes. This capability has been extended in the last decade by development of “fast-scanning” AFMs such as the Cypher S and ES, which can scan 10–20 times faster than conventional models. As the results in Figure 4 show, these AFMs can produce a single image in seconds instead of minutes, enabling investigations of dynamic behavior in many biological, chemical, and physical phenomena.
Video-rate scanning
Studies of events that take place on shorter timescales are possible with high-speed or video-rate AFMs such as the Cypher VRS, which are capable of rates exceeding 10 frames per second. An example of high-speed imaging with the VRS is shown in Figure 5 for cetyl trimethylammonium bromide (CTAB). This compound is a surfactant that spontaneously self-assembles into rows of hemicylindrical structures, or hemimicelles, upon adsorption at the solid-liquid interface with highly oriented pyrolytic graphite (HOPG). Occurring over microseconds, the dynamics of this and other surfactant processes have important implications for dispersion stabilization, corrosion inhibition, and boundary lubrication. As Figure 5 demonstrates, high-speed AFM imaging can help elucidate the kinetics of adsorption, assembly, and motion of CTAB aggregates on HOPG.
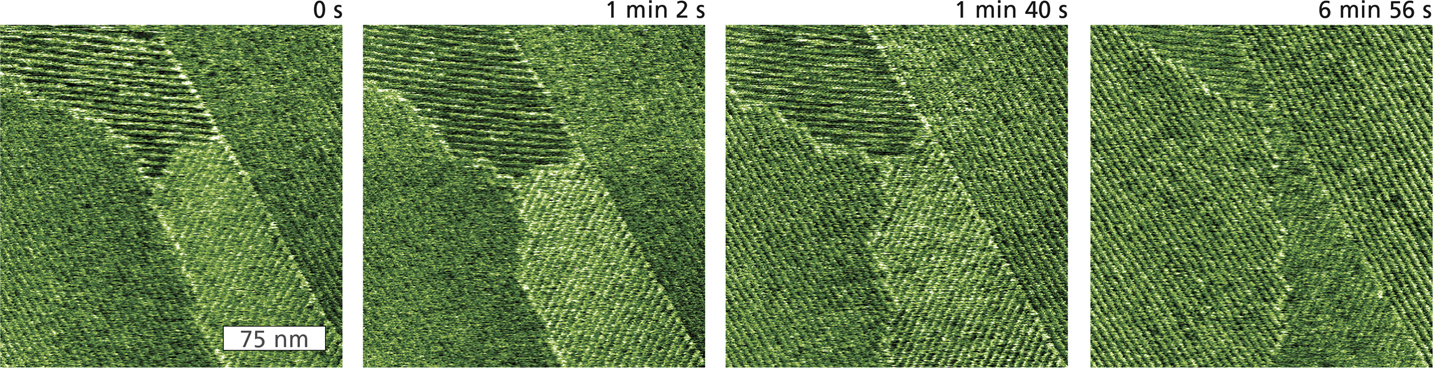
Figure 5 Tapping-mode phase images of CTAB hemimicelles self-assembled on HOPG during perfusion of a dilute solution of isopropyl alchohol. The images represent individual frames from a movie acquired at ~2 s per image (0.48 frames per second). Two CTAB grains with opposite row orientation are bounded on the left and right by two grains with parallel orientation. The grain boundaries significantly shift over time, but the micelles within each grain maintain their orientation. Acquired with blueDrive excitation on the Cypher VRS.
A key aspect of fast-scanning AFMs is their use of small cantilevers, roughly 10 times smaller than conventional cantilevers with resonance frequencies greater than 1 MHz in air [Reference Viani7]. These cantilevers not only enable faster imaging but also higher image resolution because of lower noise. Unfortunately, small cantilevers only exacerbate the problems of piezoelectric excitation. Tunes are more likely to show severe distortions and to be highly variable in time, making setup and stable operation more complicated.
In contrast, blueDrive photothermal excitation provides a clean, stable response at high frequencies, making fast imaging much easier and quicker. The response remains constant with time in liquid, even during perfusion. This feature is valuable for many systems, for example for events occurring at liquid-solid or liquid-liquid interfaces [Reference Costa8].
Improved Nanomechanical Mapping
Finally, we consider the implications of photothermal excitation for imaging nanoscale mechanical properties. Several techniques involving dynamic modes have been recently developed for mapping of both elastic and viscoelastic properties. Examples include contact resonance AFM [Reference Li9] and bimodal AFM methods such as AM-FM mode [Reference Kocun10]. These modes harness the exquisite sensitivity of the cantilever oscillation to both conservative and dissipative tip-sample interactions.
Although usually sufficient for basic imaging in air, piezoelectric excitation is more problematic for nanomechanical mapping. Even in air, the cantilever response with piezoelectric excitation contains both on- and off-resonance distortions. An insufficiently flat drive response makes it difficult to evaluate whether changes in the cantilever response are due to sample properties or drive artifacts. This can cause errors in the results from model-based quantitative analysis and create tracking instabilities. Using photothermal excitation, however, the cantilever response possesses a nearly perfect resonance peak and is otherwise flat in frequency. As a result, measurements agree more closely with theoretical predictions, leading to less uncertainty in modulus calculations and hence improved accuracy.
Figure 6 shows an example of nanomechanical mapping with blueDrive for a multilayer polymer structure in cross section. Relatively small modulus differences between polyethylene terephthalate (PET, green), polyethylene (PE, blue), and ethylene vinyl alcohol (EVOH, yellow) are clearly resolved. A thin layer of adhesive between the PET and PE layers is also visible. The histogram provides quantitative information for further analysis.
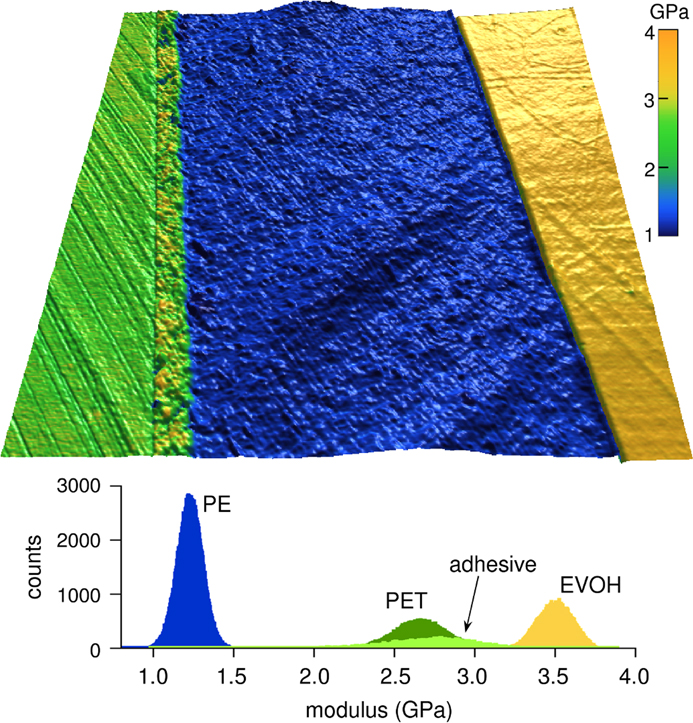
Figure 6 Nanomechanical map of a multilayer polymer composite viewed in cross section. Elastic modulus measurements are shown overlaid on a topography image for polyethylene terephthalate (PET, green), polyethylene (PE, blue), and ethylene vinyl alcohol (EVOH, yellow). Image width = 9 µm. Below is a color-coded modulus histogram for a PET/adhesive/PE/EVOH polymer sandwich. Acquired in AM-FM Viscoelastic Mapping mode on the Cypher S with blueDrive.
Conclusion
Tapping mode and other dynamic AFM modes are widely used because of their fast imaging with less damage and their ability to measure mechanical, electrical, and other functional properties as well as topography. Cantilever oscillation in dynamic modes has conventionally been performed by piezoelectric excitation, but this was far from ideal. Photothermal excitation with blueDrive sets a new standard for imaging in both air and liquids. By directly driving the cantilever, blueDrive produces a nearly perfect response that offers significant benefits in terms of speed, resolution, setup and stability, and accuracy.


