


Introduction
The Vostok station region (78.465° S, 106.8348E) of central East Antarctica is unique in many respects, being one of the coldest and driest spots on Earth. A project to carry out deep ice drilling here was launched in 1970. It resulted in the reconstruction of past climate stretching back over 400 000 years (Reference PetitPetit and others, 1999) and in the first penetration of Vostok Subglacial Lake in February 2012.
It is crucial to understand how present-day weather and climate changes act to form the stable water isotope content (δD, δ18O and δ17O) of snow precipitation, and then of snow deposits, in order to interpret deep ice-core isotopic data, and our knowledge of these issues is still insufficient. One of the first attempts to study in detail the vertical variability of the isotope composition of modern snow at Vostok was made by Reference Dansgaard, Barkov and SplettstoesserDansgaard and others (1977), but until the late 1990s this kind of work was only carried out on a sporadic basis. In 1997, Russian scientists at Vostok station began to systematically monitor spatial and temporal variability of the snow isotope content and the accumulation rate, which for the first time allowed reconstruction of present-day climate variations on a timescale from decades (Reference Ekaykin, Lipenkov, Barkov, Petit and Masson-DelmotteEkaykin and others, 2002) to centuries (Reference Ekaykin, Lipenkov, Kuz’mina, Petit, Masson-Delmotte and JohnsenEkaykin and others, 2004; Reference Kozachek, Ekaykin, Lipenkov, Shibaev and VaikmaeKozachek and others, 2011). One important output of these studies was an understanding of the prevailing contribution of non-climatic (i.e. related to various-scaled snow relief forms) vs climatic factors in the formation of the natural variability of snow isotope content and accumulation rate, which is supposed to be typical for low-accumulation sites.
Later these studies were extended to the broader area bounded by Progress, Vostok and Mirny stations, with the focus on the Vostok Subglacial Lake region (see the review in Reference Ekaykin, Shibaev, Lipenkov, Salamatin, Popov and KotlyakovEkaykin and others, 2011). Recently, detailed investigations of the concentration of specific chemical compounds (10Be and tritium), as well as of a rare species of the water molecule (H2 17O) in Vostok snow have allowed new information to be obtained on the origin of the central Antarctic moisture (Reference Baroni, Bard, Petit, Magand and BourlѐsBaroni and others, 2011; Reference WinklerWinkler and others, 2013). In this paper we, for the first time, present a robust regional stack record over the past 350 years and investigate the mechanism of central Antarctic climatic variability through analysis of its correlation with the climatic indices of the Southern Hemisphere (SH).
Methods
We use isotopic data from 15 snow pits and cores excavated and drilled in the period 1997–2011 near (within 5 km of) Vostok station (Fig. 1; Table 1). The only exception is the VFL-1 borehole, drilled 107 km upstream of the station along the Vostok ice flowline. Reference Ekaykin, Shibaev, Lipenkov, Salamatin, Popov and KotlyakovEkaykin and others (2011) showed that climate variability at VFL-1 over the past 200 years is very similar to that at Vostok, while Reference Ekaykin, Lipenkov and ShibaevEkaykin and others (2012) demonstrated that VFL-1 and Vostok belong to the same climatic province, which justifies combining the two sites into one stack record. Data from ten of these points have been previously published (Table 1), and data from the other five are presented for the first time. Details of the pit and core dating and the stable isotope content measurements are available from the sources listed in the table.
Table 1. Inventory of the data used to construct the Vostok stack record (VRS13)

Fig. 1. The study area. Left: the southern part of Vostok Subglacial Lake with the location of the Vostok ice flowline (VFL) and sites Vostok, vk57 and VFL-1. Right: the vicinity of Vostok station, with the location of the snow pits and cores used in this paper. Also shown are the snow stake network, profiles VFL and SW, as well as vk58 pit excavated in summer 2012/13 and not used in this work.
Snow thickness in the newly presented pits vk55, vk55-2, vk56 and vk57 was dated using the snow stratigraphy data assuming that every observed stratigraphic layer corresponds to an annual layer (Reference Ekaykin, Lipenkov, Barkov, Petit and Masson-DelmotteEkaykin and others, 2002). Initial dating was then corrected using absolute age markers, for which we used the depths of either the Pinatubo (Philippines) 1991 or Agung (Indonesia) 1963 volcanic layers. The latter was provided by the Limnological Institute of the Siberian Branch of the Russian Academy of Sciences, Irkutsk, and partly published in Reference OsipovOsipov and others (2013). Note that the volcanic products were deposited in central Antarctica about 1 year after eruption. In all cases, the preliminary dating underestimates the age of snow layers by 15–20% due to the annual-layer hiatus related to random snow removal by wind.
For the VKT55 snow core we do not have stratigraphic data, so the age of the snow layers was obtained by interpolation between the absolute age markers of the Tambora (Indonesia) 1815 and Agung layers. Below the Tambora layer the core was dated by extrapolating the depth-age function taking into account the firn densification. The isotopic content (deuterium and oxygen 18) of the new pits and cores was measured at the Climate and Environment Research Laboratory, St Petersburg, using a Picarro L1102-i analyzer. As the work standard (measured after every five samples) we used VOS, a handmade standard prepared for the present-day Vostok snow and calibrated against the International Atomic Energy Agency (IAEA) standards (VSMOW-2, GISP and SLAP-2).
By repeated analyses of randomly chosen samples we estimated the reproducibility of the measurements is not worse than 0.06 per mil for d18O and 0.6 per mil for δ, which is sufficient for the purposes of this study. In this paper, only the deuterium content data are used because they are available for all the pits and cores.
Figure 2 demonstrates the regional (southern part of Vostok Subglacial Lake) stack δD record for the last 350 years (hereinafter referred to as VRS13). The shaded area depicts the uncertainty of the δD values (±1 σx), calculated as
where σ x ( i ) is the standard deviation of the snow isotope content of the ith year measured in n pits. The number of pits (n) used to define the average isotope content for a given year is shown in the lower part of Figure 2.
Fig. 2. Regional (southern part of Vostok Subglacial Lake) stack series of snow isotope content. The dashed line shows the unreliable (based on data from only one snow core) section. Shaded area depicts one standard deviation. The lower part of the figure shows the number of individual records of which the stack is composed.
For the period 1654-1721 we have data from only one snow core (VK07). We thus consider this part of the stack record unreliable, and for further analysis use only data after 1729. The standard deviation of δD values measured at different points for a given year is ±9.7%. This value is defined by the spatial variability of snow isotope content in this region of Antarctica, as well as by errors in the dating of snow thickness in different pits or cores. In fact, the spatial variability of isotope content values in Vostok snow can be even higher. For example, the standard deviation of δD values of the upper 10 cm of snow, as measured near each of the 79 stakes in the snow stake area, is ±18% (Reference Ekaykin, Lipenkov, Barkov, Petit and Masson-DelmotteEkaykin and others, 2002). A reduced value obtained from our pit and core data could be related to the smoothing of the isotope profiles with time due to the diffusion of water molecules (Johnsen and others, 2000). In the stack record (for the period 1729-2010), the average error of the annual values is ±4.4%.
The isotope content of snow precipitation, and thus of the snow deposits, is, as a rough approximation, governed by the local air temperature, which forms the basis of the ‘isotopic paleothermometer’ method. The air temperature variations are supposed to be similar at all the studied points, so all the isotopic records must contain the common part of variability that we call ‘climatic signal’. On the other hand, spatial variability of the isotope content produces random fluctuations in the isotopic series that, as can be easily shown, are not correlated at different points. This random part of the variability is often referred to as ‘stratigraphic’ or ‘deposition noise’ (Reference Fisher, Reeh and ClausenFisher and others, 1985). The construction of the stack record (i.e. averaging the isotope values over different points for a given year) reduces the variability of the noise, keeping the signal unchanged.
Thus, the available data allow us to estimate the signal-to-noise ratio (SNR) for an isotope record obtained from an individual snow pit or core. For this, let us assume that the variance of the individual isotope series is defined by both signal and noise, while the stack series is the pure signal. With an average variance of individual series equal to 221%2 , and variance of the stack series (1729–2010 period) being 39%2 , the SNR is estimated to be 39/(221 – 39) =0.22 (a maximum estimate since the stack record still contains a considerable level of noise). This means that only about one-fifth (or less) of the variability observed in a single isotope time series obtained at Vostok contains climatic information, while the rest is related to the local ‘stratigraphic noise’. A very similar value of the SNR (0.17) was previously estimated by Reference Ekaykin, Lipenkov, Barkov, Petit and Masson-DelmotteEkaykin and others (2002). This implies that, at the low-accumulation sites, only the stack records, constructed by averaging several individual records, can serve as a robust proxy of the local climate and be used for comparison with the climate of other regions of Antarctica and the SH.
Figure 3 shows the graph of spectral density of VRS13 series calculated using STATISTICA 6.0 software. The spectrum is characterized by the absence of high-frequency variability, which is typical of isotope records from low-accumulation areas, where short-term variability is erased by water molecular diffusion (Reference Fisher, Reeh and ClausenFisher and others, 1985). The first peak is observed at 3.3 years and the other periods are 6.6, 9.7, 16, 28 and 47 years. The same cycles were obtained using AnalySeries software.

Fig. 3. Spectral density of VRS13 series. The spectral analysis is performed using STATISTICA 6.0 software. The horizontal axis shows the frequency, which is the reciprocal of the period.
Discussion
Vostok snow isotope content vs local air temperature
Figure 4 shows VRS13 together with the local instrumentally measured near-surface air temperature data for the period 1958–2010. All the series are 3year running means unless stated otherwise. For the mean annual temperature we did not find a significant correlation with snow isotope content. This may be partly due to errors in isotope series dating, but such errors could only be responsible for the discrepancy in short-period variability, whereas the major differences are observed in long-term variations:
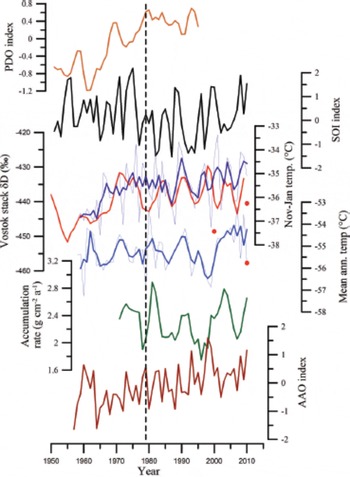
Fig. 4. The climatic data for the period 1950–2010. Reading downwards: PDO index; SOI index; Vostok stack δD (VRS13: red) and Vostok warm period temperature (blue); Vostok mean annual temperature; Vostok snow accumulation rate; and AAO index. All the series are 3 year running means except for AAO, SOI and those shown by thin lines (unsmoothed data). The red dots are the mean annual values of the δD content of the snow precipitation in 2000, 2010 and 2011.
-
1. isotope series demonstrate a strong warming in the 1960s, which is not the case for temperature;
-
2. the 2000s is the warmest decade in the temperature record, which is not reflected in the isotopes.
Surprisingly, VRS13 is much more consistent with the temperature of the warm period of the year (November–January; Fig. 4), with a correlation coefficient of 0.57 (Table 2) (hereinafter only statistically significant (with a level of 0.05) correlation coefficients are shown). The longterm variability of both series is similar, but the VRS13 spectrum has similar periods for both summer (2.7, 3.9, 6 and 54 years) and winter (2.1, 3.9, 5.4, 1 1 and 27 years).
Table 2. Correlation coefficients between Vostok station climatic records and chosen climatic indices of the SH. Only statistically significant (at the 0.05 level) coefficients are shown
Interestingly, the correlation between summer temperature and mean annual or winter temperature is quite weak, which implies that the climatic variability in the warm and cold parts of the year at Vostok station is formed due to different factors. The closer correlation of the isotopes with the summer temperature could be explained if the most of precipitation had fallen in the warm part of the year. However, this was not the case (Reference EkaykinEkaykin, 2003): snow precipitation is evenly distributed in the annual cycle, with a maximum in spring. As an alternative explanation, we suggest that the isotope content of the snow layers forms as a result of post-depositional processes in snow that are mainly defined by summer temperature (Reference EkaykinEkaykin, 2003). Indeed, with the very low snow accumulation rate typical for Vostok it is possible that the whole annual layer is subjected to postdepositional water-vapor exchange with the atmosphere (Reference Waddington, Steig and NeumannWaddington and others, 2002; Reference Town, Waddington, Walden and WarrenTown and others, 2008), which may even result in complete erasure of the isotopic signal initially recorded in snow precipitation. If so, the heavy-isotope content in snow deposits must be significantly higher than in snow precipitation because of enrichment during post-depositional processes.
Figure 4 shows the mean annual isotope composition of snow precipitation in 2000, 2010 and 2011 (for methods and results for 2000 see Reference Ekaykin, Lipenkov, Kuz’mina, Petit, Masson-Delmotte and JohnsenEkaykin and others, 2004; data for 2010 and 2011 are presented for the first time). In all cases, snow precipitation is substantially (by 10–20%) depleted in deuterium compared to deposited snow dated to the same years, which could be considered to be evidence of postdepositional effects.
In the following subsections we compare Vostok climate records with climatic indices of the SH, with the aim of investigating the main factors influencing the central Antarctic climate.
Vostok climate and Antarctic Oscillation
Antarctic Oscillation (AAO) is defined as the mean latitudinal difference of sea-level pressure between 40° and 65° S (Reference MarshallMarshall, 2003) and is the prevailing type of atmospheric circulation in the SH. Positive AAO values imply stronger zonal circulation. The data we use in our study (Fig. 4) are taken from the Climate Prediction Center (CPC) of the US National Oceanic and Atmospheric Administration’s (NOAA’s) National Weather Service (http://www.cpc.ncep.noaa.gov/products/precip/CWlink/daily_ao_index/aao/monthly.aao.index.b79.current.ascii.table) (from 1979) and from the British Antarctic Survey (http://www.antarctica.ac.uk/met/gjma/sam.html) (from 1957).
The AAO index shows no correlation with summer temperature, but a strong negative correlation with winter and mean annual temperature (Table 2). The mechanism of this relationship is assumed to be relatively simple: the higher is AAO, the stronger is zonal circulation, the colder is central Antarctica. Before 1979, this correlation is significantly weakened. This could be related to increased uncertainty of the AAO values before 1979, or to the climate shift occurring in the 1970s (Reference Giese, Urizar and FuckarGiese and others, 2002), as discussed in detail below.
Another noteworthy feature is that if we use the 3 year running means, the correlation weakens. This means that the AAO and winter temperature are correlated on the shortterm scale (both have a strong power on the 2.1 year variability) but not on the longer-term scale. The 3 year running mean of the AAO shows a positive (0.39) correlation with VRS13, which might reflect similar (positive) trends in both series from 1957 to 2010. Otherwise, one would expect a negative correlation between AAO and isotope content in central Antarctic precipitation, not only because of lower local temperature in the positive AAO years, but also because of stronger temperature difference between high and low latitudes, leading to more intensive heavy isotope depletion in the moisture arriving in central Antarctica.
In general, the influence of the AAO on the isotope content of deposited snow at Vostok is reduced, since the latter seems to be dependent on summer temperature, which is weakly correlated with AAO.
Vostok climate and Southern Oscillation Index
The Southern Oscillation Index (SOI) is one of the main tropical atmospheric circulation modes and is defined as the air pressure difference between the western and eastern tropical Pacific (Reference TrenberthTrenberth, 1984). The SOI reveals climate teleconnections with different regions of the Earth, although their mechanism, as well as the driving force of the SOI itself, is still poorly understood.
The data used here were taken at the CPC site http://www.cpc.ncep.noaa.gov/data/indices/soi (from 1951). We observe a good correlation (0.47) with summer temperature at Vostok before 1979 (Fig. 4; Table 2). Similar to AAO, the correlation is stronger for unsmoothed data, i.e. both records have similar variability with a wavelength of 2.5 years. We conclude that high-frequency anomalies of air pressure and temperature in the tropical Pacific are one of the main factors affecting summer temperatures in central Antarctica. Although the tendency to increased air temperature in the Antarctic interior during the elevated SOI has been noted by Reference Kwok and ComisoKwok and Comiso (2002), the mechanism of this climatic teleconnection is poorly understood.
In the late 1970s this correlation weakens sharply, which is likely related to the above-mentioned climate shift. The SOI shows no correlation with winter or mean annual temperature. The VRS13 series exhibits very good correlation (0.54) with the SOI before the 1970s and weak correlation after. The SOI may affect the stable-isotope content at Vostok by influencing both the local temperature and sea surface temperature in the moisture origin region.
Vostok climate and Pacific Decadal Oscillation
The Pacific Decadal Oscillation (PDO) is another atmospheric circulation mode typical of the Pacific Ocean. It represents a sea surface temperature anomaly in the north Pacific (above 20° N), though the PDO-related oceanic and atmospheric anomalies are seen all around the Pacific region (Reference Chavez, Ryan, Lluch-Cota and NiquenChavez and others, 2003).
The PDO index data since 1900 were taken from the website of the Joint Institute for the Study of the Atmosphere and Ocean, University of Washington, USA (washington.edu/pdo/PDO.latest) washington.edu/pdo/PDO.latest). We also use the PDO values reconstructed based on the hydrologically sensitive Pinus flexilis tree-ring chronologies from California, USA, and Alberta, Canada, since AD 993 (Reference MacDonald and CaseMacDonald and Case, 2005), available at the site of the NOAA’s National Climatic Data Center (http://ftp://ftp.ncdc.noaa.gov/pub/data/paleo/treering/reconstructions/pdo-macdonald2005.txt).
A positive correlation between the Vostok snow isotope content and accumulation rate and the PDO index in the 20th century was first pointed out in Reference Ekaykin, Lipenkov, Kuz’mina, Petit, Masson-Delmotte and JohnsenEkaykin and others (2004), though the mechanism of signal transfer from the north Pacific to central Antarctica is yet not known. The PDO exhibits a significant correlation with Vostok summer temperature, but the sign of the correlation changes in the 1970s: 0.38 before and –0.60 after. In both cases, the correlation appears only after smoothing the initial data with the 3year window, which means that the PDO does not affect the short-term temperature variability.
Similar to Reference Ekaykin, Lipenkov, Kuz’mina, Petit, Masson-Delmotte and JohnsenEkaykin and others (2004), here we demonstrate that PDO is positively correlated with the Vostok stack isotopic record (r = 0.39). However, a closer look at both records shows that before the 1970s the correlation is higher (0.40), while during the past 30 years it becomes negative, so the picture is more complex than was previously thought.
Formation of the δD signal at Vostok and the 1970s climate shift
Based on the results in the previous subsections we suggest a mechanism for formation of the isotope signal in the Vostok deposited snow. The δD content of snow is related to the temperature in the warm period (November–January), likely as a consequence of post-depositional processes. In turn, summer temperature is largely defined by climatic variability in the Pacific region in the frames of PDO and SOI modes. The SOI affects the short-term part of the Vostok summer temperature variability and is only active before the 1970s climate shift. The PDO affects the long-term part of the variability and changes the sign of its influence from positive (pre-1970s) to negative (post-1970s). In this scheme it remains unclear which factor defines the short-term variability of Vostok summer temperature in the 1980s– 2010s.
Aside from this, we suggest that summer temperature is related to local solar insolation: there is a tendency (r = 0.23) towards a correlation between summer temperature and radiation balance, but we have only 15 years of balance data, which does not allow us to define whether this correlation is significant or not. There could also be a ‘direct’ relationship between the Vostok snow isotope content and the SH climatic indices that change the sea surface temperature in the regions where Vostok precipitation originates.
Though the origin of the 1970s climate shift is not known (Reference Giese, Urizar and FuckarGiese and others, 2002), its influence on Antarctic climate has already been reported. Thus, at the Law Dome site in the late 1970s an increase in snow isotope content and accumulation rate, followed by decreased values of deuterium excess, is observed, which is explained by the shift of the moisture source to higher latitudes (Reference Masson-DelmotteMasson-Delmotte and others, 2003). At Vostok station the 1970s shift may reveal itself in a change in the mechanism of the heat/water-vapor transport from the tropics to central Antarctica and/or in a change in the main source of water vapor (Pacific or Indian Ocean). In the recent period (1999–2005) the Vostok site has received moisture mainly from the Indian Ocean (Reference Sodemann and StohlSodemann and Stohl, 2009), but Vostok is very close to the region affected by the Pacific Ocean (Reference Sodemann and StohlSodemann and Stohl, 2009; Reference Ekaykin, Shibaev, Lipenkov, Salamatin, Popov and KotlyakovEkaykin and others, 2011). It is also possible that in the previous period (before the 1970s climate shift) Vostok received more moisture from the Pacific.
Multiple climate shifts during the past three centuries
Figure 5 plots the Vostok stack isotope records together with the PDO data (both instrumental since 1900 and reconstructed since 1650). The correlation between the two parameters has changed sign several times during the past 350 years. To demonstrate this, we calculated the correlation coefficients for 30 year periods (Fig. 5, bottom).

Fig. 5. Comparison of the Vostok snow isotope content with the PDO index. The upper part of the figure shows the PDO index (instrumental data since 1900 and reconstructed data since 1650). The middle part shows the stack records of δD values in the Vostok snow deposits (VRS13 series); the dashed line is the data from a single snow core (VK07). The lower part shows correlation coefficients between the PDO indices and VRS13 calculated for 30 year periods. Thin horizontal dashed lines are the limits of significance. Color shading highlights the periods of positive (red) and negative (blue) correlation between the PDO and VRS13.
For most of the 20th century the correlation between PDO and VRS13 is positive, as noted in the previous subsection, but it switches to negative in the 1970s, which is likely related to the climate shift. Although the shift is believed to originate in the SH (Reference Giese, Urizar and FuckarGiese and others, 2002), it also revealed itself in the Northern Hemisphere, particularly, in the PDO index, so the change in correlation sign between the PDO and VRS13 could be an indicator of the climate shift.
Before the 20th century, there were two epochs of positive correlation (mid-18th century and early 19th century) and three epochs of negative correlation. Similar to the 1970s, we may attribute the change in correlation sign to the climatic shift in the SH. If so, these shifts likely took place in the 1720s, 1750s, 1790s, 1820s, 1880s and, most recently, the 1970s.
Temperature history at Vostok
Figure 6 shows the Vostok air temperature anomaly for the warm period (November-January) since 1729 reconstructed based on the correlation between snow isotope content and instrumental data (the latter is also shown in magenta). Zero corresponds to the mean temperature over the instrumental period (1958-2012).
Fig. 6. Temperature anomalies in the Antarctic, the SH and at Vostok station. The upper part of the figure shows the air temperature anomaly for Antarctica since 1800 calculated by Reference SchneiderSchneider and others (2006) (brown), and anomaly of the sea surface temperature of the SH in November–January since 1880 (yellow). The lower part shows the anomaly of the warm period temperature (November–January) at Vostok station based on the instrumental (magenta) and reconstructed (red) data.
We conclude that the present-day epoch is relatively warm, while 18th- and 19th-century summers were considerably colder. The temperature varied periodically (with a wavelength of about 30 and 50 years), with an absolute magnitude of ~3.5°C (from +1.5 to -2°C). The warmest part of the record is observed around 1940, and the coldest was in the 1900s. In the first two centuries of the record, we see an overall cooling, with the minimum temperature in the second half of the 19th century, while in the 20th century the trend was positive. As for the mean annual air temperature, it is difficult to draw conclusions based on the data available, since, as shown above, the mean annual temperature at Vostok is poorly correlated with summer temperature, at least on a decadal timescale.
We compared our data with the Antarctic temperature stack record since 1800 deduced by Reference SchneiderSchneider and others (2006). The two series are similar, with a good correspondence between maxima and minima, although the Vostok record tends to lead the mean Antarctic record by up to 10 years (Fig. 6). We also compared our stack record with air temperature anomalies in the whole SH since 1880 (the data are available at the NOAAʹs website: http://www.ncdc.noaa.gov/cmb-faq/anomalies.php). We observe a very good correlation (0.70) between summer temperature at Vostok and the summer temperature of the sea surface (Fig. 6). The latter is also well correlated with the Vostok isotope stack record (r=0.35). Generally, the summer temperature at Vostok correlates better with any SH temperature series than Vostok winter or mean annual temperature.
Thus, the Vostok climate record greatly resembles temperature variability on the continental and hemispheric scale, demonstrating that Vostok ice-core records may be used for global climate reconstructions.
Conclusion
We used stable water isotope data from 15 snow pits and cores to construct a stack isotope record for the southern Vostok Subglacial Lake region covering the past 350 years. The comparison between this record and instrumental temperature data from Vostok station shows that snow isotope content is poorly correlated with mean annual air temperature, but closely resembles the temperature of the warm period (November-January). This may be due to postdepositional processes in snow thickness that are mainly affected by the summer temperature. If so, a revision of the temperature interpretation of the Vostok deep ice-core isotopic data may be needed.
Interestingly, summer air temperature is not correlated with mean annual or winter air temperatures, which implies different factors are involved. It has been shown that winter temperature is mainly governed by AAO variability, while summer temperature is related to the PDO and SOI oscillations.
A change in the sign of correlation between Vostok climate record and SH climatic indices is observed in the late 1970s, which is assumed to be related to a climatic shift (Reference Giese, Urizar and FuckarGiese and others, 2002). The comparison between the PDO index and Vostok isotope data since 1650 suggests that five climate shifts have occurred in the last three centuries.
In general, during the study period, Vostok summer temperature varied periodically with a magnitude of ~3.5°C and a wavelength of 30-50 years. In the 18th and 19th centuries the temperature decreased, and the 20th century is characterized by a positive trend. The decadal and secular variability of the Vostok temperature is similar to oscillations of temperature over the whole of Antarctica and SH, demonstrating that the Vostok ice-core data are a proxy for the global variability.
Acknowledgements
The work was financially supported by the Russian Foundation for Basic Research grant 13-05-00607. We thank Alice Lagnado for improving the English, and two anonymous reviewers for valuable comments.


