


1. Introduction
The flow of particles in a vertical channel of infinite length bounded by parallel walls under the influence of gravity is one of the simplest examples of a granular flow. This is an approximation for the flow in the central region of a long vertical bin away from the free surface and the bottom exit. The flow is expected to be unidirectional and fully developed, and the velocity in the vertical direction is a function of only one cross-stream direction, if we assume that the system is infinite in the second cross-stream direction. This flow has been studied in experiments (Savage Reference Savage1979; Nedderman & Laohakul Reference Nedderman and Laohakul1980; Natarajan, Hunt & Taylor Reference Natarajan, Hunt and Taylor1995; Pouliquen & Gutfraind Reference Pouliquen and Gutfraind1996; Ananda, Moka & Nott Reference Ananda, Moka and Nott2008) and using theoretical models (Goodman & Cowin Reference Goodman and Cowin1971; Savage Reference Savage1979; Gutfraind & Pouliquen Reference Gutfraind and Pouliquen1996; Mohan, Nott & Rao Reference Mohan, Nott and Rao1997, Reference Mohan, Nott and Rao1999; Barker, Zhu & Sun Reference Barker, Zhu and Sun2022; Debnath, Kumaran & Rao Reference Debnath, Kumaran and Rao2022). There is consensus that the flow consists of a central plug zone, where the material flows without shearing, and relatively thin layers close to the wall where there is shearing. These flows are usually very dense, and the volume fraction is close to random close packing, though there is a decrease in the volume fraction in the shearing zones close to the wall. From the momentum balance, the normal stress in the cross-stream direction is a constant. If the decrease in the volume fraction near the walls is neglected, then the shear stress increases proportional to the distance from the centre of the channel. The precise volume fraction is difficult to measure in experiments as it is near close packing, but the flow velocities have been measured. Despite the simplicity of the configuration, there is as yet no established model for the dependence of the velocity profile, volume fraction and shear layer thickness on the system parameters such as the channel width, particle diameter and average volume fraction.
In experimental configurations, the flow rate in the fully developed unidirectional flow far from the exit depends on the width of the exit slot and the exit conditions. The discharge rate at the exit is described by the Beverloo correlation (Beverloo, Leniger & Van de Velde Reference Beverloo, Leniger and Van de Velde1961), where the velocity is proportional to the square root of the width of the exit slot. The discharge rate at the exit slot determines the average flow velocity far upstream of the exit slot, and the average volume fraction at that location is set by the flow velocity, overburden, and the particle–particle and particle–wall interactions. If the width of the channel is much smaller than the height, then the weight of the overburden at a given depth from the free surface is balanced by the frictional force exerted by the side walls (the Janssen effect; Janssen Reference Janssen1895), and the pressure is independent of depth; this is in contrast to the linear increase of pressure with depth for normal fluids. For a steady unidirectional flow, the total height of the channel does not affect the flow. Therefore, the flow profile in the central region of the channel should be amenable to a description based on the average volume fraction, the wall friction and the dimensions in that region, instead of the total height or the discharge rate fixed at the exit.
To examine a steady fully developed unidirectional flow, we consider a simpler configuration in simulations, where the channel is bounded by two flat frictional walls in the cross-stream direction, and periodic boundary conditions are imposed in the flow and spanwise directions. The average volume fraction of particles in the channel is fixed by the initial loading before the onset of flow. If the average volume fraction is small, then it is expected that the particles will accelerate continuously due to gravity, and no steady state will be reached. If the average volume fraction is near random close packing, then there will be a jammed state in which there is no flow. Here, we examine an intermediate range of the average volume fractions where there is a steady fully developed flow.
The salient feature of the flow in a channel is the presence of a plug zone at the centre where there is no shearing, and shear layers at the walls. Two possible states are predicted by frictional models, a static state and a plug flow with an indeterminate velocity. This is because frictional models do not have any rate dependence, and they do not contain any intrinsic length scale. A microscopic length scale has been included in different ways in models for dense granular flows. In the Cosserat models (Mohan et al. Reference Mohan, Nott and Rao1999; Mohan, Rao & Nott Reference Mohan, Rao and Nott2002), the particle spin is incorporated as an additional field; the length scale in this model is the distance from the walls over which there is a difference between the particle angular velocity and the material rotation rate due to the wall effect. Granular fluidity models (Aranson & Tsimring Reference Aranson and Tsimring2001; Henann & Kamrin Reference Henann and Kamrin2013) define an additional field that is a measure of the extent of ‘fluidity’ of the material at a location. The fluidity is determined from a conservation equation similar to a diffusion equation (Henann & Kamrin Reference Henann and Kamrin2013) or an order parameter equation describing the cross-over between flowing and static states (Aranson & Tsimring Reference Aranson and Tsimring2001). A different approach was followed by Dsouza & Nott (Reference Dsouza and Nott2020), where the flow rule was integrated over a representative volume with an effective mesoscopic size, to obtain constitutive relations containing the Laplacian of the rate of deformation tensor. However, these models require boundary conditions to be specified, and these boundary conditions are not prescribed. There is ambiguity in how the boundary conditions are to be imposed in different configurations. Some of these models have third and higher derivatives of the velocity, hence additional boundary conditions are required.
The incompressible  $\mu (I)$ models (GDR-MiDi 2004; Jop, Forterre & Pouliquen Reference Jop, Forterre and Pouliquen2006) attempt to incorporate rate dependence in the constitutive relations through the inertia parameter $I$. The friction coefficient $\mu$, the ratio of the shear and normal stresses, is expressed as a function of $I$, the shear rate non-dimensionalized by the square root of the normal stress along with suitable powers of the particle diameter and density. Universal relations, presented later in (B3) and (B4), have been proposed for the relation between the stress, volume fraction and inertia parameter. While the $\mu (I)$ rheology has been used widely for diverse applications, it is ill-posed in the sense that it is unstable to small wavelength perturbations. Well-posed models have been proposed by incorporating compressibility and inertia parameter in the flow rule and the yield function (Barker et al. Reference Barker, Schaeffer, Shearer and Gray2017; Schaeffer et al. Reference Schaeffer, Barker, Tsuji, Gremaud, Shearer and Gray2019).
Recently, Debnath et al. (Reference Debnath, Kumaran and Rao2022) compared the predictions of some of these models with simulation results. None of the models predict all the profiles well, and some of the models could not be solved for some values of the parameters used. For example, the model of Barker et al. (Reference Barker, Schaeffer, Shearer and Gray2017) predicts that the volume fraction is almost a constant across the channel. The occurrence of negative fluidity in the model of Henann & Kamrin (Reference Henann and Kamrin2013) in some cases is an unrealistic feature. The model of Dsouza & Nott (Reference Dsouza and Nott2020) predicts thick shear layers and higher normal stress compared to results obtained using the discrete element method (DEM).
Another issue in applying the non-local model of Kamrin & Koval (Reference Kamrin and Koval2012) is the following. The vertical flow considered by Kamrin & Koval (Reference Kamrin and Koval2012) and Kim & Kamrin (Reference Kim and Kamrin2020) is unusual, because the pressure exerted on the walls is specified, and not the loading. Therefore, the width is permitted to vary, while the pressure is maintained as constant. This is rather unrealistic, because in a practical realization, one of the walls is not fixed, but is connected to springs that maintain a constant normal stress. This configuration was used specifically because the  $\mu (I)$ parameter can be calculated directly from the known normal stress, and the shear stress can be determined from the body force per unit volume. In contrast, we are examining a flow where the average volume fraction is specified, but the normal stress is not.
The flow down an inclined plane is a configuration that has been studied widely using particle-based simulations (Silbert et al. Reference Silbert, Ertas, Grest, Halsey, Levine and Plimpton2001; Mitarai & Nakanishi Reference Mitarai and Nakanishi2005; Brewster et al. Reference Brewster, Silbert, Grest and Levine2008; Reddy & Kumaran Reference Reddy and Kumaran2007, Reference Reddy and Kumaran2010). In three-dimensional simulations of particle assemblies, there is no flow when the angle of inclination is below a minimum value of about  $20^\circ$. There is steady flow over a relatively small range of angles, ${\sim }20^\circ \unicode{x2013} 24^\circ$, and the flow becomes unstable when the angle of inclination exceeds about $25^\circ$. There are several intriguing features that are observed for a steady flow. From momentum balance, the ratio of the normal and shear stresses is equal to the tangent of the angle of inclination. The volume fraction is found to be independent of height, in contrast to the intuitive expectation of greater compaction with increasing depth due to the higher overburden. The ‘Bagnold law’ (Bagnold Reference Bagnold1954, Reference Bagnold1956) describes the relation between the stress and the velocity profile in the bulk, and the ‘granular temperature’ (defined in (2.3)) increases linearly with depth. A novel transition between an ordered and a disordered flow due to an increase in the base roughness has also been reported (Kumaran & Maheshwari Reference Kumaran and Maheshwari2012; Kumaran & Bharathraj Reference Kumaran and Bharathraj2013; Bharathraj & Kumaran Reference Bharathraj and Kumaran2017; Silbert et al. Reference Silbert, Grest, Plimpton and Levine2002). The relation between the stress and shear rate is found to obey the Bagnold law in both the ordered and disordered flows, though the Bagnold coefficients are very different.
The Bagnold law, which states that the stress is proportional to the square of the shear rate, follows from dimensional analysis if the inverse of the shear rate is the only time scale in the problem. The assumption is that the particle interactions are instantaneous, and this assumption is valid if the period of the interactions is much smaller than the inverse of the shear rate. The instantaneous collision assumption is made in kinetic theory of granular flows, where the particle velocity distribution function is defined in a manner similar to the molecular distribution function in the kinetic theory of gases (Lun et al. Reference Lun, Savage, Jeffrey and Chepurniy1984; Jenkins & Richman Reference Jenkins and Richman1985; Kumaran Reference Kumaran1998). The mass, momentum and energy conservation equations are derived from the Boltzmann equation for the velocity distribution function. The energy conservation equation for the granular temperature contains an additional dissipation term due to particle interactions which is not present for a molecular fluid. In kinetic theory, it is also assumed that the system is dilute, and correlations between colliding particles are neglected due to the ‘molecular chaos’ assumption. Constitutive relations for dense granular flows have been derived using the Enskog procedure (Sela, Goldhirsch & Noskowicz Reference Sela, Goldhirsch and Noskowicz1996; Sela & Goldhirsch Reference Sela and Goldhirsch1998; Kumaran Reference Kumaran2004, Reference Kumaran2006), and attempts have been made to go beyond the molecular chaos assumption and incorporate correlations in the pre-collisional velocities of the particles (Goldhirsch & van Noije Reference Goldhirsch and van Noije2000; Kumaran Reference Kumaran2009a,Reference Kumaranb). With these refinements, it has been shown that the salient features of a dense granular flow in an inclined channel are captured adequately by models based on the hard-particle approximation (Kumaran Reference Kumaran2008, Reference Kumaran2014).
For an inclined plane flow, as the inclination angle is decreased, the maximum volume fraction in the flowing state is about 0.585–0.59, which is denoted the volume fraction for arrested dynamics,  $\phi _{ad}$. The physical meaning of $\phi _{ad}$ is that an assembly of perfectly hard spheres (in which the repulsive force is zero when two particles are not in contact, and infinite when they are in contact) cannot be sheared if the volume fraction $\phi$ exceeds $\phi _{ad}$. For $\phi \geq \phi _{ad}$, shearing is possible only if the particles have finite stiffness. For $\phi < \phi _{ad}$, the Bagnold law based on the hard-particle model appears to apply even for dense granular flows. Kinetic models have been modified by incorporating a mesoscopic length scale representing particle chains to predict $\phi _{ad}$ in a sheared dense granular flow (Jenkins Reference Jenkins2006, Reference Jenkins2007; Berzi & Jenkins Reference Berzi and Jenkins2015).
The change in the rheology at  $\phi = \phi _{ad}$ is consistent with the simulation studies of Kumaran (Reference Kumaran2009c,Reference Kumarand). These showed that $\phi _{ad}$ for a dense sheared inelastic hard-particle fluid is a function of the coefficients of restitution ( $e_n,e_t$) in the directions perpendicular and parallel to the surfaces at contact. The value of $\phi _{ad}$ is in the range 0.585–0.59 for smooth ( $e_t = -1$) inelastic particles with $e_n$ less than 0.6, and 0.581–0.612 for perfectly rough ( $e_t = 1$) inelastic particles with $e_n \geq 0.6$. It is significantly lower than the random close packing volume fraction $\phi _{rcp} = 0.64$ for an elastic hard-sphere fluid in the absence of shear. In contrast, the volume fraction $\phi$ in the plug zone could be significantly higher than $\phi _{ad}$ in the vertical channel. This raises the question of whether the nature of the flow in a vertical channel is qualitatively different from the flow down an inclined plane, or whether $\phi$ in the shearing zones is below $\phi _{ad}$ and the hard-particle model can be applied.
Berzi, Jenkins & Richard (Reference Berzi, Jenkins and Richard2019, Reference Berzi, Jenkins and Richard2020) have separated the flow through an inclined chute with bumpy base and frictional side walls into two regimes: (i) a dense erodible layer near the bumpy base where  $\phi \geq \phi _{c}$, a critical volume fraction; and (ii) a loose collisional layer above the erodible zone where $\phi < \phi _c$. The concept of $\phi _c$ can be linked to $\phi _{ad}$, which will be discussed shortly. The material in the erodible layer moves very slowly with negligible particle fluctuations compared to that in the collisional layer. The stress and dissipation rate in the collisional flow are adapted from the kinetic theory of granular flows with coefficients modified to incorporate the finite duration of contacts (Berzi & Jenkins Reference Berzi and Jenkins2015). In the erodible region, the rate-independent stresses arise because of sustained contacts, hence a rate-independent component is added to the pressure (Berzi et al. Reference Berzi, Jenkins and Richard2020). The form of the rate-independent term in pressure is motivated from the plane shear studies done by Chialvo, Sun & Sundaresan (Reference Chialvo, Sun and Sundaresan2012). The latter have shown that the rate-independent effects are dominant for $\phi \geq \phi _c$ in the limit of vanishing shear rate, and $\phi _c$ does not depend on $e_n$. It varies with the coefficient of interparticle friction $\mu _p$; for example, $\phi _c = 0.587$ for $\mu _p = 0.5$, which Berzi et al. (Reference Berzi, Jenkins and Richard2019, Reference Berzi, Jenkins and Richard2020) have adopted to mark the boundary between the erodible and collisional layers.
It is interesting to note that the range of  $\phi _c$ for $\mu _p$ varying between $0$ and $1$ in the plane shear simulations of soft particles having finite stiffness (Chialvo et al. Reference Chialvo, Sun and Sundaresan2012; Berzi & Vescovi Reference Berzi and Vescovi2015) is similar approximately to $\phi _{ad}$ in plane shear simulations of hard inelastic rough particles having infinite stiffness (Kumaran Reference Kumaran2009c, Reference Kumarand). Chialvo et al. (Reference Chialvo, Sun and Sundaresan2012) state that $\phi _c$ is similar to $\phi _{ad}$, and this volume fraction is an important parameter to explain arrested dynamics or jamming. In the vertical channel flow, we examine whether the distinction into different zones – collisional flow and erodible bed – in an inclined plane flow is similar to that between the plug and shear layers for a vertical channel flow. The volume fraction for arrested dynamics is considered to be $\phi _{ad} = 0.587$ in the channel flow for definiteness, as we performed soft-sphere DEM simulations with $\mu _p = 0.5$.
In the vertical channel flow, the simulations are carried out to examine the flow mechanics at the particle scale, to examine which of the different approximations apply in a vertical channel flow. An important issue is whether there are multiple zones with distinct flow regimes, the nature of the rheology in these zones, and whether properties like the volume fraction and the shear rate vary continuously across these zones. Of interest is whether the relation between the friction coefficient and the shear rate varies in different zones, and the nature of the variation. Also of interest is the effect of particle stiffness on rheology in different zones. Another relevant quantity in the kinetic-theory-based models is the granular temperature, which is the mean square of the fluctuating velocity of the particles. We examine whether the variation of the granular temperature is continuous across the channel, and whether the temperature is non-zero in the plug zone. The nature of the velocity profile in the shearing zone is also examined here, to determine the universality and scaling with respect to the channel width. The relation between the slip velocity and the shear rate at the wall, and their variation with channel width, is also determined.
The simulation methodology is summarized briefly in Appendix A, and the flow configuration and preparation protocols are discussed in § 2. Appendix B summarizes the theoretical formulations that are compared with simulations in § 3. The important conclusions are summarized in § 4.
2. Flow configuration
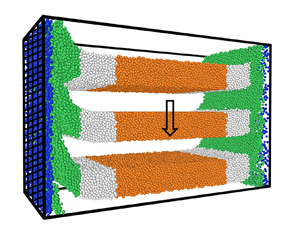
Studies are carried out on the flow through a vertical channel of rectangular cross-section with dimensions  $H \times W \times B$, as shown in figure 1. The channel is bounded by two flat frictional vertical walls in the $x$ direction at $x = 0$ and $x = W$, and gravitational acceleration acts in the vertical $y$ direction. Periodic boundary conditions are applied in the vertical $y$ direction and in the $z$ direction in the horizontal plane. Attention is confined to steady fully developed flows that are symmetric about the central plane at $x = W/2$, therefore results are shown only for $0 \leq x \leq W/2$. The width of the channel is varied in the range $60 \, d_p \leq W \leq 150 \, d_p$, and the other two dimensions are $B = 40 \, d_p$ and $H = 60 \, d_p + \Delta H$, where $d_p$ is the nominal particle diameter, and the choice of $\Delta H$ is discussed shortly. The total number of particles is $1.7 \times 10^5$ for a system of width $60 \, d_p$, and $4.1 \times 10^5$ for a system of width $150 \, d_p$. A polydisperse mixture of particles is used, where 30 % of the particles have diameter $0.9 \, d_p$, 40 % have diameter $d_p$, and 30 % have diameter $1.1 \, d_p$.

Figure 1. The configuration and coordinate system for analysing the flow in a vertical channel bounded by two flat frictional walls. The hatched surfaces are the flat frictional walls in the  $x$ direction, and periodic boundary conditions are applied in the other two directions.
The preparation protocol is shown in figure 2. Initially, a flat surface is placed at the bottom of the channel. The channel is filled by raining the particles uniformly under the effect of gravity up to a height  $H - \Delta H$. After the particles settle, the bottom is removed and the periodic boundary conditions are imposed in the vertical $y$ and spanwise $z$ directions. Here, the value of $\Delta H$ is chosen such that a desired value of the average volume fraction $\bar {\phi }$, the ratio of the total volume of the particles to the volume of the channel, can be obtained. For $W = 60\unicode{x2013}150 \,d_p$, a final steady state is achieved for $\bar {\phi }$ in the range $\bar {\phi }_{cr}$ to $\bar {\phi }_{max}$. When $\bar {\phi }$ is greater than $\bar {\phi }_{max} = 0.62$, the channel jams and there is no flow. When $\bar {\phi }$ is decreased below $\bar {\phi }_{cr}$, there is an oscillatory and then an accelerating flow (Debnath, Kumaran & Rao Reference Debnath, Kumaran and Rao2019). The value of $\bar {\phi }_{cr}$ is found to be 0.59 for $W = 100\unicode{x2013}150 \,d_p$. The present study is restricted to the steady fully developed flows.

Figure 2. Preparation protocol for the channel flow. An impenetrable surface is placed at the bottom (a), and particles are filled in up to a height  $(H - \Delta H)$. The bottom is removed (b), periodic boundary conditions are applied in the $y$ and $z$ directions, and the flow is evolved to reach steady state.
Raafat, Hulin & Herrmann (Reference Raafat, Hulin and Herrmann1996) studied the flow of sand grains in a capillary tube, where the ratio of the particle size to the tube diameter was relatively small, in the range 6–30. The average volume fraction  $\bar {\phi }$ was in between the dilute regime where there is a free fall of grains, and the dense slow flow regime. At these intermediate average volume fractions, density waves are observed in the channel, in the form of bubbles and clogs. For the relative small size of the tube used, finite-size effects are likely to be important. This is different from the present analysis, where the size ratio is in the range 60–150, and $\bar {\phi }$ is in the dense flow regime. Due to this, density waves are not observed here.
The time required for the flow to attain a steady fully developed state is  $2 \times 10^3 \sqrt {d_p/g}$, and the averaging time for calculating the properties is $6 \times 10^2 \sqrt {d_p/g}$. To calculate the variation of the properties in the cross-stream $x$ direction, the channel is divided into bins of width $d_p$, except for the bin near the wall, which is set to $1.5 \, d_p$. The velocity, angular velocity and granular temperature fields are calculated as
 $$\begin{gather} \boldsymbol{v} =
\frac{\sum_{i=1}^N m_i
\boldsymbol{v}_i}{\sum_{i=1}^N m_i},
\end{gather}$$
$$\begin{gather} \boldsymbol{v} =
\frac{\sum_{i=1}^N m_i
\boldsymbol{v}_i}{\sum_{i=1}^N m_i},
\end{gather}$$
 $$\begin{gather}\boldsymbol{\varOmega} =
\frac{\sum_{i=1}^N I_i
\boldsymbol{\varOmega}_i}{\sum_{i=1}^N
I_i}, \end{gather}$$
$$\begin{gather}\boldsymbol{\varOmega} =
\frac{\sum_{i=1}^N I_i
\boldsymbol{\varOmega}_i}{\sum_{i=1}^N
I_i}, \end{gather}$$
 $$\begin{gather}T = \frac{1}{6N} \sum_{i=1}^N \left(m_i (\boldsymbol{v}_i-\boldsymbol{v})^2 + I_i (\boldsymbol{\varOmega}_i - \boldsymbol{\varOmega})^2\right), \end{gather}$$
where N is the number of particles whose centres lie in the bin,  $m_i$ and $I_i = \frac {1}{10} m_i d_i^2$ are the mass and moment of inertia of particle $i$, and $\boldsymbol {v}_i$ and $\boldsymbol {\varOmega }_i$ are the linear and angular velocities of that particle. The stress tensor $\boldsymbol {\sigma }$ is
 \begin{equation} \boldsymbol{\sigma} = \frac{1}{V} \sum_{i=1}^N \left[ \left( \sum_{j \neq i}^{n_{contacts}} \frac{\boldsymbol{F}_{ij} \,\boldsymbol{x}_{ij}}{2} \right) + m_i (\boldsymbol{v}_i - \boldsymbol{v}) (\boldsymbol{v}_i - \boldsymbol{v}) \right]. \end{equation}
Here,  $V$ is the volume of the bin, and the summation $j$ is carried out over all contacts of particle $i$. The first term in (2.4) is the contribution to the stress due to interparticle interactions, and the second term is the kinetic contribution due to the particle fluctuating velocities. The rate of dissipation of energy per unit volume $D$ is calculated as
 \begin{equation} D = \frac{1}{V \tau} \sum_{i=1}^N \sum_{j \neq i}^{n_{contacts}} \int_0^\tau(\boldsymbol{F}_{ij} \boldsymbol{\cdot} \boldsymbol{v}_{ij}) \,{\rm d}t, \end{equation}
where  $\tau$ is the period of the simulation. The rate of dissipation of energy is also a local quantity, evaluated for all the particles with centres within a bin.
The DEM and the simulation parameters are described in Appendix A. In the results, the particle density is considered to be  $1$, so that the mass dimensions in all quantities are scaled appropriately.
3. Results
3.1. Velocity and stress profiles
There is a steady flow for a small range of the average volume fraction  $\bar {\phi } = 0.59\unicode{x2013} 0.61$. The average velocity fluctuates in time for $\bar {\phi } = 0.62$, and there is no flow when $\bar {\phi }$ exceeds $0.62$. The typical time series for the velocity of the centre of mass $u_{cm}$, scaled by its time-averaged value $\bar {u}_{cm}$, is shown in figure 3. It is observed that there are fluctuations of 1–2 % for $\bar {\phi } = 0.62$. In contrast, for $0.59 \leq \bar {\phi } \leq 0.61$, the variation in the velocity of the centre of mass is less than 1 %, indicating that there is uniform steady flow.

Figure 3. A typical time series of the centre of mass velocity  $u_{cm}$ divided by its time-averaged value $\bar {u}_{cm}$ for a channel of width 100 particle diameters and for average volume fraction $\bar {\phi } = 0.62$ ( $\circ$), $\bar {\phi } = 0.61$ ( $\triangle$), $\bar {\phi } = 0.6$ ( $\nabla$) and $\bar {\phi } = 0.59$ ( $\diamond$).
The velocity profiles, shown as functions of cross-stream distance in figure 4(a), exhibit a plug-like behaviour in the central region, a shear zone close to the wall and significant slip at the wall. Both the slip velocity  $u_{slip}$ and the maximum velocity $u_{max}$ increase as $\bar {\phi }$ decreases, and as the channel width $W$ increases. Both $u_{slip}$ and $u_{max}$ increase by a factor of $5$ or more when $\bar {\phi }$ is decreased from $0.62$ to $0.59$. There is also a significant increase in $u_{max}$ and $u_{slip}$, by a factor of $3$ when $W$ is increased from $60 \, d_p$ to $150 \, d_p$. From figure 4, it is also evident that the length scale for the shearing region at the wall is also a function of $\bar {\phi }$ and $W$.
$W$.

Figure 4. The velocity  $u_y$ as a function of $x/d_p$ (a) and the scaled velocity $(u_y - u_{slip})/(u_{max}-u_{slip})$ as a function of $x/\delta _{0.95}$. Here, $u_{slip}$ is the slip velocity at the wall, $u_{max}$ is the maximum velocity at the centre and $\delta _{0.95}$ is the distance at which $(u_y - u_{slip})/(u_{max}-u_{slip}) = 0.95$. The average volume fractions are $\bar {\phi } = 0.62$ ( $\circ$), $\bar {\phi } = 0.61$ ( $\triangle$), $\bar {\phi } = 0.6$ ( $\nabla$) and $\bar {\phi } = 0.59$ ( $\diamond$). The profiles are shown in black for $W = 60 \, d_p$, blue for $W = 100 \, d_p$, green for $W = 120 \, d_p$ and brown for $W = 150 \, d_p$. The red dashed line in (b) is the exponential fit equation (3.1).
In figure 4(b), the scaled velocity is defined as  $(u_y - u_{slip})/(u_{max} - u_{slip})$. This is plotted as a function of the scaled distance from the wall, $x/\delta _{0.95}$, where $\delta _{0.95}$ is the distance at which $(u_y - u_{slip})/(u_{max}-u_{slip}) = 0.95$. Plotted in these scaled coordinates, the scaled velocity follows a universal profile that is independent of $\bar {\phi }$ and $W$. Thus the scaled velocity profile has a universal form, though $u_{slip}$, $u_{max}$ and $\delta _{0.95}$ vary significantly with $\bar {\phi }$ and $W$. The red dashed line in figure 4(b) is the fit
 \begin{equation} \frac{u_y-u_{slip}}{u_{max}-u_{slip}} = 1 - \exp(- 3 x/\delta_{0.95}). \end{equation}
This exponential function provides an excellent fit for the scaled velocity profile for the entire range of  $\bar {\phi }$ and $W$ examined here. The average velocity $\bar {u}$ is then expressed in terms of $u_{max}$, $u_{slip}$ and $\delta _{0.95}$ as
 \begin{equation} \bar{u} = u_{max} - \frac{2 \delta_{0.95} (u_{max}-u_{slip})(1 - \exp(- 3 W /2 \delta_{0.95}))}{3 W}. \end{equation}
There are some granular flows for which the scaled velocity profiles are self-similar, such as the Bagnold profile for the flow down an inclined plane, or the error function profiles in shearing zones in split-bottom geometries (Fenistein & van Hecke Reference Fenistein and van Hecke2003). A self-similar velocity profile has not been established in previous studies for the granular flow in a vertical channel, though Pouliquen & Gutfraind (Reference Pouliquen and Gutfraind1996) fitted an exponential profile for the velocity in the shearing zone. The exponential scaling in the latter resulted from the assumption that the momentum transport is an activated process, where the probability of yielding depends on the difference between the stress and a yield stress. The shear stress and the velocity are then given by an exponential function.
In figures 5(a) and 5(b),  $u_{slip}$ and $u_{max}$ are shown as functions of $\bar {\phi }$ for different values of $W$. Both $u_{slip}$ and $u_{max}$ decrease by about one order of magnitude when $\bar {\phi }$ is increased from $0.59$ to $0.62$. In these figures, $u_{slip}$ and $u_{max}$ scaled by $\sqrt {W}$ are shown by the brown lines referenced to the right ordinate. It is observed that there is an excellent collapse of the data for $u_{slip}$ and $u_{max}$ when scaled by $\sqrt {W}$ for $W \geq 100 \, d_p$, though the collapse is not as good for $W = 60 \, d_p$. This is expected if the Froude number for $u_{slip}$ and $u_{max}$ based on $W$ is a constant. The ratio $u_{max}/u_{slip}$ is shown in figure 5(c). It is remarkable that this ratio is nearly a constant, varying by about 2 % in a very small range 1.37–1.40 for all values of $W$ and $\bar {\phi }$.

Figure 5. Plotted as a function of  $\bar {\phi }$: (a) $u_{slip}$ (black lines referenced to left ordinate) and $(u_{slip}/\sqrt {W})$ (brown lines referenced to right ordinate); (b) $u_{max}$ (black lines referenced to left ordinate) and $(u_{max}/\sqrt {W})$ (brown lines referenced to right ordinate); (c) the ratio of $u_{max}$ and $u_{slip}$; and (d) the shear layer thickness $\delta _{0.95}$ (black lines referenced to left ordinate ) and $\delta _{0.95}/W$ (brown lines referenced to right ordinate). The channel widths are $60 \,d_p$ ( $\circ$), $100 \,d_p$ ( $\triangle$), $120 \,d_p$ ( $\nabla$) and $150\, d_p$ ( $\diamond$).
The thickness of the shear zone  $\delta _{0.95}$ is shown as a function of $\bar {\phi }$ in figure 5(d). This thickness decreases as $\bar {\phi }$ increases and as $W$ decreases, indicating that $\delta _{0.95}$ is dependent on $\bar {\phi }$ and $W$. Shown in brown lines in figure 5(d), referenced to the right ordinate, is the ratio $\delta _{0.95}/W$. This ratio is independent of the channel width for $W \geq 100\,d_p$, but not for $W = 60\,d_p$. This indicates that $\delta _{0.95}$ increases approximately proportional to $W$ for the flow in the vertical channel. A consequence of these scaling relations is that the average flow velocity in (3.2) is proportional to $\sqrt {W}$, provided that $W$ is greater than about $100 \, d_p$. Thus the Froude numbers based on the average velocity, maximum velocity and slip velocity are independent of the channel width, and they depend only on the average volume fraction. This scaling law for the velocity is similar to the Beverloo correlation (Beverloo et al. Reference Beverloo, Leniger and Van de Velde1961), which postulates that the average velocity through an orifice of width $D$ is independent of $d_p$ for $d_p \ll D$. From dimensional analysis, the flow velocity has to be scaled by $\sqrt {gD}$.
Cawthorn (Reference Cawthorn2011) has obtained an analytical solution of an incompressible  $\mu (I)$ model for the vertical channel flow. The assumptions used are linear variation of $\mu$ with $I$, no variation in $\phi$, and a no-slip boundary condition at the rough walls. This solution predicts that the velocity in the plug is proportional to $W^{3/2}$, and the scaled thickness of the shear layer $\delta _{0.95}/W$ is a constant for high flow rate. In contrast, Mohan et al. (Reference Mohan, Nott and Rao1999) have used an asymptotic analysis for purely rough walls, and their Cosserat model predicts that the shearing zone thickness is proportional to $W^{1/3}$ in the limit $d_p \ll W$. Recently, Barker et al. (Reference Barker, Zhu and Sun2022) have obtained an analytical solution using a compressible $\mu (I)$ based model, and compared it with their DEM results. They have performed simulations in a periodic cell, where the gravitational acceleration is in opposite directions in the two halves of the cell separated by the vertical mid-plane. This results in a zero-velocity condition at the mid-plane and at the periodic boundaries, which is equivalent to a no-slip boundary condition at the wall. Linear approximations for the dependence of $\mu$ and $\phi$ on $I$ are used in the model of Barker et al. (Reference Barker, Zhu and Sun2022); this results in an exponential variation of $\phi$ with distance from the wall. There is a difference between the exponential profiles predicted by the model and simulation results. However, the model prediction for the velocity profile, which is the sum of linear and exponential functions of the distance from the wall, is in reasonable agreement with simulation results. The average velocity and shear layer thickness are proportional to $W^{3/2}$ and $W$, respectively, which are similar to the values in Cawthorn (Reference Cawthorn2011).
The average velocity is proportional to  $W^{3/2}$ for the following reason. The maximum shear stress at the wall $\sigma _{xy}$ is proportional to $W$ from the momentum balance equation, if the volume fraction variation in the shearing zones is neglected. If the wall friction coefficient is a constant, then the normal stress $\sigma _{xx}$ is also proportional to $W$. If a constant friction constant is substituted in the linear $\mu (I)$ model, then the shear rate at the wall scales as $\sqrt {\sigma _{xx}/\rho d_p^2} \sim g^{1/2}W^{1/2}/d_p$ for large $I$, where $d_p$ is the particle diameter. The shear layer thickness increases proportional to $W$ in the models of Cawthorn (Reference Cawthorn2011) and Barker et al. (Reference Barker, Zhu and Sun2022). Consequently, the maximum and average velocities are proportional to $g^{1/2} W^{3/2}/d_p$, where $g$ is the acceleration due to gravity. It should be noted that this $W^{3/2}$ scaling can be derived in the limit $I \gg 1$ only if a linear relation is postulated between $\mu$ and $I$. If the nonlinear relationship is used where the friction coefficient asymptotes to constants for large $I$, then the scaling is more complicated.
For fixed channel width, the velocity scaling  $g^{1/2} W^{3/2}/d_p$ implies that the maximum velocity increases as the particle diameter decreases, and it diverges as the inverse of the particle diameter for $W/d_p \gg 1$. In contrast, the Beverloo correlation (Beverloo et al. Reference Beverloo, Leniger and Van de Velde1961) is based on the assumption that the particle diameter $d_p$ is not a relevant length scale when it is small compared to the orifice diameter. If the channel width is substituted for the orifice diameter in the Beverloo correlation, then the velocity scaling $(g W)^{1/2}$ is obtained in the limit $W \gg d_p$. The Beverloo scaling is observed in the present study, where smooth frictional walls are used and there is significant slip at the wall. If our results are found to be robust, then they imply that the nature of the wall may not change the scaling for $\delta _{0.95}$, but can change qualitatively the scaling of the velocity and the flow rate.
Another issue that needs to be examined is the ratio of the wall roughness scale and the particle diameter. A standard procedure for generating rough walls is to use frozen spherical particles at the wall, and the wall particle diameter is usually considered equal to that for the flowing particles. In Barker et al. (Reference Barker, Zhu and Sun2022), periodic boundary conditions and a reverse flow were used for generating rough walls. One future avenue of research is to transition from rough to smooth walls by decreasing successively the wall particle diameter relative to the flowing particle diameter, and examining the scaling of the average velocity separately with the flowing and wall particle diameters (Kumaran & Bharathraj Reference Kumaran and Bharathraj2013; Bharathraj & Kumaran Reference Bharathraj and Kumaran2017). This would provide some insight into whether the wall roughness or the flowing particle diameter is the relevant length scale for the shear rate at the wall.
The slip velocity  $u_{slip}$ and $u_{max}-u_{slip}$ are proportional to $\sqrt {W}$, and $\delta _{0.95}$ is proportional to $W$, and the ratio $u_{slip}/({\rm d} u_y/{{\rm d}\kern0.7pt x})$ at the wall is proportional to $W$. Therefore, if the slip boundary condition ${\rm d} u_y/{{\rm d}\kern0.7pt x} = u_{slip}/l_s$ is used at the wall, and the velocity gradient is calculated from (3.1), then the slip length $l_s$ increases proportional to $W$. This is different from earlier studies of Mohan et al. (Reference Mohan, Rao and Nott2002), where the slip length was considered a constant.
The slip velocity defined in Shojaaee et al. (Reference Shojaaee, Brendel, Török and Wolf2012) is the relative velocity at the point of contact between a particle and the wall. The contact velocity of the particle surface includes the translational velocity of the particle centre and the cross-product of the rotation velocity and the vector distance between the point of contact and particle centre. However, in the current study, the slip velocity is assumed to be the velocity of the interval closest to the wall, not the surface velocity of the particle at contact. The particle angular velocity is also reported separately, and it is found that the angular velocity deviates from one half of the vorticity close to the wall.
The normal and shear stress profiles are shown in figure 6. As required by the momentum balance, the normal stress in the cross-stream direction,  $\sigma _{xx}$, is a constant across the channel. This constant value increases significantly as $\bar {\phi }$ increases. The shear stress $\sigma _{xy}$ is close to a linear function of distance from the centre; there is departure from linearity in the shear zone due to the variation in $\phi$. There is very little change in the slope of $\sigma _{xy}$ as $\bar {\phi }$ is changed, because the variation in $\bar {\phi }$ is less than 5 %.

Figure 6. The normal stress  $\sigma _{xx}$ (black, left vertical axis) and shear stress $\sigma _{xy}$ (brown, right vertical axis) in the flow of a granular material in a vertical chute of width $100 \, d_p$. The average volume fractions are $\bar {\phi } = 0.62$ ( $\circ$), $\bar {\phi } = 0.61$ ( $\triangle$), $\bar {\phi } = 0.6$ ( $\nabla$) and $\bar {\phi } = 0.59$ ( $\diamond$). The black vertical lines are boundaries between the plug and the dense shearing zones, the blue vertical lines are the boundaries between dense and loose shearing zones, and the red vertical line is the boundary between the loose shearing zone and the wall shearing zone.
The cross-stream normal stress  $\sigma _{xx}$ is shown as a function of $\bar {\phi }$ for different channel widths $W$ in figure 7(a). There is a significant increase in $\sigma _{xx}$ as $W$ is increased, and as $\bar {\phi }$ is increased. However, the ratio of the normal stress to the channel width, $(\sigma _{xx}/W)$, shown by the brown lines referenced to the right ordinate in figure 7(a), varies very little as $W$ is varied for $W > 60 \, d_p$. This implies that $\sigma _{xx}$ increases approximately proportional to $W$. To put this in perspective, recall that $\sigma _{xy}$ at the wall increases proportional to $W$ if the decrease in $\phi$ close to the wall is neglected from the momentum balance. This is in agreement with the finding of Barker et al. (Reference Barker, Zhu and Sun2022). When both $\sigma _{xx}$ and $\sigma _{xy}$ at the wall are proportional to $W$, the friction coefficient $\mu _{wall}$ at the wall should be independent of $W$. Figure 7(b) shows that this is indeed the case. The wall friction coefficient is independent of $W$, but it decreases as $\bar {\phi }$ increases. The latter trend may be understood by noting that small changes in $\bar {\phi }$ affect $\sigma _{xy}$ less strongly than $\sigma _{xx}$. Thus the value of $\sigma _{xx}$ across the channel is determined from the wall shear stress required to balance the weight of the material per unit area of the wall and the wall friction coefficient that is a function of $\bar {\phi }$ for specific wall and particle properties.

Figure 7. (a) The cross-stream normal stress  $\sigma _{xx}$ as a function of $\bar {\phi }$ is shown by the black lines referenced to the left ordinate, and the ratio $\sigma _{xx}/W$ is shown by the brown lines referenced to the right ordinate. (b) The wall friction coefficient $\mu _{wall}$ as a function of $\bar {\phi }$. The channel widths are $60 \, d_p$ ( $\circ$), $100 \, d_p$ ( $\triangle$), $120 \, d_p$ ( $\nabla$) and $150 \, d_p$ ( $\diamond$).
3.2. Comparison with kinetic models
The volume fraction  $\phi$ as a function of cross-stream distance $x/d_p$ is shown in figure 8(a) for channel width $W = 100 \, d_p$. The region at the centre of the channel is the ‘plug’ zone where $\phi$ is a constant. The boundary of the plug zone is indicated by the black vertical lines for the four different values of $\bar {\phi }$. It is interesting to note that $\phi$ in the plug is ${\sim }0.63$, which is discernibly lower than the random close packing volume fraction $\phi _{rcp} = 0.64$ for a monodisperse system. This indicates that the plug zone is not a jammed assembly of particles, but there is particle agitation even in this plug zone, and the granular temperature $T$ in this region is measurable, as shown in figure 8(c). When $\bar {\phi }$ is decreased, the volume fraction in the plug zone is nearly a constant, but the thickness of the plug zone decreases. At the lowest average volume fraction $\bar {\phi } = 0.59$, the plug zone occupies less than half of the channel width $W$. It should be noted that there is no layering in this region even at $\bar {\phi } = 0.62$. It is also verified that there is no crystallization; the $Q_6$ order parameter (Kumaran Reference Kumaran2009c,Reference Kumarand) in this region is below 0.4.

Figure 8. (a) The volume fraction  $\phi$, (b) the shear rate ${\rm d}u_y/{\rm d}\kern0.7pt x$, (c) the granular temperature $T$, and (d) the rates of shear production of energy (black) and dissipation (red) due to particle interactions for $W = 100 \, d_p$. The average volume fractions are $\bar {\phi } = 0.62$ ( $\circ$), $\bar {\phi } = 0.61$ ( $\triangle$), $\bar {\phi } = 0.6$ ( $\nabla$) and $\bar {\phi } = 0.59$ ( $\diamond$). The black vertical lines are boundaries between the plug and dense shearing zones; the blue vertical lines are boundaries between the dense and loose shearing zones; and the red line is a boundary between the loose and wall shearing zones.
There is a transition from the plug zone to a ‘dense shearing’ zone when  $\phi$ decreases below 0.63 at the black vertical lines in figure 8(a). A change in the slope of $\phi$ is evident at the boundary of the plug and dense shearing zones, and $\phi$ decreases continuously in the dense shearing zone. The blue vertical lines are drawn in figure 8(a) where $\phi = \phi _{ad} = 0.587$, where $\phi _{ad}$ is the volume fraction for arrested dynamics. This is the boundary between the dense and ‘loose shearing’ zones. Very close to the wall, within a distance of about two particle diameters, there is a wall shearing layer with a steep decrease in $\phi$, marked by a red vertical line. The distinctions between the plug and dense shearing zones (marked by black vertical lines) and the loose and wall shearing zones (marked by a red vertical line) are clearer in figure 9, where clear breaks are seen in the profiles of the ratios of the angular velocity to shear rate, and the shear rate to square root of the granular temperature $\sqrt {T}$. For the highest average volume fraction $\bar {\phi } = 0.62$, there appears to be no loose shearing zone as $\phi$ decreases to $\phi _{ad} = 0.587$ in the wall shearing zone. For lower values of $\bar {\phi }$, there is a clear distinction between the dense and loose shearing zones at $\phi = \phi _{ad}$, and the loose and wall shearing zones.

Figure 9. The ratios of (a)  $\varOmega _z$ to $\omega _z$, and (b) $({\rm d} u_y/{{\rm d}\kern0.7pt x})/\sqrt {T}$ versus $x/d_p$, for $W = 100\,d_p$ and $\bar {\phi } = 0.62$ ( $\circ$), $\bar {\phi } = 0.61$ ( $\triangle$), $\bar {\phi } = 0.6$ ( $\nabla$) and $\bar {\phi } = 0.59$ ( $\diamond$).
The velocity profiles shown in figure 4 do not exhibit any perceptible change between the plug and shearing zones. However, the shear rate shown in figure 8(b) exhibits a clear distinction between the dense shearing zone (between the black and blue vertical lines) where there is a monotonic decrease in the shear rate, and the plug zone to the right of the black vertical lines. In the plug zone, the standard deviations in the measurements, shown by the error bars, are comparable to the mean values, indicating that the shear rate is zero to within the simulation accuracy. In contrast, in the dense shearing zone, the error bars are smaller than the mean values, and the profiles are continuous, even when the shear rate is 4–5 orders of magnitude smaller than that at the wall. There is also a small but distinct change in the curvature of the shear rate at the boundary (blue vertical lines) between the dense and loose shearing zones. Whereas the shear rate profiles have negative curvature in the dense shearing zone, they have positive curvature in the loose shearing zone. This change in curvature is significant as it implies a change in the rheology of the flow as  $\phi \rightarrow \phi _{ad}$. From the momentum balance, the shear stress is approximately a linear function of distance from the centre, if we neglect the variations in $\phi$. If the shear rate profile is concave upwards, then the fluid is shear thickening with power-law exponent greater than $1$, whereas if it is concave downwards, then it is shear thinning with power-law exponent less than $1$. Therefore, an inflection point in the shear rate curve at $\phi = \phi _{ad}$ in figure 8(b) implies a transition from shear thickening to shear thinning behaviour. Similarly, the plane shear simulations in Chialvo et al. (Reference Chialvo, Sun and Sundaresan2012) have captured a significant change in rheology, where the flow is quasi-static in the limit of very small shear rate for $\phi > \phi _{ad}$, and inertial for $\phi < \phi _{ad}$, and an intermediate regime is observed for $\phi = \phi _{ad}$.
The granular temperature  $T$ profiles shown in figure 8(c) are continuous all the way from the wall to the centre of the channel. The standard deviation is always much smaller than the mean value, even at the centre where the temperature is more than five orders of magnitude smaller than that at the wall. The non-zero granular temperature indicates that the particles are not jammed, but they do have fluctuating motion. This is consistent with the $\phi$ profile in the plug zone in figure 8(a), where $\phi$ is lower than $\phi _{rcp}$. In the shearing zone, the granular temperature decreases as $\bar {\phi }$ increases. In contrast, in the plug zone, the granular temperature appears independent of $\bar {\phi }$, with the exception of $\bar {\phi } = 0.62$ where the granular temperature is noticeably higher. This could be attributed to the significantly higher normal stress $\sigma _{xx}$ shown in figure 6(a) – this higher normal stress seems to be a consequence of higher agitation of the particles in the plug zone.

Figure 10. The variation of (a)  $\phi$, (b) $u_y$, (c) ${\rm d}u_y/{{\rm d}\kern0.7pt x}$ and (d) $T$, for $k_n = 10^5$ ( $\circ$), $k_n = 10^6$ ( $\triangle$), $k_n = 10^7$ ( $\nabla$) and $k_n = 10^8$ ( $\diamond$), and $\bar {\phi } = 0.61$ (black lines) and $\bar {\phi } = 0.59$ (brown lines). The red line is the boundary between the wall and loose shearing zones; the black and brown vertical lines from left to right are the boundaries between the loose and dense shearing zones, and the dense shearing zone and plug zone, respectively.

Figure 11. (a) The friction coefficient  $\mu = |\sigma _{xy}/\sigma _{xx}|$ as a function of the inertial number $I$, and (b) $0.64 - \phi$ as a function of $I$, for $W = 100 \, d_p$ and $\bar {\phi } = 0.62$ ( $\circ$), $\bar {\phi } = 0.61$ ( $\triangle$), $\bar {\phi } = 0.6$ ( $\nabla$) and $\bar {\phi } = 0.59$ ( $\diamond$). The data in the dense shearing zone are shown in brown lines, the loose shearing zone by black lines and the wall shearing zone by red lines. The dotted blue lines are (B3) and (B4), respectively, and the inclined black dotted line in (b) shows a slope of $1$.
$1$.
The rates of shear energy production (black) and dissipation due to particle interactions (red) are shown in figure 8(d). The energy production rate is significantly higher than the energy dissipation rate in the dense and loose shearing zones. The rates of production and dissipation of energy decrease as  $\bar {\phi }$ is increased, exhibiting the same trend as the granular temperature in the shearing zones. In the plug zone, there is virtually no shear production of energy because the shear rate is zero to within the simulation resolution. However, the rate of dissipation of energy is clearly measurable and approximately a constant in this region. Since there is no shearing in the plug zone, there is no shear production of energy. The temperature in the plug zone is determined from a balance between the rate of conduction of energy and the rate of dissipation due to particle interactions. The dashed lines in figure 8(c) are fits using the conduction equation (B13), with specified values of the temperature and zero flux at the centre. The best fit for the conduction length in these curves is $l_c \approx 11.5\,d_p$. These fits provide good predictions for the temperature in the plug zone, and the temperature profile departs from these fits in the dense shearing zone where there is energy production due to shear.
Two other kinematic measures are shown in figure 9. The particle angular velocity is a non-conserved variable in a fixed coordinate reference frame for the flow of frictional particles. The angular velocity  $\varOmega _z$ scaled by ${\rm d}u_y/{{\rm d}\kern0.7pt x}$ is shown as a function of $x/d_p$ in figure 9(a). For the present unidirectional flow, the vorticity is equal to $\omega _z = {\rm d} u_y/{{\rm d}\kern0.7pt x}$. When the particle rotation rate and the local material rotation rate are the same, the ratio $\varOmega _z/\omega _z$ equals $\frac {1}{2}$. However, $\varOmega _z$ could be very different from half of the vorticity in regions of thickness comparable to the particle diameter at the boundaries of the flow and in a region where the material rotation rate is negligible. In figure 9(a), there is a lot of scatter in the data in the plug zone; this is because the magnitude of the angular velocity and the shear rate are close to the simulation resolution in this region, and small errors in either of these quantities result in large variations in the ratio. However, this ratio is close to $\frac {1}{2}$ in both the dense and loose shearing zones, indicating that the particles are rotating with the same angular velocity as the material in these zones, as expected from the continuum approximation for a material with no microscopic torques. The ratio differs from $\frac {1}{2}$ in the wall shearing zone as well, due to the effect of wall collisions.
The ratio  ${d}_p({\rm d} u_y/{{\rm d}\kern0.7pt x})/\sqrt {T}$ is shown in figure 9(b). This ratio has a behaviour similar to that for the shear rate, but it seems to have a positive slope at the wall, in contrast to the shear rate, which has a negative slope at the wall. This indicates that the rheology in the wall shearing zone is different from that in the loose shearing zone, and a continuum approximation may be difficult to formulate for this region as it extends over a distance equal to only two particle diameters. This ratio is continuous across the loose and dense shearing zones, though it is shown later, in figure 13, that the dependence on $\phi$ is very different.
The effect of particle stiffness  $k_n$ on the volume fraction $\phi$, velocity $u_y$, shear rate ${\rm d}u_y/{{\rm d}\kern0.7pt x}$ and temperature $T$ are shown in figure 10 for channel width $W = 100 \, d_p$ and for two different average volume fractions $\bar {\phi }=0.61$ and $0.59$. In all cases, $\phi$ and $u_y$ in figures 10(a) and 10(b) are independent of $k_n$ for $k_n \geq 10^5$, except for one case corresponding to variation of $\phi$ with $x/d_p$ for $k_n = 10^5$ and $\bar {\phi } = 0.59$. The profiles of ${\rm d}u_y/{{\rm d}\kern0.7pt x}$ and $T$ in figures 10(c) and 10(d) suggest a more complicated picture. These are independent of $k_n$ in the wall and loose shearing zones for $\phi < \phi _{ad} = 0.587$. However, there is some dependence of ${\rm d}u_y/{{\rm d}\kern0.7pt x}$ on $k_n$, and an even stronger dependence of $T$ on $k_n$ in the dense shearing and plug zones. Here, $T$ in the plug zone decreases as $k_n$ increases, and it appears to depend only on $k_n$ and not on $\bar {\phi }$ in this region. This is expected because $\phi$ in this region is approximately 0.63 for all $\bar {\phi }$, and there is no shearing in this region. There are enduring contacts between particles, and the divergence of the shear stress is balanced by the gravitational force density due to the contacts. The monotonic decrease of $T$ with $k_n$ suggests that $T$ will decrease to zero in the hard-particle limit, and the plug zone will be in a jammed state. When $k_n$ is finite, there is agitation within the plug zone resulting in a non-zero temperature. As $T$ in the dense shearing zone also depends on $k_n$, the dense shearing zone cannot be described using hard-particle models. However, in the loose shearing zone and the wall shearing zone, the shear rate and granular temperature are independent of the particle stiffness, hence these zones can be described using the hard-particle models.
The friction coefficient  $\mu = \sigma _{xy}/\sigma _{xx}$ is shown as a function of the dimensionless ‘inertial number’ $I = d_p |{\rm d} u_y/{{\rm d}\kern0.7pt x}|/\sqrt {\sigma _{xx}/\rho _p}$ in figure 11(a). In this figure, $\mu$ in the dense shearing zone is shown by the brown lines, the loose shearing zone by the black lines and the wall shearing zone by the red lines. A log scale is used on the horizontal axis, in order to highlight features that are not visible readily in a linear scale. For $\bar {\phi } = 0.62$, $\mu$ is lower than for $0.59 \leq \bar {\phi } \leq 0.61$. For the latter, $\mu$ approaches a finite value for the lowest values of $I$ discernible in the dense shearing zone. It scales approximately as a linear function of $\log (I)$ as $I$ becomes small, and is independent of $\bar {\phi }$ for $I \lesssim 10^{-3}$ in the dense shearing zone. However, it exhibits a definite dependence on $\bar {\phi }$ for $I \gtrsim 10^{-3}$ in the loose shearing zone and the wall shearing zone. The qualitative behaviour of the $\mu$– $I$ curves is the same for other channel widths, and is not shown. The inertial number varies over a large range ( $O(10^{-5})\unicode{x2013}O(10^0)$) from the centre to the wall in the flow through a vertical channel, and the linear relation between $\mu$ and $I$ does not apply to the whole domain, in contrast to the assumption of Barker et al. (Reference Barker, Zhu and Sun2022).
The scaling of  $\phi$ with $I$, shown in figure 11(b), also reveals interesting features. Instead of plotting $\phi$ itself, which results in a rather featureless graph, we have shown the difference between $\phi _{rcp} = 0.64$ and $\phi$. It depends only on $I$ in the loose shearing zone for $\phi < \phi _{ad} = 0.587$, and depends on I and $\bar{\phi}$ in the dense shearing zone for $\phi \geq \phi _{ad}$. A clear break in the slope of the graph is visible at $\phi = \phi _{ad}$, which is the boundary between the dense and loose shearing zones. The slope of the $\phi$– $I$ curves is larger in the loose shearing zone in comparison to the dense shearing zone.

Figure 12. The variation of  $-\log (\phi )$ with $x/d_p$ for $W = 100 \, d_p$ (solid lines) and $W = 150 \, d_p$ (dashed lines), and $\bar {\phi } = 0.62$ ( $\circ$), $\bar {\phi } = 0.61$ ( $\triangle$), $\bar {\phi } = 0.6$ ( $\nabla$) and $\bar {\phi } = 0.59$ ( $\diamond$).
The dotted blue lines in figures 11(a) and 11(b) are the predictions of (B3) and (B4), with the parameters  $\mu _s = 0.384$, $\mu _\infty = 0.625$, $I_0 = 0.3$, $\phi _{min}=0.4$ and $\phi _{max} = 0.6$ reported in Jop (Reference Jop2015). It is evident that there is a quantitative difference between the simulation results and the parameters commonly used in the $\mu$– $I$ models. More importantly, there is a difference in the shape of the curves, which is not captured adequately when drawn on a linear axis. The simulation results for $\mu$ exhibit a slow logarithmic dependence on $I$ for the lowest values accessible in the dense shearing zone, in contrast to the constant value predicted by the $\mu$– $I$ model. Similarly, the volume fraction $\phi$ in the dense shearing zone increases to 0.63 in the limit of low $I$, but (B4) predicts a constant value of 0.6 in the limit $I \rightarrow 0$. The decrease in the volume fraction below $\phi _{ad}$ in the loose shearing zone is captured reasonably by (B4).

Figure 13. Plots of (a)  $\sigma _{xx}/T$, (b) $\sigma _{xy}/(|{\rm d} u_y/{{\rm d}\kern0.7pt x}|\,T^{1/2})$ and (c) $D/T^{3/2}$ as functions of $(0.64 - \phi )$ for $\bar {\phi } = 0.62$ ( $\circ$), $\bar {\phi } = 0.61$ ( $\triangle$), $\bar {\phi } = 0.6$ ( $\nabla$) and $\bar {\phi } = 0.59$ ( $\diamond$), and $W = 100 \, d_p$. The data in the dense shearing zone are shown in black, in the loose shearing zone in brown and in the wall shearing zone in red. The blue circles, from left to right, are the results for the flow down an inclined plane for angles of inclination $20^\circ \unicode{x2013}24^\circ$. The blue dotted lines fit to the data diverging at $\phi = \phi _{ad} = 0.59 \pm 0.002$.
The comparison of our data with that of Barker et al. (Reference Barker, Zhu and Sun2022) should be made with care, because the results of the latter are equivalent to the flow through a vertical channel with purely rough walls that enforce a no-slip boundary condition. The wall shearing zone observed in the current study for the flat frictional walls may not be present if the walls are rough. Additionally, the linear approximations used in Barker et al. (Reference Barker, Zhu and Sun2022) to obtain an analytical solution may not be valid in the whole domain. For example, the linear relation between  $\mu$ and $I$ is not valid in the loose and wall shearing zones where $\phi < \phi _{ad}$, and the linear relation between $\phi$ and $I$ does not capture the dense shearing zone where $\phi \geq \phi _{ad}$. Barker et al. (Reference Barker, Zhu and Sun2022) obtained an exponential variation of $\phi$ with the distance from the wall in their analytical solution. However, a clear linear variation is not observed in the shearing zone when $\log (\phi )$ is plotted as a function of $x/d_p$, even if the first two or three points in the wall shearing zone are excluded, as shown in figure 12. The velocity profile obtained in the analytical solution is the combination of a linear function and an exponential function in Barker et al. (Reference Barker, Zhu and Sun2022); it does not fit our data as well as the exponential function (3.1) (see figure 4b). Hence the fits of the functional forms for the volume fraction and velocity profiles are not shown here. In Debnath et al. (Reference Debnath, Kumaran and Rao2022), the nonlinear expression (B3) for $\mu (I)$ was used to solve the models of Barker et al. (Reference Barker, Schaeffer, Shearer and Gray2017) and Schaeffer et al. (Reference Schaeffer, Barker, Tsuji, Gremaud, Shearer and Gray2019) numerically. However, this does not result in better agreement between the DEM results and the model predictions for $\mu (I)$ and $\phi (I)$.
Figure 13 shows different quantities of interest in the kinetic-theory-based models as a function of the volume fraction  $\phi$. Here, the focus is on $\phi$ near $\phi _{rcp} = 0.64$, so the data are plotted as a function of $0.64 - \phi$ on a log-log scale. In this figure, the values in the dense shearing zones are shown by the black lines, the loose shearing zones by the brown lines, and the wall shearing zones by the red lines. The constitutive relations (B8), (B9) and (B10) are examined in figures 13(a), 13(b) and 13(c), respectively. If these constitutive relations are valid, then the functions $p_\phi = \sigma _{xx}/T$ in figure 13(a), $\mu _\phi = \sigma _{xy}/T^{1/2} ({\rm d} u_y/{{\rm d}\kern0.7pt x})$ in figure 13(b), and $D_\phi = D / T^{3/2}$ in figure 13(c) should depend only on the volume fraction $\phi$. In all cases, it is observed that the dependence of these quantities is different in the dense shearing zone in comparison to the loose shearing zone. There is significant scatter in the dense shearing zone; however, there is less scatter in the loose shearing zone, and the quantities are approximately functions of $\phi$ only in this zone. This indicates that the kinetic-theory-based models, which assume that these quantities depend only on $\phi$, do not apply in the dense shearing zone for $\phi \geq \phi _{ad}$, but they do seem to apply in the loose shearing zone for $\phi < \phi _{ad}$. This supports the conclusion that the flow in the loose shearing zone with $\phi$ less than $\phi _{ad} = 0.587$ can be described by a hard-particle model, and it cannot be used for the dense shearing zone.
The blue circles in figure 13 are the results for the dense granular flow down an inclined plane with a free surface. As explained in the Introduction, the highest volume fraction that can be attained in this unconfined flow is around  $\phi = \phi _{ad}$. The volume fraction $\phi$ is a constant in the bulk due to the momentum conservation condition, and it has been found that the quantities in figure 13 depend only on $\phi$. The flow is stable for a relatively small range of angles of inclination, from about $20^\circ$ to about $24^\circ$. The results for this range of angles, separated by $1^\circ$ intervals, are shown by the five blue dots in each panel of figure 13. The results for the inclined plane flows are in agreement with the results for the loose shearing zone for $\phi < \phi _{ad}$, indicating that the dynamics in the loose shearing zone is the same as that in a dense granular flow down an inclined plane.
The coefficients  $p_{\phi }$, $\mu _{\phi }$ and $D_{\phi }$ for an inclined plane flow shown by the blue circles in figure 13 diverge at $\phi = \phi _{ad}$ of about $0.585 \pm 0.005$. The value $\phi _{ad} = 0.587$ used in the current study to mark the boundary between dense and loose shearing zones is slightly lower, by less than 1 %, than the value $0.592$ obtained by an extrapolation of the hard-particle simulations (Kumaran Reference Kumaran2009c). In figure 13, the divergence, shown by blue dotted curves proportional to $\chi = (\phi _{ad}-\phi )^{-1}$, provides the best fit for the loose shearing zone at $\phi _{ad} = 0.59 \pm 0.002$; the agreement is quite good for $p_\phi$ and $\mu _\phi$, but not as good for $D_\phi$. However, it is clear that the divergences in the stresses and the dissipation rate occur at nearly the same volume fraction $\phi = \phi _{ad}$ for the inclined plane flow and the loose shearing zone. For the inclined plane flow that is unconfined, the divergence in these functions, $p_\phi, \mu _\phi$ and $D_\phi$, leads to flow cessation. For the flow in the vertical channel, as $\phi$ increases beyond $\phi _{ad}$, the divergence in these functions is cut off by a cross-over to the dense shearing zone, where the hard-particle model does not apply.
The results for  $p_\phi$, $\mu _\phi$ and $D_\phi$ are compared with the model of Berzi et al. (Reference Berzi, Jenkins and Richard2020) in figure 14. The qualitative trends of these functions are captured in the loose shearing zone and the dense shearing zone; however, the quantitative differences are evident. The order of magnitude differs in some cases. Their model underestimates the coefficients in the loose shearing zone for $\phi < \phi _{ad} = 0.587$, though the slopes of the curves are approximately the same. There is less disagreement in the dense shearing zone except for $D_{\phi }$. The quantitative difference could be because the functions of Berzi et al. (Reference Berzi, Jenkins and Richard2020) were fitted for plane shear simulation and an inclined plane flow in Berzi & Jenkins (Reference Berzi and Jenkins2015), and not for a vertical chute. Another issue related to the conduction flux in their model is the following. In the channel flow, if the conduction flux at the interface where $\phi _{ad} = 0.587$ has to be matched, then the slope of the $\phi$ profile appears to be discontinuous, which does not agree with the trend predicted by the DEM results (Debnath et al. Reference Debnath, Kumaran and Rao2022). More work is required to resolve these issues.

Figure 14. A comparison of the model of Berzi et al. (Reference Berzi, Jenkins and Richard2020) (red lines) and the results of the present simulations (black lines) for the functions (a)  $\sigma _{xx}/T$, (b) $\sigma _{xy}/(|{\rm d} u_y/{{\rm d}\kern0.7pt x}|\,T^{1/2})$ and (c) $(D/T^{3/2})$, as functions of $0.64 - \phi$ for $\bar {\phi } = 0.61$ ( $\triangle$) and $\bar {\phi } = 0.59$ ( $\diamond$), and $W = 100 \, d_p$.
4. Conclusions
One of the simplest granular flows that could be envisaged is the flow in a vertical rectangular channel bounded by walls in one direction and with periodic boundary conditions in the other two directions. Even this flow exhibits complex structure–rheology relationships. Previous studies have classified the flow broadly into a plug zone at the centre and a shearing zone near the wall.
The important conclusions of the present study are as follows.
(i) The flow is studied for different channel widths $W=60\unicode{x2013}150\,d_p$. There is a steady flow for a relatively small range of the average volume fractions $\bar {\phi }$, from about $0.62$ to $0.59$ for $W \geq 100 \,d_p$. The material is static for $\bar {\phi } > 0.62$, and there is no steady state for $\bar {\phi } < 0.59$.
(ii) The velocity profile exhibits significant slip at the wall. Both the slip velocity
$u_{slip}$ and the maximum velocity $u_{max}$ are proportional to $\sqrt {W}$ for $W \geq 100 \,d_p$. The ratio of the maximum and slip velocities, $u_{max}/u_{slip}$, is found to be nearly a constant in the range 1.38–1.4 for the entire range of channel widths and average volume fractions.(iii) The width of the shear layer,
$\delta _{0.95}$, is defined as the distance from the wall at which $u_y - u_{slip}$ is 95 % of its maximum value. A specific exponential form, (3.1), is found to provide an excellent fit for all of the profiles for different values of $W$ and $\bar {\phi }$. The width $\delta _{0.95}$ varies with $\bar {\phi }$, and it increases proportional to $W$ for $W \geq 100 \,d_p$.(iv) The scaling of the velocity and boundary layer thickness with
$W$ does not seem to apply for the smallest width $W = 60 \,d_p$. The breakdown of universality at $W = 60\, d_p$ is likely due to the finite-size effects. If the ratio of the width and particle diameter is not sufficiently large, there are two length scales, the particle diameter and the channel width, hence properties may not depend only on the channel width.(v) A detailed analysis of the flow dynamics reveals the presence of multiple zones. In the ‘plug’ zone at the centre of the channel, the volume fraction
$\phi$ has a constant value 0.63. The velocity is a constant and the shear rate is zero in this region, to within the simulation accuracy. However, the granular temperature is non-zero, though it could be 4–5 orders of magnitude smaller than that at the wall.(vi) In the plug zone, the granular temperature decreases as the particle stiffness increases. This suggests that the system could be jammed in the limit of infinite stiffness, and a hard-particle approximation cannot be used to describe this region, subject to the following caveats.
(vii) Adjacent to the plug zone is a ‘dense shearing’ zone, where the particle volume fraction exceeds
$\phi _{ad}$. Here, the shear rate and granular temperature are 3–4 orders of magnitude smaller than the values at the wall. However, the shear rate and the granular temperature are both finite and measurable, and the rate of production of energy due to shear exceeds the rate of dissipation due to particle interactions. The particle angular velocity in this region is equal to half of the vorticity, indicating that the particle and material rotation rates are equal. The shear rate and granular temperature in this region depend on the stiffness of the particles.(viii) In the loose shearing zone between the dense and wall shearing zones, the volume fraction
$\phi$ is below $\phi _{ad}$. The shear rate and the granular temperature in this region are independent of the particle stiffness, indicating that the hard-particle models can be used to describe the flow dynamics in this region. It is found that (B8) and (B9) for the stresses, and (B10) for the energy dissipation rate, formulated from the kinetic-theory-based models, are applicable in the loose shearing zone. The values of the coefficients in these constitutive relations are in agreement with those obtained from studies on the granular flow down an inclined plane.(ix) The coefficients
$p_\phi$, $\mu _\phi$ and $D_\phi$ in (B8)–(B10) initially diverge as the volume fraction $\phi$ is increased beyond $\phi _{ad}$ in a manner similar to the values for the flow down an inclined plane. However, a transition to the dense shearing zone cuts off this divergence in the vertical channel flow. These functions are in qualitative agreement with those proposed by Berzi et al. (Reference Berzi, Jenkins and Richard2020), though there are quantitative differences, possibly because the functions of Berzi et al. (Reference Berzi, Jenkins and Richard2020) were formulated for an inclined plane flow.(x) The simulation results are compared with the predictions of the
$\mu$–$I$ model, which relates the friction coefficient $\mu = |\sigma _{xy}/\sigma _{xx}|$ to the inertial number $I$ by (B3), and the volume fraction to $I$ by (B4). The model predictions are different qualitatively from the simulation results in the limit of low $I$. Whereas (B3) predicts that $\mu$ approaches a constant value for $I \rightarrow 0$, the simulation results in figure 11 show a logarithmic decrease down to the lowest value of $I$ accessible in the dense shearing zone. The friction coefficient can be approximated as a function of $I$ in the dense shearing zone, but it varies with the average volume fraction also in the loose shearing zone. The volume fraction $\phi$ is quite well predicted by (B4) in the loose shearing zone, but there is a difference between the model prediction and the simulation results in the dense shearing zone.


Acknowledgements
We are grateful to the Supercomputer Education and Research Centre (SERC), IISc for providing computational support under National Supercomputer Mission (NSM) and the referees for their very helpful comments on the paper.
Funding
This work was supported by funding from the MHRD and the Science and Engineering Research Board, Government of India (grant nos CRG/2018/002673 and SR/S2/JCB-31/2006).
Declaration of interests
The authors report no conflict of interest.
Author contributions
The problem was formulated by V.K. and B.D., the simulations were carried out by B.D., the analysis and conclusions were formulated by V.K. and B.D., and K.K.R. participated in discussions and provided suggestions on the interpretation of results and the manuscript.
Appendix A. The discrete element model and parameters
The simulations are performed using the discrete element method (DEM) proposed by Cundall & Strack (Reference Cundall and Strack1979), and are carried out using the open source LAMMPS package (Plimpton Reference Plimpton1995). In the DEM, particles are characterized as soft and deformable. They can overlap during collisions, and the extent of overlap determines the contact force. Integrating Newton's second law, the kinematics of each particle is computed. The particle–particle and particle–wall interactions are modelled using the linear and Hertzian spring–dashpot models.
Consider the interaction between two spherical particles  $i$ and $j$, centred at $\boldsymbol {x}_i$ and $\boldsymbol {x}_j$, with diameter $d_p$, velocities $\boldsymbol {v}_i$ and $\boldsymbol {v}_j$, and angular velocities $\boldsymbol {\varOmega }_i$ and $\boldsymbol {\varOmega }_j$. The interparticle force is non-zero only when the particles overlap, that is, when the distance between centres is less than the sum of radii, $|\boldsymbol {x}_{ij}| < d_p$. Here, $|\boldsymbol {x}_{ij}| = |\boldsymbol {x}_j - \boldsymbol {x}_i|$ is the distance between the centres of the particles. The contact forces are defined in terms of overlap $\delta _{ij} = d_p - |\boldsymbol {x}_{ij}|$, and the relative velocity of the surface of $i$ with respect to $j$ at the point of contact, $\boldsymbol {v}_{ij} = \boldsymbol {v}_i - \boldsymbol {v}_j + (d_p/2)(\boldsymbol {\varOmega }_i + \boldsymbol {\varOmega }_j) \times \boldsymbol {n}_{ij}$, where $\boldsymbol {n}_{ij} = \boldsymbol {x}_{ij}/|\boldsymbol {x}_{ij}|$ is the unit vector along the line joining the centres of $i$ and $j$. The normal $\boldsymbol {F}^n_{ij}$ and tangential $\boldsymbol {F}^t_{ij}$ components of the contact force exerted by $j$ on $i$ are given by
 \begin{align} \boldsymbol{F}^n_{ij} &= \left(\frac{\delta_{ij}}{d_p} \right)^a \left( - k_n \delta_{ij} {\boldsymbol{n}}_{ij} - m_{eff} \xi_n \boldsymbol{v}^n_{ij} \right), \end{align}
 \begin{align}
\boldsymbol{F}^t_{ij} &=
\left(\dfrac{\delta_{ij}}{d_p} \right)^a \left( - k_t\, \Delta
{\boldsymbol{x}}^t_{ij} - m_{eff} \xi_t
{\boldsymbol{v}}^t_{ij} \right)\quad \text{for} \
|{\boldsymbol{F}}^t_{ij}|/|{\boldsymbol{F}}^n_{ij}| < \mu_p,\notag\\ &={-} \mu_p\,|{\boldsymbol{F}}^n_{ij}| \left(\Delta
{\boldsymbol{x}}^t_{ij}/|\Delta {\boldsymbol{x}}^t_{ij}|
\right)
\text{otherwise},
\end{align}
\begin{align}
\boldsymbol{F}^t_{ij} &=
\left(\dfrac{\delta_{ij}}{d_p} \right)^a \left( - k_t\, \Delta
{\boldsymbol{x}}^t_{ij} - m_{eff} \xi_t
{\boldsymbol{v}}^t_{ij} \right)\quad \text{for} \
|{\boldsymbol{F}}^t_{ij}|/|{\boldsymbol{F}}^n_{ij}| < \mu_p,\notag\\ &={-} \mu_p\,|{\boldsymbol{F}}^n_{ij}| \left(\Delta
{\boldsymbol{x}}^t_{ij}/|\Delta {\boldsymbol{x}}^t_{ij}|
\right)
\text{otherwise},
\end{align}
where  $a$ is 0 for the linear model and $\frac {1}{2}$ for the Hertzian model, $k_n,k_t$ are spring constants, $\xi _n,\xi _t$ are damping constants, $m_{eff} = m_i m_j/(m_i+m_j)$ is reduced mass, $\mu _p$ is the interparticle coefficient of friction, and the normal and tangential relative velocities at the point of contact are $\boldsymbol {v}^n_{ij} = (\boldsymbol {v}_{ij}\boldsymbol {\cdot }\boldsymbol {n}_{ij}) \boldsymbol {n}_{ij}$, $\boldsymbol {v}^t_{ij} = \boldsymbol {v}_{ij}-\boldsymbol {v}^n_{ij}$. The tangential relative displacement $\Delta \boldsymbol {x}^t_{ij}$ is determined as (Silbert et al. Reference Silbert, Ertas, Grest, Halsey, Levine and Plimpton2001)
 \begin{equation} \frac{{\rm d} (\Delta {\boldsymbol{x}}^t_{ij})}{{\rm d}t} = {\boldsymbol{v}}^t_{ij} - \frac{(\Delta {\boldsymbol{x}}^t_{ij} \boldsymbol{\cdot}{\boldsymbol{v}}_{ij} )\, {\boldsymbol{x}}_{ij}}{|{\boldsymbol{x}}_{ij}|^2}. \end{equation}
Here, simulations are performed using the linear spring–dashpot model with friction. The density, length and time dimensions are non-dimensionalized by particle density  $\rho _p$, particle diameter $d_p$ and $\sqrt {d_p/g}$, respectively, where $g$ is the gravitational acceleration. The dimensionless value of the spring constant is $O(10^{10})$ for real glass bead type particles of size $100\ \mathrm {\mu } {\rm m}$ to 1 mm. As the computational time step is proportional to $k_n^{-1/2}$, a large value of $k_n$ makes the simulations computationally expensive. Hence the value of $k_n$ is chosen in the range $10^5\unicode{x2013}10^8$, and $k_t$ is set to $\frac {2}{7} k_n$ (Debnath, Rao & Nott Reference Debnath, Rao and Nott2017). The damping coefficient $\xi _n$ is chosen so that normal coefficient of restitution for the interaction between two particles, $e_n = \exp (-\xi _n t_c/2)$, is set equal to $0.82$. Here, $t_c = {\rm \pi}/\sqrt {k_n/m_{eff} - \xi _n^2/4}$ is the collision time in the linear model (Silbert et al. Reference Silbert, Ertas, Grest, Halsey, Levine and Plimpton2001). The value of the damping coefficient $\xi _t$ is set to $\frac {1}{2} \xi _n$. The coefficient of friction $\mu _p$ is chosen as 0.5, which is within the range of the friction coefficient for common granular materials. Lower values of the friction coefficient were reported in the range 0.1–0.25 for collisions between glass spheres in Foerster et al. (Reference Foerster, Louge, Chang and Allia1994). The coefficient of sliding friction was extracted from experiments in Foerster et al. (Reference Foerster, Louge, Chang and Allia1994) involving the collision of two particles. The relative velocity just before impact is about $1\ {\rm m}\ {\rm s}^{-1}$. It is not clear whether such large relative velocities occur in the dense assemblies considered here. For a coefficient of friction less than 0.25, the dissipation in particle interactions was sufficiently small that there was no steady flow. Therefore, we have used a higher value of 0.5, in agreement with experimental results reported in Ananda et al. (Reference Ananda, Moka and Nott2008) and Rao & Nott (Reference Rao and Nott2008). The restitution and friction coefficients for particle–wall collisions are the same as those for particle–particle collisions. The simulation time step is set to $1.2\times 10^{-4} \sqrt {d_p/g}$ for $k_n = 10^6$ and $\xi _n = 180$. Unless specified, all the results correspond to $k_n = 10^6$.
The rolling friction torque has not been included in the present work. Shojaaee et al. (Reference Shojaaee, Brendel, Török and Wolf2012) studied the effect of rolling friction on the shear flow in a Couette geometry. They found that there is no internal shearing when the rolling friction coefficient is small. They concluded that the effect of rolling friction is similar to that of a rough wall, where particles are glued on to the wall. However, rough walls are not considered in the present analysis. Similar conclusions have been reported by Zhou et al. (Reference Zhou, Wright, Yang, Xu and Yu1999), that the rolling friction has a significant effect on the angle of repose in the formation of a static pile. The current study considers a continuous flow through a vertical channel, and the effect of rolling friction on flow problems remains an open issue.
The work of Fleischmann et al. (Reference Fleischmann, Serban, Negrut and Jayakumar2016) points out the importance of storing the history of the tangential displacement of the contacts for determining the tangential contact force. Here, we have included the history of the tangential displacement during a contact, as shown in (A3).
Appendix B. Theoretical considerations
For steady fully developed unidirectional flow, the flow properties depend only on the  $x$ coordinate perpendicular to the walls. The momentum balance equations in the $x$ and $y$ directions are
 $$\begin{gather} \frac{{\rm d} \sigma_{xx}}{{\rm d}\kern0.7pt x} = 0, \end{gather}$$
 $$\begin{gather}- \frac{{\rm d} \sigma_{xy}}{{\rm d}\kern0.7pt x} + \rho g = 0, \end{gather}$$
where  $\rho = \rho _p \,\phi$ is the bulk density, $\rho _p$ is intrinsic particle density, and $\phi$ is the local volume fraction. The stresses in (B1) and (B2) are defined to be positive if they are compressive. If the volume fraction is approximately constant across the channel, then (B2) indicates that the shear stress increases linearly from the centre to the wall. From (B1), the normal stress $\sigma _{xx}$ is independent of cross-stream position. However, the criterion for determining $\sigma _{xx}$ is not clear a priori in the present geometry.
In the classical frictional theory, the material yields when the friction coefficient  $\mu = |\sigma _{xy}/\sigma _{xx}|$ exceeds a threshold $\mu _c$. For the flow in a vertical channel, the shear stress increases monotonically from the centre to the wall. Therefore, the material would flow in the zone adjacent to the wall where $\mu > \mu _c$. The velocity profile cannot be determined from a yield criterion. In continuum models based on the modifications of the yield criterion, the constitutive relation is expressed as a relation between the friction coefficient $\mu = |\sigma _{xy}/\sigma _{xx}|$ and the inertial number $I = d_p (|{\rm d} u_y/{{\rm d}\kern0.7pt x}| / \sqrt {\sigma _{xx}/\rho _p}$. Here, $d_p$ and $\rho _p$ are the particle diameter and the mass density, respectively. In the ‘ $\mu (I) - \phi(I)$ rheology’ Pouliquen, Forterre & Le Dizes (Reference Pouliquen, Forterre and Le Dizes2001), the friction coefficient $\mu$ and the volume fraction $\phi$ are related to the inertial number $I$ as
 $$\begin{gather} \mu(I) = \mu_s + \frac{\mu_\infty - \mu_s}{1 + (I_0/I)}, \end{gather}$$
 $$\begin{gather}\phi(I) = \phi_{max} - (\phi_{max}-\phi_{min}) I, \end{gather}$$
where  $\mu _s$ and $\mu _\infty$ are the friction coefficients for $I \rightarrow 0$ and $I \rightarrow \infty$, respectively, $I_0$ is a material parameter, and $\phi _{max}$ and $\phi _{min}$ are the maximum and minimum values of $\phi$ for the $\mu$– $I$ model. More complicated forms for the functions $\mu (I)$ have been proposed, but all of these asymptote to a constant value in the limit of small $I$, and a higher constant value for large $I$. The relation (B4) is a simple linear relation that can be used for only small values of $I$ and for $\phi _{min} \leq \phi \leq \phi _{max}$.
The simulation results are also compared with ‘hard-particle’ models for dense granular flows that have been applied specifically to flows down an inclined plane. Here, the particles are considered sufficiently hard that the time of an interaction is much smaller than on any other time scale. If the rheology is local, then the only relevant time scale is the inverse of the local shear rate. From dimensional analysis, it follows that all components of the stress tensor are proportional to the square of the shear rate for a steady unidirectional flow. The relevant stresses in the present case are
 $$\begin{gather} \sigma_{xx} = B_{xx} \left( \frac{{\rm d} u_y}{{\rm d}\kern0.7pt x} \right)^2, \end{gather}$$
 $$\begin{gather}\sigma_{xy} = B_{xy} \left( \frac{{\rm d} u_y}{{\rm d}\kern0.7pt x} \right)^2, \end{gather}$$
where  $B_{xx}$ and $B_{xy}$ are called the Bagnold coefficients, which depend only on the local volume fraction. The Bagnold relations are found to be applicable for dense granular flows down an inclined plane in the bulk away from boundaries, even for very dense flows with $\phi$ in the range 0.55–0.58. In the case of an inclined plane flow, the ratio of the shear and normal stresses is equal to $\tan (\theta )$, where $\theta$ is the angle of inclination of the plane from horizontal. Therefore, the ratio $B_{xy}/B_{xx}$ is independent of height. If the Bagnold coefficients $B_{xy}$ and $B_{xx}$ are functions of $\phi$, then this implies that $\phi$ is independent of height. Indeed, in simulations, it is observed that $\phi$ is a constant in the bulk to within the simulation accuracy (Silbert et al. Reference Silbert, Ertas, Grest, Halsey, Levine and Plimpton2001). Due to this, it is possible to obtain dynamical properties as a function of $\phi$ by changing $\theta$ in a steady flow.
A more detailed analysis involves the definition of the ‘granular temperature’ (Lun et al. Reference Lun, Savage, Jeffrey and Chepurniy1984; Jenkins & Richman Reference Jenkins and Richman1985; Kumaran Reference Kumaran1998, Reference Kumaran2008), which is the mean square of the fluctuating velocities and angular velocities defined in (2.3). For a unidirectional flow, the energy balance equation for the granular temperature at steady state is
 \begin{equation} \frac{{\rm d}}{{\rm d}\kern0.7pt x} \left( k\,\frac{{\rm d} T}{{\rm d}\kern0.7pt x} \right) - \sigma_{xy}\, \frac{{\rm d} u_y}{{\rm d}\kern0.7pt x} - D = 0, \end{equation}
where  $k$ is the thermal conductivity, and $D$ is the rate of dissipation of energy due to particle interactions per unit volume defined in (B10). On the left-hand side of (B7), the first term is the rate of conduction of energy, and the second term is the rate of production of energy due to shear. The models for the shear and normal stress, the thermal conductivity and the dissipation rate are based on kinetic theory for dense gases:
 $$\begin{gather} \sigma_{xx} = {p_\phi T}, \end{gather}$$
 $$\begin{gather}\sigma_{xy} ={-} {\mu_\phi T^{1/2}}\,\frac{{\rm d} u_y}{{\rm d}\kern0.7pt x}, \end{gather}$$
 $$\begin{gather}D = {D_\phi T^{3/2}}, \end{gather}$$
 $$\begin{gather}k = {k_\phi T^{1/2}}, \end{gather}$$
where the coefficients  $p_\phi$, $\mu _\phi$, $D_\phi$ and $k_\phi$ are dimensionless functions of $\phi$ and are independent of the shear rate or the granular temperature.
Due to the rate of dissipation of energy in (B7), energy is not a conserved variable, and continuous shear production of energy is necessary to sustain the particle agitation in the flow. The ratio of the rates of conduction and dissipation of energy in (B7) scale as  $(k_\phi /D_\phi ) (d_p^2/L^2)$, where $L$ is the system size. The conduction length $l_c$ is defined as $d_p \sqrt {k_\phi /D_\phi }$. If the system size $L$ is smaller than $l_c$, then the rate of conduction of energy is much larger than the rate of dissipation, and energy can be treated as a conserved variable. For $L \gg l_c$, the rate of conduction of energy can be neglected in the bulk, and the granular temperature is determined from a local balance between the rates of shear production and dissipation. Conduction is important in regions of thickness $l_c$ at the boundaries. For a collisional flow of nearly elastic particles, the conduction length $l_c$ scales as $d_p / \sqrt {1-e^2}$, where $e$ is the coefficient of restitution. For inelastic and frictional particles, the conduction length is comparable to the particle diameter. Thus the conduction length is the microscopic length scale in kinetic models for granular flows, analogous to the lengths postulated in non-local continuum theories.
There is no shear production of energy in the plug zone where the shear rate is zero, but there could be agitation of the particles. If the shear production is neglected in (B7), and (B10) and (B11) are used, then the energy balance equation is
 \begin{equation} \frac{{\rm d}}{{\rm d}\kern0.7pt x} \left( \frac{k_\phi T^{1/2}}{d_p^2}\,\frac{{\rm d} T}{{\rm d}\kern0.7pt x} \right) - \frac{D_\phi T^{3/2}}{d_p^4} = 0. \end{equation}
 If  $\phi$ in the plug zone is a constant, then $D_\phi$ and $k_\phi$ are constants, and (B12) can be solved as
 \begin{equation} \frac{{\rm d}^2 T^{3/2}}{{\rm d}\kern0.7pt x^2} - \frac{T^{3/2}}{l_c^2} = 0, \end{equation}
where  $l_c = (2 d_p^2 k_\phi / 3 D_\phi )^{1/2}$.


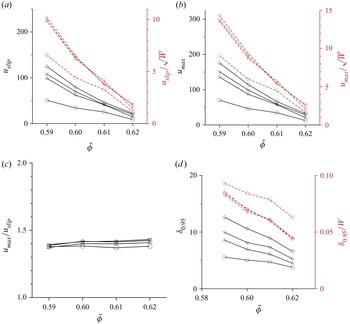


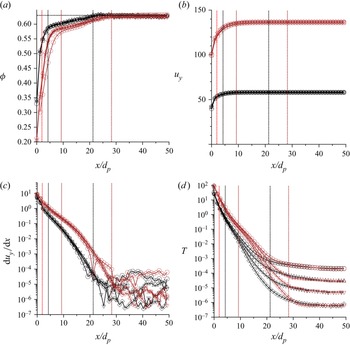


 Open access