


For years, scholars have predicted that widespread adoption of new software tools will trigger a paradigm shift in archaeological practice (Huggett Reference Huggett2015; Roosevelt et al. Reference Roosevelt, Cobb, Moss, Olson and Ünlüsoy2015; Schmidt and Marwick Reference Schmidt and Marwick2020). One example comes from Roosevelt and colleagues' (Reference Roosevelt, Cobb, Moss, Olson and Ünlüsoy2015) “Excavation is Destruction Digitization,” which describes the process of applying a “born digital” approach to document an excavation in detail. Roosevelt and colleagues argue that born digital documentation allows the archaeological cliché “excavation is destruction” to be reframed as “excavation is digitization.” They argue that the creation of digital excavation data facilitates data sharing and allows archaeologists to examine broader questions about the past by “generat[ing] publishable or near-publishable quality data at . . . collection, so that additional data preparation . . . becomes unnecessary” (Roosevelt et al. Reference Roosevelt, Cobb, Moss, Olson and Ünlüsoy2015:18).
Although these benefits should not be written off, I question where this paradigm shift will leave the many thousands of sites that were excavated before such technology was available. These sites are preserved through collections of artifacts and hard copies of accompanying records (Allen et al. Reference Allen, Ford, Ryan Kennedy, Allen and Ford2019; Childs Reference Childs and Childs2004; MacFarland and Vokes Reference MacFarland and Vokes2016). Legacy data (data from past research, including excavation notes, site reports, and results from previous analyses) can be difficult to use, requiring considerable preprocessing and cleaning (McManamon et al. Reference McManamon, Kintigh, Ellison and Brin2017; Sobotkova Reference Sobotkova2018). This is especially the case for analog (i.e., not digital) legacy data, such as handwritten excavation notes (Heath et al. Reference Heath, Freeman, Schweickart, Allen and Ford2019). In fact, Heath and colleagues suggest that broad, multisite analyses are biased toward digital datasets and tend to exclude datasets existing in physical form, given that they are more difficult to use.
To make analog legacy data sets as useful as (and facilitate their integration with) born-digital data, they must be converted into a format with which a computer can directly interact (effectively “reborn digital”). This pilot study explores this digitization process with handwritten field notes from the 1970s excavations of the Gulkana site (a precontact Northern Dene seasonal habitation; Hanson Reference Hanson2008; Workman Reference Workman1976). This site is important to a Northern Dene descendant community (the Ahtna) and to archaeological understanding of native copper innovation. However, the site remains underrepresented in the scholarly literature because there is no comprehensive map of the disparate excavations conducted there. To facilitate further analysis and publication of the Gulkana site, spatial data need to be parsed from PDF scans of field notes handwritten during the 1970s excavations. These spatial data can then be converted into a digital form to enable synthesis with born-digital data from more recent excavations.
This pilot study attempts to automate digitizing spatial data from these 1970s field notes into a machine-readable format. I explore the feasibility of training a machine learning algorithm to digitize these handwritten texts, and of using custom software to parse spatial data from them. I describe this process in the hope that it may provide a model for future attempts to address the broader disciplinary issue of digitizing analog legacy data.
In the pages that follow, I will introduce the Gulkana site, detail the costs associated with digitizing legacy data, and briefly summarize past applications of relevant methods within the discipline. I then describe the methodology used and the results of each step individually. I conclude by detailing necessary future work, providing recommendations for other researchers undertaking similar efforts, and addressing the implications of this research for archaeological legacy data and the trend toward Big Data.
BACKGROUND
The Gulkana Site
Prior to the construction of the Trans-Alaska Pipeline in the late 1970s, researchers excavated a portion of the Gulkana site (GUL-077) to mitigate the project's impact on cultural resources. A location that had been selected for gravel extraction also marked a habitation in traditional Ahtna territory occupied several times prior to the contact period (Figure 1). Archaeologists conducted rescue excavations at the Gulkana site in 1975 and 1976 (Workman Reference Workman1976). The site was excavated again in 1995 and 1996, this time by the Office of History and Archaeology, Alaska Department of Natural Resources, before the surrounding area was once again mined for gravel (Hanson Reference Hanson2008). Although portions of the site remain undisturbed, it now largely exists in the records of these excavations.

FIGURE 1. Ethnolinguistic map of the Copper River region, including the Gulkana site and nearby sources of native copper (Wrangell and St. Elias Mountains). Adapted from Cooper Reference Cooper2011.
The site stretched nearly a kilometer and was marked on the surface by 49 depressions used for storage or associated with semipermanent shelters (Hanson Reference Hanson2008). I will refer to these depressions as “pit features” to acknowledge their sophisticated construction. These pit features are indicative of repeated seasonal habitation by Northern Dene hunter-gatherer-fisher bands interacting with the surrounding landscape. Materials recovered from these structures were radiocarbon dated and suggest a period of use between AD 935 and 1485 (Arndt Reference Arndt1977; Hanson Reference Hanson2008; Workman Reference Workman1976:143).
Most notably, the excavations recovered an abundance of native copper artifacts (Hanson Reference Hanson2008; Workman Reference Workman1976). Native copper refers to copper occurring as pure nuggets. This form of copper is available at multiple locations throughout the region, especially in the nearby Wrangell and Saint Elias mountain ranges (Cooper Reference Cooper2012; Cooper et al. Reference Cooper, John, Duke, Simonetti and Chen2008). Native copper was used by the Ahtna and other Dene people primarily for tools, but it also had prestige and spiritual associations (Cooper Reference Cooper2011, Reference Cooper2012). Native copper artifacts recovered from GUL-077 include awls, knives, projectile points, and a few examples of ornamental objects (Cooper Reference Cooper2012; Hanson Reference Hanson2008; Workman Reference Workman1976; for images of native copper nuggets and tools from the Gulkana site, see Cooper et al. Reference Cooper, Ling and Brenneman2015). Native copper was traded throughout the Alaska-Yukon region and down to the coast for practical and prestige uses (Cooper Reference Cooper2012). The Gulkana site likely played an integral role in this network—roughly one-third of the native copper artifacts recovered from the Alaska-Yukon region were found at GUL-077 (Cooper Reference Cooper2011, Reference Cooper2012). The context of these artifacts indicates that GUL-077 may have been a production site for native copper objects intended for trade (Cooper Reference Cooper2012). In this way, understanding the Gulkana site can improve archaeological understanding of native copper and contribute to a narrative that emphasizes the agency of Native Alaskans to engage in metalworking innovation prior to European contact (Cooper et al. Reference Cooper, Ling and Brenneman2015). The site has been addressed in a handful of publications (Cooper Reference Cooper2011, Reference Cooper2012; Cooper et al. Reference Cooper, Ling and Brenneman2015; Hanson Reference Hanson2008; Workman Reference Workman1976), but it is currently underutilized within the context of understanding precontact Northern Dene culture.
The inaccessibility of information about the Gulkana site is due in part to the nature of the documentation of the 1970s excavations. Detailed spatial data, which contextualize the site's artifacts and features, are embedded in handwritten field notes. However, these notes are difficult to read and contain extraneous information, such as excavators’ personal musings about the project, their colleagues, and their lives (Figure 2). Digitizing the text of these notes into a typed, machine-readable format will make them easier to read and search. Parsing spatial data from them will facilitate digital mapping. However, digitizing legacy data in this way is costly (Sobotkova Reference Sobotkova2018).

FIGURE 2. A scanned page from a field notebook. Full pages such as these can also be used as training images. This limits time spent collecting training images, but it leads to a more tedious annotation process. Additionally, these pages may not necessarily include a comparable number of instances for each character.
The Costs of Digitizing Legacy Data
The laborious digitization process presents a major obstacle to use of analog legacy data (Sobotkova Reference Sobotkova2018) by academic and public stakeholders alike. Transcription is necessary to digitize the text of analog legacy records. When done manually, this process is tedious and time consuming. Researchers can alternatively pay to outsource this work (for example, the website gotranscript.com charges $3 per page), but this may not be feasible for datasets that contain sensitive locational information. This process is especially difficult for handwritten files, such as legacy excavation notes (Heath et al. Reference Heath, Freeman, Schweickart, Allen and Ford2019).
Digitizing spatial data within these texts is also costly. Sobotkova describes one project where she spent most of a $7,000 budget to extract spatial data from legacy PDF documents. She estimates that this process took her team 700 hours to complete. Looking back on this research, she projects that optical character recognition (OCR) and computational text analysis (CTA, which is using software to analyze texts) may have saved $2,000 and 250 hours of work (Sobotkova Reference Sobotkova2018).
Mapping and Text Analysis in Computational Archaeology
In this research, I explore whether custom software employing geographic information systems (GIS), CTA, and OCR can minimize the labor necessary to parse spatial data from handwritten excavation notes. Most of these methods have already been incorporated into archaeological practice, and some have been applied to legacy data on a regional scale (Brandsen et al. Reference Brandsen, Verberne, Wansleeben and Lambers2020; Jeffrey et al. Reference Jeffrey, Richards, Ciravegna, Waller, Chapman and Zhang2009; Richards et al. Reference Richards, Jeffrey, Waller, Ciravegna, Chapman, Zhang, Kansa, Kansa and Watrall2011). Of course, the use of GIS for mapping is now nearly ubiquitous in the discipline. Applying CTA to archaeological texts is much less common, but it has recently been used to analyze archaeological publications (e.g., Park et al. Reference Park, Wang and Marwick2020; Schmidt and Marwick Reference Schmidt and Marwick2020). Finally, OCR is often used as a digitizing tool by archaeologists (e.g., Heath et al. Reference Heath, Freeman, Schweickart, Allen and Ford2019; McManamon et al. Reference McManamon, Kintigh, Ellison and Brin2017) and is also common in the digital humanities, along with text extraction (Damerow et al. Reference Damerow, Erick Peirson and Laubichler2017; Pintus et al. Reference Pintus, Yang and Rushmeier2015). These spatial and textual analysis methods have been combined in archaeological research through what Murrieta-Flores and Gregory (Reference Murrieta-Flores and Gregory2015) refer to as Geographic Text Analysis (GTA).
METHODS
The initial dataset consisted of handwritten field notebooks that had previously been scanned and converted to PDFs. I employed the following methodology to extract machine-readable text and maps from these documents: (1) use OCR to make the text in these files machine readable; (2) use custom software to extract spatial data from text through text parsing; (3) use custom software to create shapefiles from location data. Where possible, I used open source software (software for which the source code is available for review and extension) because of its benefits in terms of cost, transparency, reuse, accessibility, and potential for collaboration (Ducke Reference Ducke2012, 2015; Marwick Reference Marwick2017).
Step 1: Optical Character Recognition
For the first step of this digitization pipeline, I employed OCR to translate PDF scans of handwritten documents into machine-readable text files. I specifically used the open source engine Tesseract 3.05, which applies machine learning to identify characters (Tesseract 2020). Out of the box, Tesseract is trained to recognize typed characters from many fonts and languages. It must be trained to identify new characters through a process that involves giving Tesseract labeled examples. Given that I planned to explore training Tesseract to read handwritten text, I opted to use an older version of Tesseract (Tesseract 3.05) instead of newer versions, which take significantly longer to train (Clausner et al. Reference Clausner, Antonacopoulos and Pletschacher2020; Tesseract 2021). I used the Linux Ubuntu operating system for the OCR component of this research to comply with the limitations of Tesseract's training documentation. Subsequent steps used Windows 10. The training process included collecting reference images, creating box files to indicate the locations of characters in these images, and, finally, running training commands.
Step 1a: Collect Reference Images. There are multiple ways to structure the training data passed to Tesseract. One option is to use images directly from the target corpus to train Tesseract. This approach results in a realistic training corpus and requires little preprocessing on the part of the developer. However, creating box files from these images is time consuming, and certain characters may be omitted or underrepresented (White Reference White2013). For this reason, I opted to construct training images artificially by selecting individual characters from the corpus and combining them to form sentences (Figure 3). This approach came with its own issues. For instance, it was time consuming to construct these images. Additionally, it was difficult to replicate the structure of the original field notes, create an approximately equal distribution of each character, and ensure that the characters selected were chosen from unique points in the text to minimize redundancy.

FIGURE 3. Example of a training image created by the researcher. This image was created by cropping an empty line from a scan of a field notebook, then overlaying characters cut and pasted from other locations in that notebook.
Step 1b: Create Box Files. Tesseract relies on files called “box files” to interpret training images. These files contain data identifying each character in a training image and listing the boundaries of a box that surrounds the character. To make this process go more smoothly, I used jTessBoxEditor software to visualize these box files (VietOCR 2021). Converting the training images into box files is tedious, especially for samples with many characters (such as pages from the target corpus, including Figure 2). For all training images, a user must enter an x/y location and dimensions to represent a box around each character (being careful to ensure that no boxes overlap) and then list the character associated with each box (Figure 4). The resulting file is a text file that contains a list of characters included in the training image, and the location and dimensions of the box associated with each.

FIGURE 4. Using jTessBoxEditor to create a box file from the training image in Figure 2. The user draws boxes around each character. These boxes are represented on the left (and in the resulting box file) by a starting location and dimensions.
Step 1c: Run Training Commands. Finally, with a training corpus of images and box files amassed, the last step is to use this corpus to train Tesseract. This is accomplished by running a series of commands that compiles all of the information in the box files into one file that represents the new “language” Tesseract has “learned” (see Supplemental Text 1). The user can then apply this new dataset to have Tesseract attempt to identify characters in an image from the target corpus (Tesseract 2020). The result of this final step is a plain-text file representing Tesseract's interpretation of the characters in the input image. If accurate, this machine-readable dataset can then be used for further computational analysis.
Results of Step 1 (OCR). This step proved time consuming and difficult, and it amounted to little trainable data. These results support Clausner and colleagues’ (Reference Clausner, Antonacopoulos and Pletschacher2020:75) assertion that training OCR engines is “unnecessarily complicated . . . and therefore inefficient.” In this pilot study, considerable time investment resulted in just a handful of examples for most letters and some punctuation marks—a corpus insufficient to train Tesseract. To quantify this insufficiency, I ran the “trained” and base Tesseract on a page from the target corpus and counted the number of correct identifications. Base Tesseract was able to identify just 1% of this test image (5 of 433 characters). The “trained” model identified even fewer—0.7% (3 of 433). However, this does not indicate that training was counterproductive. It is important to note that the model created in this research does not build on the base Tesseract model. Therefore, the accuracy of the base Tesseract model should not be used as a baseline but as a target to exceed.
Because my trained model was insufficient to digitize the text of the field notebooks, further analysis in this project relied on documents that had been manually transcribed as part of the training process. While transcribing the field notebooks, I was forced to consider the implications of data cleaning. Would it be better to fix spelling errors and grammatical mistakes to make the resulting corpus clearer, or would these alterations impact the integrity of the data? Although this hesitation may seem overly cautious, Rawson and Munoz (Reference Rawson, Munoz, Gold and Klein2019) argue that even these “erroneous” data can be meaningful, and in fact comprise a corpus valuable in their own right. Therefore, I chose to create a transcription as close to the original text as possible.
Step 2: Computational Text Analysis
After making the textual component of the Gulkana legacy data machine readable, the next step was to do the same for the spatial data. Excavation documentation contains a wealth of spatial information. Archaeologists have used natural language processing (NLP; computational processing of long-form texts as they would be written or spoken “naturally”) to “geoparse”—or extract locational information from—archaeological reports (Jeffrey et al. Reference Jeffrey, Richards, Ciravegna, Waller, Chapman and Zhang2009; Murrieta-Flores and Gregory Reference Murrieta-Flores and Gregory2015). However, NLP geoparsing typically acts on place names, such as cities or landmarks, instead of the relative location identifiers used to refer to artifacts and features in archaeological excavation notes (e.g., S34E42). Currently, there exists no automated process to convert these relative location identifiers into machine-readable maps. The remainder of this research was conducted with the intention of exploring the use of computational techniques to accomplish this goal.
Before spatial data could be mapped, I first had to identify and isolate it (i.e., parse it) from the body of the excavation notes. I created a CTA algorithm, named ArchLocateR, for this task. This analysis leveraged two techniques: (1) use of regular expressions to parse spatial data (e.g., N24 W7) from the text and (2) use of part-of-speech tagging to select proximate nouns that might be related to that location. I opted to use the programming language R for this step. In addition to being open source, R is commonly used by digital humanists and archaeologists (Ducke Reference Ducke2015). This disciplinary reach was an important factor in programming language choice for this step, given that ArchLocateR could be customized for other corpora of excavation notes.
Step 2a: Geoparsing. I created a regular expression to identify strings of characters in the corpus that follow patterns commonly used for excavation locations. The expression had to recognize location words that included between zero and two decimal points (e.g., N24W7, N22.5W34, or N23.4W33.7), and even those that contained range information, designating a line or rectangle (e.g., N35-40 W10). It was difficult to encapsulate so many possibilities in just one expression. Moreover, all of these forms appeared not only in this order but also “backward,” with the direction preceding the distance measurement (e.g., 4S3W, 4-6S10E, and 5.5N20.5E). This proved especially troublesome, because these instances could be interpreted as either “forward” or “backward” if preceded or followed by an additional number (e.g., 4N10E 4cmbd). Therefore, I chose to write in a preference for “forward” location words, ignoring any “backward” locations that overlapped with a “forward” one.
Results of Step 2a (Geoparsing). To analyze the accuracy of ArchLocateR at parsing locations from field notebook texts, I ran ArchLocateR on a corpus consisting of notes relevant to a feature referred to as “pit 40” (hereafter, Feature 40). The output of the program was then compared to a validation table created by manually identifying locational information in the Feature 40 corpus. This revealed that three location words had been overlooked while creating the validation table. However, the algorithm identified them correctly. I have taken this omission into account when comparing the accuracy of the two methods. Otherwise, I treat the results of the manual identification as the target output for ArchLocateR.
The algorithm was remarkably successful (Table 1). It correctly identified 68 of 76 location words (89%). There were no false positive identifications. The location words that were not recognized deviated from the expected formats by containing words (e.g., 5.56-5.64N and 3.80-4.0E), measurement units (e.g., N140cmE340cm) or unexpected punctuation (e.g., N0/E2). In future work, it may be possible to handle these variants in the regular expression.
TABLE 1. Comparing the Accuracy and Time Investment of Identifying Location Data by Hand and Algorithmically.

Note: The algorithm's accuracy is broken into two sections: excavation structures (such as units and test pits) and findings (including artifacts, archaeological features, and ecofacts). This categorization was created because excavators tended to treat excavation structures and findings differently in their notes.
I performed a χ2 goodness-of-fit test to compare the algorithm's results with my manual identification (Table 2). There was no significant (a = 0.05) difference between the results of the algorithm and the results of identification done manually by a researcher familiar with the dataset (X 2(1, N = 76) = 1.57, p = 0.21). Although these results must be verified with more data, this is a promising indicator that CTA may be able to lower the time investment required to extract locations from excavation notes without compromising accuracy.
TABLE 2. Cross Tabulation of Researcher and Algorithmic (ArchLocateR) Success at Identifying Location Words in the Text.

Step 2b: Parsing Labels for Spatial Data. The next step was to parse the descriptions associated with the spatial data collected in Step 2a. To do this, I first annotated the text to identify nouns and adjectives. I split the document by word and used the Apache OpenNLP library (Hornik Reference Hornik2019) to tag each word with a part of speech. Using this information, ArchLocateR attempts to find a chain of nouns and adjectives that may be related to each location word. Two algorithms are employed in this process, given that there are two distinct categories of locations in the corpus, and upon preliminary review of my sources, I observed that authors tended to treat each differently. The corpus contained location information related to two components of the excavation: modern features created by the excavators, such as excavation units, test pits, and baulks; and features recovered during the excavation, such as artifacts, structures, ecofacts, and taphonomic features. In this corpus, I observed that the location words used to refer to these topics tended to take different structures, with excavation information referenced by location words where direction preceded distance (e.g., N4E2) and findings taking the opposite structure (e.g., 4N2E). Differences also seemed to occur in the structure of descriptions. When addressing features related to the excavation, authors tended to list the associated description in close proximity to the location marker (e.g., “Pit N4E2”). On the other hand, location words associated with an object found during the excavation were typically listed at the end of a paragraph containing information about that object (Figure 5).
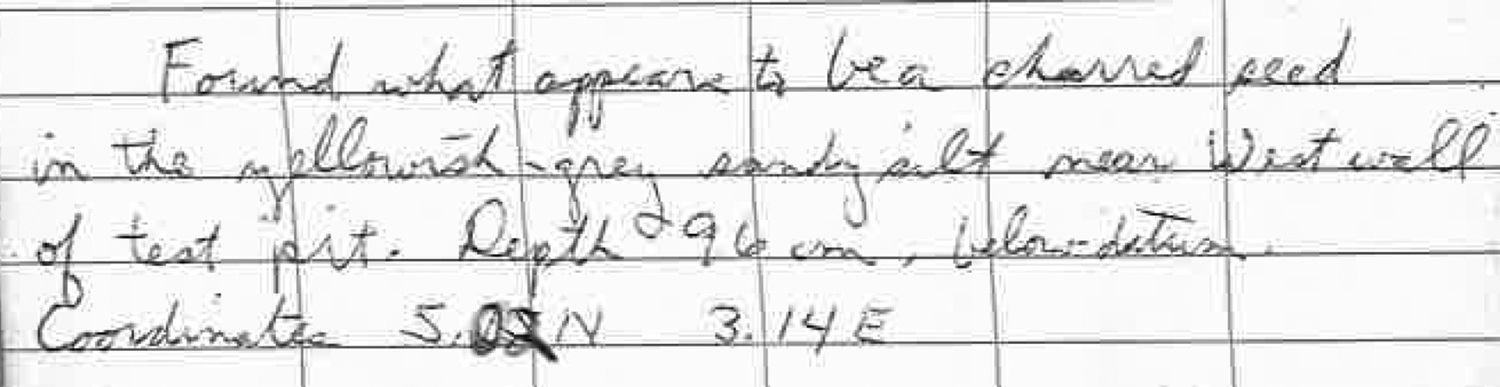
FIGURE 5. Example of a relative location coordinate associated with a found object. Transcription: “Found what appears to be a charred seed in the yellowish-grey sandy silt near west wall of test pit. Depth 96 cm. below datum. Coordinates 5.02N 3.14E.”
Accordingly, ArchLocateR uses two different techniques to find descriptions associated with each form of a location word. For “forward” location words, typically associated with excavation structures, the algorithm finds the closest chain of nouns and adjectives to each location word. The algorithm accomplishes this by radiating outward from the location word, preferring preceding words, until it identifies a nearby noun. If the words adjacent to this noun are nouns or adjectives, these words are collected as well. For “backward” location words, typically associated with objects found during excavation, the algorithm collects the chain of nouns and adjectives closest to the beginning of the sentence containing the location. If the sentence does not contain a valid noun, ArchLocateR moves on to the beginning of the previous sentence until a noun is found.
The software can accept a file input that lists words to be ignored when identifying descriptions (i.e., stop words). Here, these are nouns identified by the researcher as unlikely to be the object located at a given location. The stop words predominantly consist of excavators’ names, archaeological terminology (e.g., CMBD), and words that were improperly identified as nouns (see Supplemental Text 2).
For excavation structures and found objects alike, the output of this step is a phrase consisting of nouns and adjectives, hopefully representing the item that can be found at that location (e.g., “gray projectile point”). These descriptions, and the locations they are related to, are written to a CSV file for further analysis.
Results of Step 2b (Parsing Labels for Spatial Data). I used the validation table described above to analyze the accuracy of ArchLocateR at parsing descriptions associated with spatial data. However, for some locations there was no label to parse—that is, not all locations were explicitly associated with an object in the texts. In archaeological notes, location words are often used as a proper name for an excavation unit. Therefore, some location words were not associated with a noun—they themselves represented the entity at that location. These location words are ignored in the following accuracy calculations, decreasing the total number of viable entries to 50.
Overall, the algorithm returned an exact match (identifying both the correct location and referent) in 23 instances (46%). Of the remaining locations, the algorithm identified at least part of the referent in an additional 11 instances. These include cases where the algorithm only retrieved part of the correct phrase (for instance, “piece” instead of “piece of wood”) or retrieved additional incorrect words (for instance, the program returned “sandy silt seed” instead of “seed”). Although exact accuracy is preferred, these partial successes are still revealing and can be understood easily with minimal context. Therefore, the algorithm was at least partially successful at extracting 68% of the descriptions.
Given that excavation features and found objects were treated differently by note takers (and by ArchLocateR), the results of this step should be analyzed accordingly. Surprisingly, the algorithm was much more effective at identifying the objects associated with “backward” location words (78% partial success as opposed to just 22% with the excavation features; see Table 1). This may be because discussions of excavation features tended to be more ambiguous and less structured. On the other hand, excavators tended to list found objects at the beginning of a paragraph or sentence, with locations at the end (see Figure 7). This structure may have made them easier to isolate.
Results of Step 2 (Time Requirement). To compare the time cost of manual and automated (with ArchLocateR) text parsing, I timed myself identifying spatial data and descriptions in the corpus as if I were manually creating a map from the texts. It took me 18 minutes to read through the document and create a spreadsheet of the spatial information it contained. It is worth noting that I have become familiar with this corpus over the course of the research, which likely improved my time significantly. For comparison, I also timed the same process with a document I was less familiar with. These documents were of comparable lengths (22,444 vs. 25,186 characters), although the second document contained more location information (107 locations instead of 77 locations). This second document took 46 minutes to transcribe into a spreadsheet of spatial data and labels.
The algorithm accomplished this work in seconds (16 and 17 seconds, respectively)—more than an order of magnitude faster than even a researcher familiar with the dataset. Of course, this does not mean that this computational approach will cut time investment so dramatically. Data output by the program must still be verified by the researcher, but this process should be simpler and more manageable than undertaking the entire process manually.
Step 3: Mapping in GIS
Although GIS software can accept CSV file input, it cannot interpret the location words output from step 2. To allow the program to recognize these data as location information, they must be converted into coordinates. I created another program, called ArchShape, to convert a datum coordinate and list of relative location words to an ESRI shapefile. I used the programming language Java to develop ArchShape because it includes prebuilt libraries to interact with GIS.
The algorithm requires two CSV files as input: one containing the site's datum coordinate and another containing location words and descriptions. Using the datum coordinate, the algorithm converts the location words into a point, line, or polygon in space. This information, along with the associated descriptions, is then output to a shapefile using the Java library GeoTools (OSGeo 2021). Although the shapefile format is proprietary (belonging to ESRI), it is designed to standardize GIS data between various platforms. Therefore, these files can then be opened in any GIS platform, including ArcGIS and open source alternatives such as QGIS (Library of Congress 2020).
Results of Step 3 (Mapping). I manually mapped the spatial data from the Feature 40 corpus for validation and comparison purposes. This process was timed and took 98 minutes to add all the data manually from the validation table created in step 2 to ArcGIS Pro, using the “edit feature class” functionality to draw a point, line, or polygon for each location. Again, the algorithm performed much more quickly, requiring just 64 seconds to convert the location words into shapefiles, which could then be opened directly in ArcGIS Pro.
In addition to being fast, the algorithm was also effective at mapping. Although the location words ArchLocateR failed to recognize are omitted from the map, the vast majority of the objects were mapped, and the resulting representation of Feature 40 closely resembles the map created manually (Figures 6 and 7). In fact, much of the variation between the two maps may be due to human error—it is difficult to estimate distances in ArcGIS Pro, even with the help of guidelines.

FIGURE 6. A comparison of maps created manually by the researcher from the Feature 40 corpus and created algorithmically through steps 2 and 3 of this analysis. Labels have not been cleaned and are as they appear in the original text.

FIGURE 7. Comparison of details included in a section of maps in Figure 6 (the northeast quadrant of unit N6E4).
DISCUSSION
Future Work
This pilot study digitized only a handful of the 58 field notebooks associated with the 1970s excavations of the Gulkana site. The map created from these notebooks provides a clearer picture of one feature of the site, but there are many more to address. The remaining notebooks will be the focus of ongoing research, the intent of which will be to integrate the spatial data from the 1970s excavations (trapped in handwritten field notebooks and digital scans of them) with digital spatial data collected during excavations in the 1990s. Until all these records are integrated and mapped, any picture we have of the Gulkana site will be incomplete.
During this process, it may also be necessary to improve the software utilized in this research. For instance, it may be possible to increase the accuracy of ArchLocateR by modifying the algorithm to use a more complex machine learning approach (such as Named Entity Recognition) to identify the descriptions associated with locations more accurately. More urgently, further research is warranted to find a solution to digitize the text of handwritten excavation notes. Although this study demonstrates that training OCR on handwritten excavation notes is time intensive, it is possible that this issue could be resolved through hiring an assistant to create training files, or by employing software designed to expedite this process (Clausner et al. Reference Clausner, Antonacopoulos and Pletschacher2020). Alternatively, it may be beneficial to explore using a cleaner dataset of excavation notes or even a premade dataset, such as the National Institute of Standards and Technology's Special Database 19, which contains thousands of handwritten training images (Flanagan Reference Flanagan2020) to minimize the time cost of this training. This pilot study was not exhaustive, so OCR should not be ruled out for this purpose. However, it is worth noting that OCR often has low success with identifying handwritten characters (Blanke et al. Reference Blanke, Bryant and Hedges2012; University of Illinois Library 2021), in spite of ongoing research in the digital humanities and in computer science (e.g., Pintus et al. Reference Pintus, Yang and Rushmeier2015). It may be worth exploring an alternative solution, such as reading the notes through voice recognition software (Heath et al. Reference Heath, Freeman, Schweickart, Allen and Ford2019).
Recommendations for Scholars Facing Similar Work
When digitizing, it is important to consider the implications of data cleaning. By selecting just locations and descriptions from the corpus, mapping effectively serves as a complex form of data cleaning, paring the input down until only mappable data remain. This is relevant to a broader conversation in CTA: how can ambiguity be incorporated in computation (Jurafsky and Martin Reference Jurafsky and Martin2000; Kintigh et al. Reference Kintigh, Altschul, Kinzig, Fredrick Limp, Michener, Sabloff, Hackett, Kohler, Ludäscher and Lynch2015; Liu Reference Liu, Gold and Klein2016; Nguyen et al. Reference Nguyen, Liakata, DeDeo, Eisenstein, Mimno, Tromble and Winters2019; Rawson and Munoz Reference Rawson, Munoz, Gold and Klein2019)? This conversation is beginning to be picked up in digital archaeology as well (Huggett Reference Huggett2020), and even in the context of legacy data (Noack Myers Reference Noack Myers, Allen and Ford2019; Sobotkova Reference Sobotkova2018). Each field notebook contains a wealth of information relevant to the objects being mapped, but this algorithm (and even manual mapping) ignores most of it. For example, Figure 5 contains contextual information associated with location data. Although this information is all relevant to the object in question, likely only “charred seed,” “96 cm below datum,” and the location would be included in a map created manually. Although the original “messy” data are not necessarily lost, they are omitted from the new, “cleaner” dataset. It is worth considering how these additional data can be incorporated.
Additionally, researchers must consider the maintenance requirements associated with digitization. All digital tools and data require ongoing work in the form of maintenance—the hyper-innovative digital landscape threatens to make archaeological tools and datasets obsolete or inaccessible (Eiteljorg Reference Eiteljorg2004; Kintigh et al. Reference Kintigh, Altschul, Kinzig, Fredrick Limp, Michener, Sabloff, Hackett, Kohler, Ludäscher and Lynch2015; Lercari et al. Reference Lercari, Shiferaw, Forte and Kopper2018; Richards Reference Richards2017). Although the software and data created in this research rely on relatively stable file formats (CSV, TXT, shapefiles) and tools (Java, R, and GIS), they are still at risk of obsolescence in the future, when these are eventually replaced. Ducke (Reference Ducke2012) has proposed that open source software may provide a solution by fostering engagement beyond the scope of just one project, although this would require the participation of a deeply invested community. Regardless, researchers must be aware of the maintenance needs of digital tools and datasets when planning and budgeting for projects (Childs and Benden Reference Childs and Benden2017; Eiteljorg Reference Eiteljorg2004).
It is also important to consider that digitizing archaeological legacy data is not sufficient to guarantee its usefulness as a shared disciplinary resource. Archaeologists have recently promoted the adoption of the FAIR principles, introduced in 2016, which call for data to be findable, accessible, and interoperable, as well as reusable (Wilkinson et al. Reference Wilkinson, Dumontier, Aalbersberg, Appleton, Axton, Baak and Blomberg2016). This article has explored a solution for increasing reusability and interoperability of a legacy dataset by digitizing it into a modernized, machine-readable format. However, the software I outline in this article is not meant to address issues of findability and accessibility. Digital curation and publishing tools such as tDAR, ADS, and Open Context must be employed to these ends (McManamon et al. Reference McManamon, Kintigh, Ellison and Brin2017).
Finally, there are ethical concerns associated with working with archaeological legacy data. Legacy datasets are not only valuable to academic analyses. They are also meaningful to nonacademic communities, particularly descendants (Heath et al. Reference Heath, Freeman, Schweickart, Allen and Ford2019; Neller Reference Neller2004). Archaeologists have an ethical obligation to make data available to interested publics when possible (Allen et al. Reference Allen, Ford, Ryan Kennedy, Allen and Ford2019; Childs Reference Childs and Childs2004; Society for American Archaeology 1996). To ethically interpret archaeological data that may impact a descendant community, archaeologists should follow the CARE principles. This amendment to the FAIR principles, proposed by the Global Indigenous Data Alliance (GIDA) in 2019, is intended to advocate for Indigenous interests in the open science movement—namely, collective benefit, authority to control, responsibility, and ethics (Research Data Alliance International Indigenous Data Sovereignty Interest Group 2019). The Gulkana site remains significant to the Ahtna descendant community, so future efforts to interpret the Gulkana site will strive to fulfill the CARE principles through collaboration with Ahtna leadership and public outreach to increase local awareness of the site.
Broader Impacts
Centuries of archaeological excavations have created a large body of paper records that remain valuable to the discipline (Jeffrey et al. Reference Jeffrey, Richards, Ciravegna, Waller, Chapman and Zhang2009). The Gulkana site is just one example of this broader disciplinary issue, referred to as the “legacy data backlog” (Altschul et al. Reference Altschul, Kintigh, Klein, Doelle, Hays-Gilpin, Herr and Kohler2017; Kansa and Kansa Reference Kansa and Kansa2018; McManamon et al. Reference McManamon, Kintigh, Ellison and Brin2017; Nicholson et al. Reference Nicholson, Fernandez and Irwin2021; Wollwage et al. Reference Wollwage, Brooks, Smith, McLemore, Strader and Gant2020). Therefore, it is my hope that the software created and tested in this research can be used as a guide for more broadly designed tools to digitize analog archaeological legacy data.
Efforts to revitalize archaeological legacy data are especially impactful during this period. These problems are relevant to the burgeoning field of Big Data, given that legacy datasets are quintessential examples of large, complex, and unstructured datasets (boyd and Crawford Reference boyd and Crawford2012). As Kintigh and colleagues (Reference Kintigh, Altschul, Kinzig, Fredrick Limp, Michener, Sabloff, Hackett, Kohler, Ludäscher and Lynch2015:5) argue, archaeologists should build on developments in Big Data to create “analogous tools to deal with ‘complex data.’” Archaeological legacy datasets are a perfect corpus to explore these themes because of their complexity, as they often consist of textual data, maps, images, and physical objects (Kintigh et al. Reference Kintigh, Altschul, Kinzig, Fredrick Limp, Michener, Sabloff, Hackett, Kohler, Ludäscher and Lynch2015).
Furthermore, the shift toward analyzing archaeological legacy data seems to be gaining momentum. Archaeologists have repeatedly emphasized that legacy datasets are an immense heritage resource (Lindsay and Williams-Dean Reference Lindsay and Williams-Dean1980; Society for American Archaeology 1996; Sullivan and Childs Reference Sullivan and Terry Childs2003). However, it was not until the COVID-19 pandemic that the discipline took full advantage of this corpus of information (Howey and Brouwer Burg Reference Howey and Burg2021). The pandemic forced many researchers to abandon field data collection plans for the summers of 2020 and 2021. However, because of the nature of my research, the global pandemic had relatively little impact on my own work. In this way, it took a global health crisis to demonstrate the importance of legacy data and the impacts of barriers to accessing these datasets (Di Fiore Reference Di Fiore2020). As archaeologists return to the field, it will be crucial to remember these lessons and commit to digitizing analog legacy data for future analysis.
CONCLUSION
The goal of this pilot study was not to create a panacea for archaeological data management. Rather, this study investigated the feasibility of creating software to digitize handwritten excavation notes into machine-readable texts and maps so that they can be analyzed alongside born-digital data. This research demonstrates that custom, open source software may be capable of automating the digitization process enough to overcome major barriers to digitizing analog data, especially the tedious mapping process. The solution explored in this research is specific to the Gulkana site, but I hope that this article will serve as a useful guide for other researchers working with similar analog datasets.
Acknowledgments
No permits were required for this research. I am indebted to the thoughtful reviewers who have provided invaluable feedback on my manuscript. I also wish to thank Erik Otárola-Castillo, Ian Lindsay, Ethan Watrall, and especially H. Kory Cooper for their support and guidance. Finally, special thanks are due to Giselle Narvaez Rivera for translating my abstract.
Funding Statement
This research was supported in part by funds from NSF Arctic Social Sciences grant #1108250.
Data Availability Statement
There are no original data published in this article. All software created during this research is available at https://doi.org/10.5281/zenodo.6791486.
Competing Interests
The author declares none.
Supplemental Material
For supplemental material accompanying this article, visit https://doi.org/10.1017/aap.2022.44.
Supplemental Text 1. .txt file containing the commands and steps used to train Tesseract 3.05.
Supplemental Text 2. .txt file containing stop words input by the user. ArchLocateR ignores these words when searching for descriptions.


 Open access