


Introduction
Satellite passive microwave observations have an all-weather, day-or-night capability to determine snowpack properties on a synoptic basis over large areas (Reference GloersenGloersen and others, 1984). As these satellite data sets reach decadal or longer time-scales, they will become increasingly important in evaluating and quantifying the role of snow in the hydrologic cycle. In this cycle, snow not only acts as a storage mechanism, but also is closely coupled to the general atmospheric circulation through its strong influence on the surface energy balance. The storage mechanism is particularly important in the western United States, which obtains most of its water for domestic, agricultural and hydroelectric use from snowpack melting (Reference ChangChang and others, 1987a). The coupling of the snow cover with the global atmospheric and oceanographic circulation is demonstrated by Reference Barnett, Dumenil, Schlese and RoecknerBarnett and others (1988) who, using global climate model simulations, have shown that the Eurasian snow cover may be an important factor in El Niño-Southern Oscillation (ENSO) events.
Reference BarryBarry (1983) and Reference Foster, Hall and ChangFoster and others (1987) review passive microwave techniques for determining snowpack parameters. These techniques have been successfully used in the Canadian plains and in Finland, and are beginning to be applied to the upper Colorado River basin. The latter case is much more complicated because of the varied terrain, vegetation, and snow distribution in this large basin. Reference Josberger and BeauvillainJosberger and Beauvillain (1989) compared the Scanning Multichannel Microwave Radiometer (SMMR) observations with images in the visual frequency range obtained by the Defense Meteorological Satellite Program (DMSP) from the upper Colorado River basin to determine a threshold passive microwave signature that delineates the snow cover for this area. Also, Chang and others (1987a) have shown that the observed brightness temperatures from snowpacks in regions of high average elevation in the Colorado basin closely agree with calculated values based on field observations of water equivalent and grain-size.
This study uses the nine-year SMMR data set to investigate both inter- and intra-annual snowpack variations and their relation to the total annual discharge of the Colorado River at Lee's Ferry. Both the snowpack and the discharge for this period are highly variable; hence, these are ideal data sets to explore with passive microwave techniques. On a basin scale, this study finds a strong relation between annual and seasonal Colorado River discharge and the spatially integrated passive microwave signal from the basin. The relation is further enhanced by the inclusion of digital elevation data.
The SMMR Data
The Scanning Multichannel Microwave Radiometer (SMMR) on the Nimbus-7 satellite measures the brightness temperatures at five different frequencies, both horizontally and vertically polarized, and Gloersen and others (1984) give a complete description of the instrument. The 18 and 37 GHz brightness temperatures have the greatest response to snow cover because the wavelengths at these frequencies (1.66 and 0.81cm, respectively) are typically near the grain-size of the snow (Reference Edgerton, Stogryn and PoeEdgerton and others, 1971), which allows the snow to scatter the ground emitted microwave radiation effectively.Reference Chang, Foster and Hall Chang and others (1987b) have shown that the 37 GHz horizontally and vertically polarized channels are more sensitive than either of the 18 GHz polarized channels to snowpack properties, water equivalent and grain-size. In the present study, we arbitrarily used the vertically polarized 18 and 37 GHz brightness temperatures, and we used data from the night observations to minimize the effects of liquid water within the snowpack. The two brightness temperatures were combined to give a single dimensionless parameter, the negative gradient ratio, NGR, which is defined as:

where Tb 18 and Tb 37 are the vertically polarized brightness temperatures at the respective frequencies. To first order, this formulation removes the surface physical temperature signal. Reference Cavalieri, Gloersen and CampbellCavalieri and others (1984) successfully used a similar ratio as part of a calculation to determine sea-ice coverage and ice type in the polar oceans from SMMR observations.
The SMMR footprint for both frequencies is a nearly circular ellipsoid with major axes lengths of 30 and 50 km for the 37 and 18 GHz frequencies, respectively. A Gaussian weighting scheme, rather than a simple binning technique, mapped the orbital data into

Fig. 1. The study region showing the 7000ft (2133m) elevation contour, and the boundary of the upper Colorado River basin, which is denoted by the heavy line.
The nine-year SMMR record provides a unique time series, derived entirely from satellite observations to examine the annual variations of the snowpack extent. We determined the snowpack extent using the threshold criteria developed by Reference Josberger and BeauvillainJosberger and Beauvillain (1989) in which a pixel was considered snow covered if NGR ≥ 7. Figure 2 shows the nine-year average of the per cent basin snow cover for the nine-year SMMR record, as well as the time series from the heaviest and lightest snow years, 1979 and 1981. Generally, the snowpack begins to expand around water year day (WYD) 60, the beginning of December, reaches a maximum at WYD 130, mid-February, and then declines. For 1979 the basin was almost entirely snow-covered, while in 1981, only 35% of the basin was snow-covered, which is indicative of the annual variability of the snowpack in this region. Although not shown in the average time series, inspection of the sequential SMMR maps shows the temporal and spatial variability of the snowpack extent. These changes take place in the lower elevations of the southwest portion of the region (Fig. 1) where winter storms deposit snow at low elevations, which then rapidly melts during warm periods. The spring decrease in snow extent is usually characterized by a sawtooth pattern that results from the warming and cooling that occurs in the early spring. The sawtooth pattern results from the presence or absence of liquid water in the snowpack. In the spring, daytime warming may generate liquid water within the snowpack that may not entirely refreeze at night, which then will decrease the night NGR. During cool periods, when the liquid water refreezes, the microwave signature rebounds.

Fig. 2. Average annual time series of per cent of basin snow-covered as determined from the nine-year SMMR record; along with the maximum snow year, 1979, and the minimum snow year, 1981.
The SMMR data not only provide a comprehensive uninterrupted view of the snowpack extent, but also give an index of the water storage within the entire basin. Reference Josberger, Ling, Campbell, Gloersen, Chang and RangoJosberger and others (1989) showed that the correlation between the NGR in given pixels and water equivalent measurements from the U.S. Department of Agriculture SNOTEL network commonly attain values of 0.9 or greater. Chang and others (1987a) found good agreement between calculated and observed brightness temperatures from select regions in the Colorado Rocky Mountains. However, because of the difficulties introduced by the complex terrain, vegetation, and snow deposition, algorithms to extract pixel water equivalent information from the SMMR observations will require localized coefficients. Rather than focusing on the mesoscale, this study focuses on the basin scale, approximately 800 km, by summing the NGR values from each pixel within the basin. For pixels that are only partially in the basin, the NGR value is weighted by the fraction of the pixel in the basin. The basin boundary and elevation distribution for each pixel were determined from the U.S. Geological Survey 30 s digital elevation model.

Fig. 3. Average annual times series of the basin total NGR, and the time series from the maximum snowyear, 1979, and the minimum snow year, 1981.
Figure 3 shows the nine-year average time series of the total NGR and the time series from the maximum and minimum snow years, 1979 and 1981. Not surprisingly, these time series exhibit behavior similar to the snow extent time series shown in Figure 2. However, the deviations from average for the maximum and minimum years are proportionately greater than those observed in the snowpack extent. This suggests a greater difference in water storage than would be indicated from only the variations in extent. Because the basin total NGR is a regional index, it is logical to compare it to the Colorado River discharge, of which a major component is snowmelt runoff. For the SMMR period, the natural flow exhibits a wide range, 9–29 km3 a−1, as it reflects the various snowpack conditions. The U.S. Bureau of Reclamation determines the natural discharge from flow measurements at Lee's Ferry; it is the total discharge corrected for upstream water diversion, such as irrigation, and domestic and industrial water consumption.
To compare the SMMR observations to the natural discharge, we first determined the maximum value of NGR of each pixel for a given water year, and then summed the pixel values within the basin. For pixels that are partially in the basin, the maximum NGR was multiplied by the fraction of the pixel within the basin. Because not all pixels attain their maximum snowpack simultaneously, this procedure should provide an enhanced indicator of the total annual snow storage. However, these values showed little difference from the maximum value of the total NGR time series from each year. We investigated the effects of elevation by weighting the NGR value from each pixel by the fraction of area above 6000 ft (1828 m) and 7000 ft (2133 m), as determined from the digital elevation model, and then performed the summation. Figure 4 shows the inter-annual variation of the total maximum NGR with no elevation adjustment, and both a 6000 and 7000 ft discrimination elevation, or mask. For all years the masking reduces the total NGR, a higher mask results in more reduction as more of the snowpack is excluded. The 6000 ft mask makes the greatest proportional change in the total maximum NGR for 1979 than in the other years because 1979 was a year when there was considerable snowpack at low elevations that is excluded by this mask. The 7000 ft mask greatly reduces all values of the total NGR. However, for 1981, which was a very light snow year, neither masking has a significant effect because most of the snow was found at elevations greater than 7000 ft. Figure 4 also shows the annual discharge, and the April through July natural discharge which reflects total snow accumulation for each year.
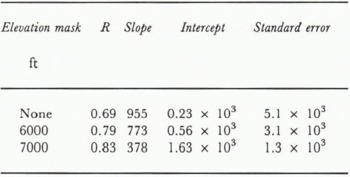
Table 1 gives the results of a linear regression of the three NGR cases on the annual discharge. Without an elevation correction, the correlation of the annual discharge and the total maximum NGR is 0.61. With a 6000 ft discrimination elevation, the correlation increases from 0.61 to 0.71 and the slope of the regression line decreases from 655 to 542 km3 unit−1 basin NGR. A discrimination elevation of 7000 ft results in a correlation of 0.77, a much smaller increase. However, the slope of the regression line dramatically decreases to 270 km3 unit−1 basin NGR, which is a major decrease in sensitivity. This results from the elevation distribution within the basin; as Table2 shows, the total area above 6000 ft is almost 70.5%, whereas the total area above 7000 ft is 40.5%. Exclusion of the area between 6000 and 7000 ft from the analysis neglects a significant amount of snow, that ulitmately results in run-off. Use of the seasonal discharge, April through July, further improves the correlation and Table3 gives the results. In this case, the correlations show similar behaviour to that found when the total annual flow was used, however, for all elevation masks the correlations are significantly greater, and they are 0.69, 0.79 and 0.83 for the three cases respectively. The regression slopes decrease with the increasing elevation masks as more snow at lower elevations is eliminated from the analysis, as discussed in the annual discharge case.

Fig. 4. Time series of annual natural discharge in km3 (heavy dashed line), April through July natural discharge in km3 (solid heavy line), total maximum Negative Gradient Ratio (NGR) for all elevations (short dashed line), and the 6000ft (1828m) (solid line) and 7000ft (2133 m) (long dashed line) masking.
Table1 Table1. The results of a linear regression of the total maximum Negative Gradient Ratio (NGR) for no elevation cut-off, and elevation cut-off of 6000ft and 7000ft, on the annual natural discharge. R, correlation coefficient s; slope in km3unit−1 basin NGR; intercept and standard error in km3a−1

Table 2 The elevation distribution of the upper Colorado River basin determined from digital elevation data
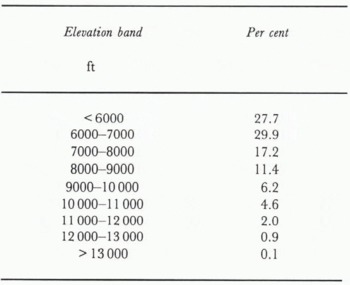
Table 3 The results of a linear regression of the total maximum Negative Gradient Ratio (NGR) for no elevation cut-off, and elevation cut-off of 6000 ft and 7000 ft, on the April through July natural discharge. Values as for Table 1.
The regression results given in Tables 1 and 3 indicate that satellite passive microwave observations give a strong indication of the expected April through July discharge, and to a lesser extent, the annual discharge. We suggest that a masking elevation of 6000 ft (1828 m) provides the best indicator of the snowpack water equivalent even though the analysis gives higher correlations and lower standard errors for the 7000 ft (2133 m) masking. This seemingly contrary observation results from inspection of the slopes and intercepts of the various cases. For both the annual and April–July discharge cases, the slope of the regression line is a measure of the sensitivity of the technique. The slope decreases as the masking elevation increases but the change in slope between the no-masking case and the 6000 ft case is much less than the change found between the 6000 ft and 7000 ft cases, which indicates that by masking the elevations between 6000 and 7000 ft, significant amounts of snow are excluded. Furthermore, the intercepts for the 6000 ft cases are smaller than those from the 7000 ft cases and one would expect the total maximum NGR to be near zero for the no-snow situation. Finally, this result agrees with common hydrologic knowledge of the upper Colorado basin which states that most of the snowpack is found above 6000ft (personal communication from A. Rango).
The major source of variance in these regressions results from the snowpacks that occurred in water years 1979 and 1983. Although water year 1979 was the heaviest snow year of the period, with the greatest maximum NGR, the discharge was below that predicted by the linear regression for all three elevation cases. For this year, the SMMR observations showed that the basin was almost entirley snow-covered at all elevations, which produced a large maximum NGR; however, the snowmelt at elevations below 6000 ft probably did not result in runoff. For water year 1983, the situation was reversed; the discharge was greater than that predicted from the regression. In this year, there was late snowfall that was wet, which prevented the total maximum NGR from reaching a higher more indicative value.
Conclusions
The SMMR observations of the upper Colorado River basin provide a nine-year history of the snowpack extent across the basin and also give an index of the basin-wide potential snowmelt run-off. During these nine years the snowpack was highly variable, but the strong ENSO event of 1982–83, which greatly influenced global weather (Reference QuirozQuiroz, 1983), resulted in normal snow accumulation. Reference Rhodes, Ely and BracupRhodes and others (1984) show that the disastrous flooding that took place in the water year 1983 resulted not from abnormal accumulation, but rather from late simultaneous warming at all elevations that produced the extreme run-off.
Our study combines data on three disparate scales, digital elevation data (1 km), SMMR data (25 km) and river discharge (800 km), to investigate the hydrology of the basin. For this basin, the high correlations between the discharge and satellite observations are gratifying, considering the complexity, variability, and size of the drainage. The quality of the index is enhanced when the seasonal run-off, that which primarily results from snowmelt run-off, is used in the analysis. The nine-year SMMR data set and its ongoing extension by the DMSP Special Sensor Microwave Imager (SMM/I), will be essential data sets with which to study snowpacks in remote areas over large spatial scales.


