


Introduction
Dissolved organic matter (DOM), a complex suite of both polar and non-polar compounds that can vary on the basis of location, source material and degradation state, has been studied extensively over the course of decades using a variety of analytical methods. DOM is thought to represent an assemblage of complex molecules which, among them, could contain proxies for climatological conditions of the past. Accordingly, many studies of ice cores have focused on a specific fraction of DOM (e.g. aliphatic hydrocarbon-based biomarkers: Reference Makou, Thompson, Montluçon and EglintonMakou and others, 2009; black carbon: Reference Chylek, Johnson and WuChylek and others, 1992; or polycyclic aromatic hydrocarbons: Reference GabrieliGabrieli and others, 2010) which provides molecular clues to environmental conditions at the time of deposition. While most studies have sought to examine low molecular weight and extractable non-polar compounds, more polar and higher molecular weight compounds that comprise the bulk of the DOM remain generally uncharacterized. The aquatic and soil DOM community has made significant use of high-resolution mass spectrometry techniques to characterize this inherently complex mixture, including the use of Fourier transform ion cyclotron resonance mass spectrometry (FTICR-MS) (Reference Sleighter and HatcherSleighter and Hatcher, 2007; Reference ReemtsmaReemtsma, 2009). Reference Grannas, Hockaday, Hatcher, Thompson and Mosley-ThompsonGrannas and others (2006) reported the first use of FTICR-MS for the analysis of DOM in ice cores, and subsequent studies have also successfully employed this method in the analysis of glacial ice and water (Reference Bhatia, Das, Longnecker, Charette and KujawinskiBhatia and others, 2010). However, characterization of DOM from pristine samples is challenging because DOM concentrations in ice meltwaters are low, generally ranging from <1 ppb (μg L−1 C) to low ppm (mg L−1 C) depending on source and location (Reference Bhatia, Das, Longnecker, Charette and KujawinskiBhatia and others, 2010). This limited amount of carbon leads to the need for large sample sizes, which limits the temporal and spatial resolution that is achievable during ice-core analysis and also results in the use of large fractions of valuable sample archives. Further advances in analytical techniques are thus crucial in order to limit sample size requirements and make the technique as widely applicable as possible for use in the ice-core community.
The complexity of DOM and its low concentration in ice cores has limited the research of ice DOM to only a few recent investigations that utilize FTICR-MS (Reference Grannas, Hockaday, Hatcher, Thompson and Mosley-ThompsonGrannas and others, 2006; Reference Bhatia, Das, Longnecker, Charette and KujawinskiBhatia and others, 2010). Reference Grannas, Hockaday, Hatcher, Thompson and Mosley-ThompsonGrannas and others (2006) determined that FTICR-MS data from ice-core samples obtained from Franz Josef Land, Russian Arctic, could be used to correlate the effects of industrial input, in terms of sulphur- and nitrogen-containing organic compounds. The two samples from their cores were dated in approximate age to AD 1950 and AD 1300 and they determined that specific ‘tracer’ molecules could be detected by FTICR-MS in these ice cores that indicate the type of environment from which the organic matter was derived. Reference Bhatia, Das, Longnecker, Charette and KujawinskiBhatia and others (2010) determined that the organic species detected by FTICR-MS from subglacial samples might be the result of terrestrial materials that have been oxidized by microbial communities. More recently, Reference StibbinsStubbins and others (2012) used FTICR-MS to examine glacial meltwater forming at the base of Mendenhall Glacier, Alaska, and concluded that atmospheric aerosols provide a significant source of anthropogenic DOM to the glaciers. All of these studies showed that crucial environmental information could be gained by studying the DOM portion of ice meltwater, by invoking new and advanced analytical techniques.
However, the limitations of analyzing the DOM in ice cores and associated meltwater by electrospray ionization (ESI) FTICR-MS are extensive. Ice samples contain very small amounts of DOM when compared volume to volume with samples from other environments (Reference Grannas, Hockaday, Hatcher, Thompson and Mosley-ThompsonGrannas and others, 2006; Reference Bhatia, Das, Longnecker, Charette and KujawinskiBhatia and others, 2010) and it is difficult to directly analyze the DOM in the meltwater in a manner that is typical for many riverine DOM samples (Reference Sleighter, McKee and HatcherSleighter and others, 2009). It is necessary to concentrate the DOM, which is typically accomplished by use of solid-phase extraction (SPE). Additionally, the presence of minute quantities of salts negatively impacts the ionization efficiency of organic materials and thus salts must be removed prior to analysis. This is also achieved by the use of SPE to isolate the DOM. Large sample volumes (typically >1 L) are commonly used for the efficient concentration and extraction of low-concentration DOM samples for subsequent chemical analysis. Unfortunately, to obtain such large volumes, ice must be collected from a large vertical section of the core, a situation that sacrifices vertical spatial and temporal resolution.
Previous extraction studies have shown that C18 SPE is a suitable concentration and extraction technique for DOM. C18 SPE consists of octadecyl (C18) functional groups bonded to a silica surface, providing relatively non-polar interactions with analytes in the sample matrix. When a given volume of water is passed over the solid-phase sorbent, DOM is sorbed to the C18 phase and then eluted off the resin into a small volume of organic solvent (typically methanol). Typical recoveries in terms of extractable carbon by C18 have been: 10–94% for glacial ice from Greenland (Reference Bhatia, Das, Longnecker, Charette and KujawinskiBhatia and others, 2010); 26 ± 4% for Antarctic sea water (Reference Dittmar and KochDittmar and Koch, 2006); >60% for river water (Reference Kim, Simpson, Kujawinski, Freitas and HatcherKim and others, 2003a); and 14–39% for marine and terrestrial pore waters (Reference Koch, Witt, Engbrodt, Dittmar and KattnerKoch and others, 2005). It has recently been shown that PPL (styrene divinylbenzene polymer) is a more efficient extraction resin in terms of total extracted carbon when compared with C18 (common extraction efficiencies are 20–35% higher using PPL than C18) and PPL retains more nitrogen-rich molecules (Reference Dittmar, Koch, Hertkorn and KattnerDittmar and others, 2008). SPE resins are available in both disk (47 mm) and cartridge forms and a relatively simple extraction set-up can be achieved with an aspirator as a vacuum, allowing these extraction methods to be adapted easily to use in the field, as described in the case of C18 SPE by Reference Kim, Simpson, Kujawinski, Freitas and HatcherKim and others (2003a) and for PPL SPE by Reference Dittmar, Koch, Hertkorn and KattnerDittmar and others (2008).
Previous work by Reference Grannas, Hockaday, Hatcher, Thompson and Mosley-ThompsonGrannas and others (2006) required 900 mL of ice-core meltwater and nearly 2 hours of FTICR signal adding to generate adequate mass spectral data. Reference Bhatia, Das, Longnecker, Charette and KujawinskiBhatia and others (2010) required water volumes similar to that of Reference Grannas, Hockaday, Hatcher, Thompson and Mosley-ThompsonGrannas and others (2006), while Reference StibbinsStubbins and others (2012) did not require water sample concentration because salt did not interfere with mass spectral acquisition in that study. To reduce the volume of meltwater needed, especially in cases where the presence of salt causes problems, a strategy must be employed that allows for either a more sensitive analysis or a higher concentration factor of the DOM in ice-core meltwater. Recent advances in nanoelectrospray ionization (nano-ESI) technology have shown that it may be possible to increase the sensitivity of FTICRMS for some analytes by changing the infusion flow rate (μL min−1 flow rates are typical of ESI while nL min20121 flow rates are used for nano-ESI) and charge parameters by using chip-based infusion. Reference Schmidt, Karas and DülcksSchmidt and others (2003) determined that reducing sample flow rate using nano-ESI could drastically change the analysis for certain samples by reducing the solvent/analyte interactions. Reference Kim, Rodgers, Blakney, Hendrickson and MarshallKim and others (2009) found that nano-ESI-FTICR-MS is comparable with ESI-FTICR-MS but reduces instrument analysis time, the possibility for contamination and the volume of sample required for analysis, and can possibly be used as an automated technique. We report here for the first time the ability to analyze smaller volumes of ice-core meltwater (<100 mL extracted) from a Greenland ice-core site by employing SPE extraction followed by nano-ESI-FTICR-MS. By reducing the volume required for extraction, new information may be gained about the changes in DOM characteristics over smaller temporal periods.
Experimental Procedure
Selection of ice cores
In coordination with the United States Geological Survey National Ice Core Laboratory (USGS NICL), two core samples were chosen for this mass spectrometric method development. The criteria for selecting sites included the age of the core, the availability of age–depth correlation data and the drilling method used. All samples requested were drilled within the past 20 years and were dry drilled (a non-fluid drilling process) according to the USGS NICL inventory. Two samples (3 cm × 3 cm × 10 cm) were collected from the Greenland Ice Sheet Project 2 (GISP2) core (GISP2B, tubes 119, 188). These cores represented age–depth correlations of ∼AD 1660 (118.12–118.22 m) and ∼AD 1360 (187.80–187.90 m). All ice-core samples were delivered to Old Dominion University in February 2010 from the USGS NICL. Upon arrival, samples were placed in a clean freezer (−20°C) in their original packaging for storage.
Ice-core Dom preparation
Sealable glass containers were used for melting each ice core in an enclosed environment. All glassware was acid-washed and combusted overnight at 450°C. Sample preparation was completed in a clean room. The outer edges of each ice core were rinsed using high-purity liquid chromatography/mass spectrometry (LC/MS)-grade water to remove potential contaminants from storage, cutting and handling (∼0.5 cm was rinsed off each edge of the 3 cm × 3 cm × 10 cm section). The rinsed ice core was transferred to a separate glass container, sealed and allowed to melt completely under ambient conditions in a clean room. Approximately 90 mL of meltwater was obtained from each core.
Owing to the natural presence of salts in the ice cores and the need to concentrate the DOM, each meltwater sample was extracted with PPL and/or C18 SPE. Approximately 96 mL of the GISP2 (187.80–187.90 m, AD 1360) core was extracted using PPL. Two replicate samples of the GISP2 (118.12–118.22 m, AD 1660) core (∼90 mL each) were extracted by PPL and C18 SPE. The two 1660 GISP2 samples were used to determine the effects of PPL versus C18 extraction. Prior to extraction, each meltwater sample was acidified to a pH of 2 using 12 mol L−1 trace-metal-grade hydrochloric acid. PPL cartridges (3 mL volume, 100 mg resin, Bond Elut, Varian) were cleaned with methylene chloride and conditioned with methanol and water (all LC/ MS grade) as per the manufacturer’s instructions. After the sample (or blank LC/MS water) was passed through each cartridge, it was rinsed with three cartridge volumes of acidified water to remove any salts and then dried under N2 gas. The DOM was eluted from the resin with half a cartridge volume of methanol (∼1.5 mL) and this fraction was collected for subsequent FTICR-MS analysis.
The parameters for C18 SPE extraction were similar to those of Reference Grannas, Hockaday, Hatcher, Thompson and Mosley-ThompsonGrannas and others (2006). Briefly, acidified samples (and an LC/MS water blank) were extracted using a 47 mm C18 disk (3M, Empore) which was cleaned and conditioned with methanol and water as per the manufacturer’s instructions. After rinsing the disk with acidified water to remove salts, the DOM was eluted using 10 mL methanol and concentrated using rotary evaporation to a final volume of ∼1 mL. All methanol extracts were refrigerated until mass spectral analysis.
Nano-ESI-FTICR-MS
An Advion (Tri Versa Nanomate) nano-ESI ion source online with a Bruker Daltonics 12 Tesla Apex Qe FTICR-MS, housed at the College of Sciences Major Instrumentation Cluster (COSMIC) at Old Dominion University, was used for analysis of the extracted DOM samples and blanks. In addition to providing higher sensitivity than ESI, this system also decreases the time required for cleaning before and between samples, because each sample is injected from a different well using a separate tip so that no carry-over exists within the spray source. The main difference between nano-ESI and traditional ESI is the flow rate: common flow rates for traditional ESI are 2–4 μL min−1, while the flow rate for nano-ESI used during this study was 300 nL min−1. The flow rate for nano-ESI varies based on sample viscosity, voltage applied and gas pressure. The voltage applied here was 1.48 kV and the gas pressure was 0.6 psi (4.14 kPa), allowing for a constant flow rate (monitored throughout the course of each analysis) for all samples analyzed.
The nano-ESI ion source utilizes chip-based infusion to charge the analyte droplets before they enter the capillary of the FTICR-MS. Chip-based infusion is achieved by placing a charge on a plate, which the analyte then passes through and becomes ionized. The optimal analysis conditions for all samples were investigated. Prior to injection all methanol extracts were diluted by 25% with LC/MS-grade water and acidified to a pH of 6 using formic acid, to increase ionization efficiencies in positive ion mode. Each sample was loaded into the Advion well plate for injection directly before analysis, to reduce possible contamination or evaporation. Approximately 30 μL of each sample was loaded into each well plate, and 10–20 μL of each sample was injected during analysis. Broadband mass spectra in positive ion mode were acquired over a period of 45 min. An ion accumulation time of 1.0 s was used in the storage hexapole prior to transferring ions to the ICR cell, where 450 scans (collected with a 4 MWord time domain) were co-added. The free induction decay signal was zero-filled once and sine-bell apodized prior to Fourier transformation and magnitude calculation by the Bruker Daltonics data analysis software.
Post-acquisition data treatment
Each mass spectrum was externally calibrated using a 50:50 mixture of 400 Da and 600 Da average molecular weight polyethylene glycol (PEG) standard. Internal calibration of the acquired mass spectra was achieved using numerous CH2 homologous series identified by Kendrick mass defect (KMD) analysis that spanned the m/z region of 200–700. Mass lists (of peaks with a signal-to-noise (S/N) ratio >4) were processed via a molecular formula calculator to determine all possible C, H, O, N, S and Na molecular formulas for each m/z value, within a maximum error of 1.0 ppm. Instrumental and extraction blanks were also analyzed to eliminate possible contaminants from the solvents and extraction methods. The instrument blank consisted of 3:1 methanol:water with formic acid, while the method blanks were acidified LC/MS-grade water samples that were extracted (with either PPL or C18) using the same procedures followed for each ice-core meltwater sample. Peaks occurring in either blank as well as the sample spectra were removed from further analysis if the m/z values matched within 1 ppm of each other. The formula rules applied by Reference StubbinsStubbins and others (2010) were followed to ensure that chemically possible molecular formulas were assigned to the peaks in the samples’ mass spectra. At higher m/z values, unambiguous formula assignment was not possible because several molecular formulas existed for the same m/z value. To assist in duplicate removal, the ‘formula extension’ approach (as described in Reference Kujawinski and BehnKujawinski and Behn, 2006) was utilized with homologous series of CH2, CHO and CH2O groups. Approximately 10% of the m/z values remained unassigned for each sample due to the large number of duplicate formulas and they were removed from further consideration.
Results and Discussion
To date, the most commonly used extraction technique for DOM in ice samples has been C18 extraction, a technique that is efficient in the isolation and recovery of meltwater DOM (Reference Grannas, Hockaday, Hatcher, Thompson and Mosley-ThompsonGrannas and others, 2006; Reference Bhatia, Das, Longnecker, Charette and KujawinskiBhatia and others, 2010). However, in these previous studies, large sample volumes (>1 L) were extracted. Here we investigate whether the use of smaller volumes (<100 mL) is plausible. Our first approach was to employ conventional direct infusion ESI on small volume meltwater samples that were rotary evaporated to concentrate the DOM to suitable levels and to then employ the mass spectral acquisition procedures of Reference Sleighter, McKee and HatcherSleighter and others (2009). Because of the natural presence of low concentrations of salts, direct analysis following rotary evaporation yielded uninformative mass spectra containing peaks not attributed to organic matter. Efficient ionization of the salts reduces the ionization efficiency of the (smaller concentration) DOM and thus greatly reduces the instrumental sensitivity. Thus, use of SPE was deemed necessary to obtain high-quality mass spectra. With SPE, the DOM in the ice meltwater is sorbed to the resin and eluted into a smaller volume, whereupon it becomes more concentrated and subsequently amenable to ESI. From our preliminary studies of the concentrated SPE extracts, we determined that additional sensitivity was required to analyze the extracted DOM because of the low levels of organic carbon present in these samples. Thus, we employed nano-ESI, which yields lower limits of detection for FTICR-MS (Reference Schmidt, Karas and DülcksSchmidt and others, 2003; Reference Kim, Rodgers, Blakney, Hendrickson and MarshallKim and others, 2009). In light of our results we discuss below the application of nano-ESI implemented by an Advion Triversa Nanomate system. We examine extracts that were obtained by both C18 and PPL SPE.
Central to the concept of comparisons discussed below is the reliability with which peaks can be observed in replicate analyses and differentiated from peak variabilities encountered in different samples. Reproducibility of the nano-ESIFTICR-MS method was investigated by analyzing the AD 1360 C18 extract by two replicate analyses. The sample was loaded into one sample well location and analyzed twice using a new spray tip and nozzle for each analysis. Figure 1 shows the broadband mass spectra at 200–800 m/z for both acquisitions and the two insets show expanded regions at 399–407 m/z and 407.0–407.4 m/z. Nearly identical mass spectra are observed across the entire mass range, indicating that the reproducibility of the positive ionization mode nano-ESI-FTICR-MS method is satisfactory for this study. Specifically, 77% of peaks at S/N ≥ 4 were common to both spectra at 300–600 m/z (75% were common at 200–700 m/z), calculated according to the method presented by Reference Sleighter, Chen, Wozniak, Willoughby, Caricasole and HatcherSleighter and others (2012). Reference Sleighter, Chen, Wozniak, Willoughby, Caricasole and HatcherSleighter and others (2012) suggest that for replicate analyses to be considered reproducible, a minimum of 67% of S/N threshold-corrected peaks (in this case peaks detected at S/N ≥ 4 and correcting for the strict S/N cut-off using S/N ≥ 2.5, as recommended) must be common among replicate samples. The results presented here surpass that recommendation. While we did not investigate the reproducibility associated with splitting the ice-core sample into two separate volumes and extracting each independently, we have little reason to believe that doing so will generate different datasets (Reference Sleighter, Chen, Wozniak, Willoughby, Caricasole and HatcherSleighter and others, 2012).
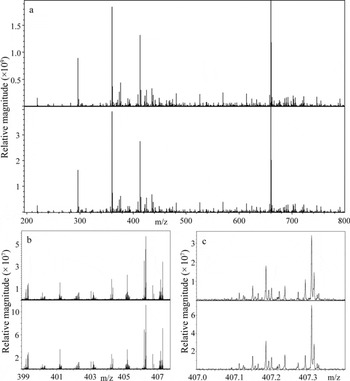
Fig. 1. Replicate analyses of the PPL-extracted GISP2 AD 1360 ice-core meltwater analyzed by positive ion mode nano-ESI-FTICR-MS, highlighting high spectral reproducibility at (a) 200–800 m/z, (b) 399.0–407.5 m/z and (c) 407.0–407.4 m/z. The top and bottom spectra correspond to analyses using 300 and 450 scans, respectively, while all other instrumental parameters were held constant.
Nano- ESI-FTICR-MS
Figure 2 shows the broadband mass spectrum obtained by the Advion nano-ESI system for the C18-extracted AD 1660 core (90 mL) and compares this with the C18 extract of a large ice-core meltwater sample (900 mL) examined previously by Reference Grannas, Hockaday, Hatcher, Thompson and Mosley-ThompsonGrannas and others (2006). It should be noted that these are samples isolated from two different cores and that the comparison here is only shown to discuss overall spectral quality when large and small volumes of meltwater are extracted. Most peaks detected are distributed between 300 and 700 m/z and occur at an odd nominal mass due to H+ or Na+ addition to a neutral molecule containing zero or an even number of nitrogen atoms, which is consistent with the data reported by Reference Grannas, Hockaday, Hatcher, Thompson and Mosley-ThompsonGrannas and others (2006). Even nominal mass peaks are attributed to either compounds containing an odd number of nitrogen atoms or 13C isotopes. Typical resolving powers at nominal mass 401 were ∼400 000, but at lower m/z, higher resolving powers(>600 000 at m/z 340) were achieved. It is important to note that at each nominal mass unit across the entire region of 200–700 m/z, clusters of peaks (>10) are present throughout (expanded mass region insets of Figs 1 and 2). This pattern is characteristic of DOM (Reference Mopper, Stubbins, Ritchie, Bialk and HatcherMopper and others, 2007) and is observed for all ice-core samples analyzed.
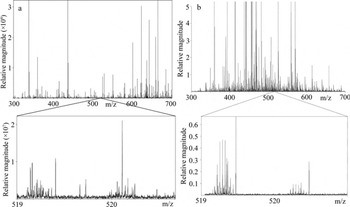
Fig. 2. The mass spectra of (a) the C18 extract of 90 mL of GISP2 AD 1660 ice-core meltwater analyzed by positive ion mode nano-ESI FTICR-MS and (b) the C18 extract of 900 mL of Franz Josef Land ice-core meltwater (AD 1950) analyzed by positive ion mode ESI-FTICR-MS and reported by Reference Grannas, Hockaday, Hatcher, Thompson and Mosley-ThompsonGrannas and others (2006).
As shown in Figure 2a and b, the mass spectra acquired in this study are of comparable quality to those obtained in a previous ice-core DOM study, but required only a tenth of the sample volume due to the advantages of increased sensitivity provided by coupling nano-ESI to FTICR-MS. Spectral quality is assessed by examining the distribution of peaks across the m/z range of 200–700. Based on previously published work and our own experience with various DOM sample analyses, clusters of peaks (>10) should be observed at each nominal mass unit. Additionally, for peaks with sufficient magnitude (typically S/N ≥ 10), the 13C isotope peak should be observed at 1.0034 m/z units higher than the 12C analog. There should also be little evidence of salts (peaks at high mass defect). Additional details specific to the analysis of DOM via FTICR-MS can be found in Reference Sleighter, Hatcher and NikoliáSleighter and Hatcher (2011). Previous studies by Reference Grannas, Hockaday, Hatcher, Thompson and Mosley-ThompsonGrannas and others (2006) and Reference Bhatia, Das, Longnecker, Charette and KujawinskiBhatia and others (2010) used ∼900 mL and 0.5–15.0 L of ice meltwater, respectively, for C18 extraction and subsequent analysis by ESI-FTICR-MS. Vertical resolution within an ice core can therefore be enhanced because of the improved sensitivity of nano-ESI-FTICR-MS, requiring less meltwater for extraction. Here we have determined that a 90 mL meltwater sample that has been extracted by C18, eluted in 10 mL of methanol and concentrated by a factor of ten via rotary evaporation is sufficient for analysis by nano-ESI-FTICR-MS, based on the data from Figure 2a. The volume used (90 mL) could likely be reduced further based upon the amount of sample that is actually consumed during instrumental analysis. Anticipating that smaller volumes can be used allows for possible future studies to consider examining more narrowly spaced vertical sections of an ice core, thus providing new data on the changes in DOM during small increments of time. Automation techniques are now also feasible using the Advion Triversa Nanomate system, which can allow larger sample sets to be examined, while reducing the time required for an individual to operate the instrument.
Analysis of Greenland ice-core samples extracted by PPL and C18
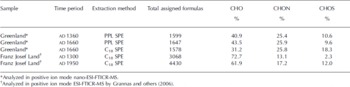
The molecular formula distribution for the C18 and PPL extracts of the Greenland ice-core samples used in this study yielded a broad range of formula types (Fig. 3a). Data in Figure 3a have been corrected to reflect their neutral molecule (i.e. either H or Na was removed depending on whether the ion was formed via protonation or sodiation during ionization). For the two PPL extracts (AD 1360 and AD 1660), 69–73% of formulas contained Na, while the remainder were due to protonation. However, the C18 extract (AD 1660) had 52% of the formulas due to sodiation. It is interesting to note that very few compounds were ionized by both protonation and sodiation. Fewer than ten formulas in each of the PPL extracts yielded identical formulas that were protonated and sodiated, while only 33 formulas appeared as protonated and sodiated in the C18 extract. Most formulas assigned contain only CHO atoms, while N-containing formulas (CHON, CHONS) are the next abundant group, as expected in positive ion mode which favors basic functionalities. Formulas without oxygen account for only about 5% of the assigned formulas. The PPL-extracted samples behave similarly to one another, while the C18-extracted sample contains a higher proportion of CHOS formulas. The formula distributions for the samples of the GISP2 core site are in agreement with the previous study by Reference Grannas, Hockaday, Hatcher, Thompson and Mosley-ThompsonGrannas and others (2006), as shown in Table 1.
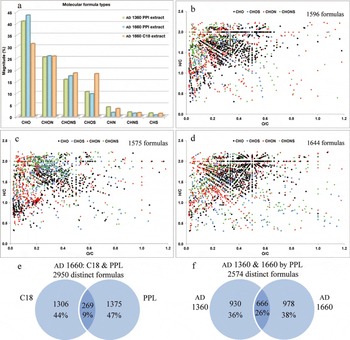
Fig. 3. The types of molecular formulas given as the percentages of spectral magnitude (a) and as Van Krevelen plots for (b) the PPL-extracted AD 1360 GISP2 ice core, (c) the C18-extracted AD 1660 GISP2 ice core and (d) the PPL-extracted AD 1660 GISP2 ice core. Comparisons of the formulas in the different DOM samples are illustrated by Venn diagrams that evaluate the formulas that are unique and common to (e) the C18- and PPL-extracted AD 1660 core and (f) the PPL extractions of the AD 1360 and AD 1660 cores.
Table 1. Molecular formula distribution for the Greenland ice-core samples extracted by PPL and C18 SPE and analyzed by positive ion mode nano-ESI-FTICR-MS, compared with the previously published data from Reference Grannas, Hockaday, Hatcher, Thompson and Mosley-ThompsonGrannas and others (2006)
Reference Kim, Kramer and HatcherKim and others (2003b) highlighted the benefit of plotting formulas on a Van Krevelen diagram to characterize the biomolecular classes of the DOM based upon their O/C and H/C ratios. Figure 3b–d shows these plots, colored according to the various elemental families (e.g. CHO, CHON, CHONS and CHOS). For simplicity, the CHN, CHS andCHNS formulas are not shown on the plots. Most of the formulas characterized in these Greenland samples have an H/C ratio >1.0 and O/C ratio <0.6, with some formulas having O/C ratios up to 1.2 and H/C ratios as low as 0.4. Low H/C ratios are indicative of aromatic structures while high H/C ratios are characteristic of more aliphatic structures. Overall, the ice-core DOM is mostly of aliphatic character with low oxygenation.
The Van Krevelen plots for the AD 1360 and AD 1660 PPL extracts (Fig. 3b and d) are more similar to each other than they are to the AD 1660 C18 extract (Fig. 3c). When examining the molecular formula assignments more closely, the AD 1660 PPL and C18 extracts had only a 9% overlap, with the PPL having 47% peaks unique to its extraction and the C18 extract having 44% (Fig. 3e). In contrast, when comparing the two PPL extracts of AD 1360 and AD 1660 ice-core meltwater, a 26% overlap was observed, with the remaining 74% unique formulas being split nearly equally between the two different ages (Fig. 3f). Based on this finding, we have determined that the C18 and PPL extractions of this DOM are complementary to one another and that these two extraction protocols could be used in conjunction so that more molecular-level information is gained during characterization. However, it should be noted that in any FTICR-MS analysis a complete and quantitative characterization of DOM is not currently possible. This is due to two main factors: (1) the desalting and isolation methods used (e.g. SPE) will fractionate the DOM based on the polarity of the solid-phase sorbent chosen; and (2) the ionization method will preferentially ionize certain molecules/functional groups over others. It has been a common and successful practice, however, to examine samples treated and analyzed in the same manner for relative comparison purposes. The choice to use a single isolation or ionization method will still result in a robust dataset that is useful for comparative purposes among various samples. One main issue confronting an FTICR-MS user is the inherent complexity of the samples and the large datasets generated from FTICR-MS analysis. Although using additional and complementary methods of isolation or ionization for a given sample will result in more information, the investigator will need to decide when the need for the data outweighs the labor necessary to process that data.
Assessing carbon oxidation state
The oxidizing environments governing the changes of DOM in the atmosphere have recently been investigated by Reference KrollKroll and others (2011) and they present a new way of expressing these changes using both carbon number (nc) and carbon oxidation state (OSc). Changes in molecular composition can be evaluated by observing processes such as oligomerization (increase in nc with no change in OSc), functionalization (increase in OSc with no change in nc) and fragmentation (decrease in nc and increase in OSc). The majority of the OSc values calculated for the CHO formulas in the two PPL extracts of the AD 1360 and AD 1660 ice cores studied here were in the range −2 to +1, resembling those of highly oxidized organic aerosols produced by multistep oxidation reactions (Reference KrollKroll and others, 2011). The magnitude-weighted average OSc values for all CHO formulas for the AD 1660 ice-core sample (−0.8) and AD 1360 ice-core sample (−0.9) fall within the range of several organic aerosols reported by Reference KrollKroll and others (2011), such as water-soluble organic carbon in rainwater (−0.9 ≤OSc ≤−0.7) and biomass-burning aerosols (−1.0 ≤OSc ≤−0.7). These calculations are in agreement with the hypothesis of Reference Grannas, Hockaday, Hatcher, Thompson and Mosley-ThompsonGrannas and others (2006) that the organic matter characterized in these samples is likely from atmospheric deposition. The magnitude-weighted average OSc value increases from −0.9 to −0.8 and the magnitude-weighted average nc value decreases from 26.0 to 23.5 in the AD 1360 and AD 1660 PPL samples, respectively. However, the significance of these differences cannot be established with this small dataset and we are currently analyzing a larger suite of samples in order to establish typical OSc and nc ranges for ice-core DOM. The approach used by Reference KrollKroll and others (2011) to quantify the OSc and nc has not previously been applied to DOM in ice cores, but these initial studies indicate that analysis of data in this manner may be a useful tool for comparing samples as a function of time, location or depositional environment.
Conclusions
The study conducted here has highlighted the ability to analyze small volume ice-core meltwater samples (∼90 mL) from a central Greenland site using nano-ESI-FTICR-MS and has provided results comparable with previous ice meltwater studies that required ∼5 to >10 times the amount of ice meltwater. Data of sufficient quality can be generated by this analysis method and used for subsequent investigation of DOM character and properties. The ability to extract and examine volumes smaller than those used in previous studies extends the likelihood of successfully resolving temporally induced chemical differences in the DOM within an ice core. We also show that utilizing two different resins for extracting and concentrating the DOM yields complementary information, because different molecular formulas are detected depending on the extraction method used (C18 versus PPL SPE).
We have applied data analysis methods recently reported in the atmospheric aerosol community to the DOM characterized here and have shown that this method appears to be useful in the characterization of ice-core organic material. Further investigation and analysis of a wider variety of samples are necessary to establish the utility of this method and to determine how the changes in DOM character might be correlated to specific changes in the paleoclimate record. The ability shown here to analyze small volumes of ice-core meltwater using nano-ESI-FTICRMS expands our capabilities to characterize samples of small volume and low carbon content.
Acknowledgements
This work was supported by the US National Science Foundation Antarctic Glaciology Program (ANT-0739691 and ANT-0739684). We thank Mark Twickler of the USGS NICL for assistance in the ice-core selection process and Nicole Harmuth for assistance in the method development stages of this research project. We also thank the COSMIC facility at Old Dominion University for assistance with mass spectral data collection and analysis. We appreciate the thoughtful comments of Becky Alexander and an anonymous reviewer on the manuscript.


