

6.1 Introduction
The exploitation of wild animals for their meat continues throughout the tropics and subtropics. This is an activity of crucial importance that continues to buttress the food security and livelihoods of many millions of people (Chapter 1). Even at varying stages of transition to agriculture, modern hunter-gatherers still exploit animal populations for food (Chapter 1), being able to continue doing this if extraction is in balance with production. Likewise, numerous rural peoples still depend on wild meat, as we show in Chapter 2. Ensuring that supply matches demand for wild meat from those human populations still living in or near natural ecosystems remains a central question; we discuss the issue of sustainability in more detail in Chapter 5.
In this chapter we offer an overview of the impact of hunting on prey populations in the world’s tropical and subtropical regions. We first present what estimates are available of wild meat extraction levels for areas where information exists, followed by a discussion of spatial patterns of wild meat extraction at a regional scale. We then focus on the existing evidence for how overhunting can reduce prey populations and change species assemblages. What drives wild meat exploitation is then discussed and we end the chapter by summarizing the evidence on the effects of anthropogenic faunal loss, or defaunation, on wider ecosystem processes and functions.
6.2 Global Wild Meat Extraction Estimates
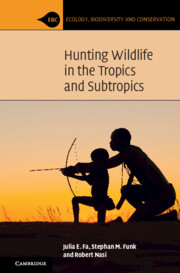
Data on the biomass of animals harvested in different localities throughout the tropics and subtropics are generally rare, particularly for Southeast Asia. Most published hunting studies tend to concentrate on listing the animal species that are removed from a particular study area but often do not specify the number of animals or the biomass (kg) extracted per unit hunting area. This is because information on the numbers of animals hunted is often taken from hunter reports and hunting territories are not generally measured. However, from a compilation of studies, albeit relatively small, Robinson and Bennett (Reference Robinson and Bennett2004) examined the supply of and demand for wildlife resources across the rainfall gradient in relatively undisturbed ecosystems, generating estimates of the biomass of wild mammals (rodents, primates and ungulates) in evergreen wet and moist forests (rainforests), deciduous dry forest and grassland savanna. From these results, extraction rates were highest (744 ± 1,030 kg/km2, n = 4 sites) in grasslands, followed by evergreen wet and moist forests (168 ± 193 kg/km2, n = 14 sites) and lowest in deciduous dry forests (126 ± 150 kg/km2, n = 4 sites). In evergreen wet and moist forest sites where human population sizes are available (from Robinson & Bennett Reference Robinson and Bennett2004), the biomass harvested per person is positively correlated with rainfall (Fig. 6.1).

Figure 6.1 Biomass (kg/km2) of ungulates, primates and rodents harvested in different tropical habitats in relation to rainfall
Information from 36 African rainforest sites compiled in Fa et al. (Reference Fa, Ryan and Bell2005) show that from 40 to 12,168 carcasses are extracted annually per site (average 2,060 carcasses/yr per site or 240 kg/yr to 84,100 kg/yr), translating into a mean harvest rate per hunter of between 101 to 165 carcasses/yr and biomass of 946–1,610 kg/yr. Such variation in the number of carcasses hunted per year is a function of hunter numbers and provisioning conditions of each habitat. The impact of hunting intensity, forest structure and hunting history clearly influences prey standing biomass and the extraction potential in each habitat. But, even though habitat type and disturbance may affect animal numbers (see Chapter 2) there are major differences in populations of large-bodied vertebrates in hunted and unhunted Neotropical forests (Bodmer et al. Reference Bodmer, Aquino, Puertas, Reyes, Fang and Gottbenker1997; Cullen Jr et al. Reference Cullen, Bodmer and Pádua2000; Glanz Reference Glanz, Robinson and Redford1991; Mena et al. Reference Mena, Stallings, Regalado, Cueva, Robinson and Bennett1999; Peres Reference Peres1990, Reference Auzel1996, Reference Akçakaya and Sjögren-Gulve2000; Wright et al. Reference Wright, Zeballos, Domínguez, Gallardo, Moreno and Ibáñez2000), suggesting that the impact of hunters is paramount.
In all tropical regions where hunting of wildlife for meat occurs (Chapter 1), most prey animals are mammals, and among these the highest proportion is of ungulates (Coad et al. Reference Coad, Fa and Abernethy2019). In a meta-analysis of hunting in Afrotropical forests in West and Central Africa, Fa et al. (Reference Fa, Ryan and Bell2005) showed that as many as 71 mammal species were hunted in a total of 30 sites in 7 countries: 22 primates (5 families), 18 ungulates (4 families), 13 rodents (4 families), 12 carnivores (4 families), 3 pangolins, and 1 species each of elephant, hyrax and aardvark. For all sites pooled, ungulates (47%), followed by rodents (37%), were the most frequently taken taxonomic groups. Ungulates provided 73% in weight, while other groups significantly less. Small- (2.0–4.9 kg) and medium-sized (5–14.9 kg) species supplied more carcasses to the total kills (32.4% and 30.0%, respectively) than larger-bodied (15.0–99.9 kg) ones (21.6%). Large mammals alone made up 54.5% of total biomass extracted per year. Overall, the average estimated mammalian biomass extracted per year per site was almost 16,000 kg. Because most hunting is undertaken by non-discriminatory snares (where very few species, most of them primates, are shot), the relationship between the estimated average harvest rates per species correlated with body mass of the hunted groups. The smallest prey were arboreal species whilst the heaviest were almost exclusively terrestrial and a total of 32 out of the 36 terrestrial species were snared, whereas 13 of the 21 arboreal species were shot. The resulting pattern was a negative correlation between body mass and harvest rates for carnivores and ungulates, positive for rodents and curvilinear (inverted U-shape) for primates (Fig. 6.2). Smaller carnivores and ungulates but larger rodent species are therefore more susceptible to being caught in snares, whereas mid-sized primates are more likely to be shot. Smaller primates, mostly nocturnal (e.g. galagos) and larger ones (gorillas and chimpanzees) are rarely sought out by hunters, the former because of their lower cost-effectiveness and the latter because it requires more specialized hunting abilities to take down. Overall, there is some evidence that wild meat extraction, according to the data in Fa et al. (Reference Fa, Ryan and Bell2005), is less driven by hunters choosing which prey to hunt, but by the hunting method employed.

Figure 6.2 Regressions showing the relationship between species body mass and mean number of carcasses extracted per year of: (a) carnivores, (b) primates; (c) rodents; (d) ungulates.
As a consequence of mostly using snares and the effects of these as shown above, harvest rates are not correlated with the abundance of the species in the habitat except for ungulates (Fa et al. Reference Fa, Ryan and Bell2005). This can be explained by the fact that in West and Central African forests most of the terrestrial mammalian faunas are bovids (see Chapter 2), which are highly abundant particularly the smaller duikers, their larger densities saturating traps before other terrestrial species. In terms of which dietary categories of mammals were hunted in West and Central Africa, Fa et al. (Reference Fa, Ryan and Bell2005) and later confirmed by Petrozzi et al. (Reference Petrozzi, Amori and Franco2016) showed that frugivore–herbivores and frugivore–granivores were mostly impacted, both in terms of number of carcasses and biomass, with most harvested species being rodents and ungulates. Not surprisingly, the average number of hunters operating per 100 days (hunter presence in Fa et al. Reference Fa, Ryan and Bell2005) in a site is significantly positively correlated with biomass harvested. Biomass hunted is also highly correlated with the susceptibility of a species to be hunted, or hunter ease, in Fa et al. (Reference Fa, Ryan and Bell2005), as a measure of the vulnerability of a species to hunting as determined by the size of the prey animal (since larger animals are more conspicuous), whether arboreal or terrestrial, and the species’ speed of movement. Similarly, carcass numbers were not correlated with hunter presence, but were highly correlated with hunter ease, pointing to the overriding importance of vulnerability of prey species.
In a more recent meta-analysis of 82 studies on 254 mammal and 1,640 bird species from across the tropics, hunting was shown to be less intense for larger-bodied than smaller-bodied species of mammals, particularly among carnivores and frugivores, than for herbivores, insectivores and generalists/omnivores (Osuri et al. Reference Osuri, Mendiratta, Naniwadekar, Varma and Naeem2020). In the same study, body size was either unrelated or weakly negatively related among birds across disturbance types (hunting, forest conversion and forest degradation) and across most dietary guilds, with the exception of herbivore/granivore and carnivore species. The most significant generalization is that large forest mammals make up the bulk of the hunted biomass in most sites and these large-bodied species are the most susceptible to over-exploitation. Such vulnerability may not be only due to the size of the animal but also due to its behaviour, for example, living in social groups or loud vocalizations may make the species more easily found by hunters (Fitzgibbon Reference Fitzgibbon and Caro1998; Infield Reference Infield1988). Nonetheless, extraction levels will logically correlate with the density of hunters operating in an area, thus if hunter presence is not too intense, adjacent large tracts of undisturbed forest can replenish exploited areas, restocking prey populations and therefore contributing to the sustainability of hunting (Fa & Peres Reference Fa, Peres, Reynolds, Mace, Redford and Robinson2001). But, heavy hunter presence, deforestation and habitat fragmentation in an area disrupts such source–sink dynamics (Novaro et al. Reference Novaro, Redford and Bodmer2000), leading to over-exploitation of animal populations. Often, large mammals and birds, which tend to disappear first, are frugivores (including frugivore–granivores, frugivore–herbivores and frugivore–omnivores) and important in seed dispersal (Abernethy et al. Reference Abernethy, Coad, Taylor, Lee and Maisels2013; Wright et al. Reference Wright, Zeballos, Domínguez, Gallardo, Moreno and Ibáñez2000). Their absence can have severe impacts on the long-term future of tropical forests.
6.3 Evidence of Sustainability
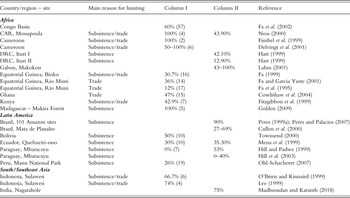
Published studies of the sustainability of extraction in tropical forests (Table 6.1), which have compared estimated productivity and offtake rates, show that in most cases hunting appears to be unsustainable. In most cases, more than half of the species considered in each study was unsustainably hunted; in situations where the number of species was low, more than 50% and up to 100% of these were unsustainably hunted. These figures attest to unsustainable extraction of wildlife in all circumstances where hunting has been studied. How representative these studies are cannot be assessed. Sustainability in most of the studies included in Table 6.1 has been measured using the Robinson and Redford (Reference Robinson, Redford, Robinson and Redford1991b) index, which has inherent problems (see Mayor et al. Reference Mayor, Bodmer and Bowler2016; van Vliet & Nasi Reference Van Vliet and Nasi2008a; Chapter 5) that may affect the results. Sustainable extraction is thus likely to occur in very remote locations, areas sparsely populated by humans, or beyond the influence and attraction of external markets. By contrast, locations such as ‘mature’ markets in Ghana (Cowlishaw et al. Reference Cowlishaw, Mendelson and Rowcliffe2004) can still contain a number of sustainably hunted species, large rodents in particular, given that larger species have been overhunted and smaller species can be exploited for longer. Evidence that animal populations are impacted by hunting can be derived from population density estimates of target species have been suggested as an indicator of sustainability (see e.g. Cawthorn & Hoffman Reference Cawthorn and Hoffman2015; Chapter 5). This assertion is perhaps equivocal since it is expected that hunted areas will be lower in density but the decline in stocks may not reflect unsustainable use. Estimates of standing stocks of mammals in a large number of Amazonian localities that have been hunted to varying degrees clearly show that they are affected by hunting pressure and forest type (Peres Reference Peres, Robinson and Bennett1999a; Fig. 6.3). Thus, it is not possible to determine whether these species assemblages have been hunted unsustainably or otherwise, since sustainability can only be determined as the difference between production and extraction.

Figure 6.3 Total density and biomass (mean ±SD) of game populations in four different size classes subjected to varying levels of hunting pressure. For significant analyses of variance of log(e)-transformed density and biomass data, means are compared within each size class and across different levels of hunting; means that share the same letter do not differ significantly (p < 0.005) according to a Tukey multiple comparison test.
Table 6.1 Estimated sustainability and decline in population densities of mammals due to hunting (taken from Cawthorn and Hoffman Reference Cawthorn and Hoffman2015)
| Country/region – site | Main reason for hunting | Column I | Column II | Reference |
|---|---|---|---|---|
| Africa | ||||
| Congo Basin | 60% (57) | Fa et al. (Reference Aviram, Bass and Parker2002) | ||
| CAR, Mossapoula | Subsistence/trade | 100% (4) | 43.90% | Noss (Reference Noss, Robinson and Bennett2000) |
| Cameroon | Subsistence/trade | 100% (2) | Fimbel et al. (Reference Fimbel, Curran, Usongo, Robinson and Bennet1999) | |
| Cameroon | Subsistence/trade | 50–100% (6) | Delvingt et al. (Reference Delvingt, Dethier, Auzel, Jeanmart and Delvingt2001) | |
| DRC, Ituri I | Subsistence | 42.10% | Hart (Reference Hart, Robinson and Bennett1999) | |
| DRC, Ituri II | Subsistence | 12.90% | Hart (Reference Hart, Robinson and Bennett1999) | |
| Gabon, Makokou | 43–100% | Lahm (Reference Lahm, Weber, White, Vedder and Naughton-Treves2001) | ||
| Equatorial Guinea, Bioko | Subsistence/trade | 30.7% (16) | Fa (Reference Broughton1999) | |
| Equatorial Guinea, Rio Muni | Trade | 36% (14) | Fa and Garcia Yuste (Reference Fa and García Yuste2001) | |
| Equatorial Guinea, Rio Muni | Trade | 12% (17) | Fa et al. (Reference Dublin, Sinclair and Arcese1995) | |
| Ghana | Trade | 47% (15) | Cowlishaw et al. (Reference Cowlishaw, Mendelson and Rowcliffe2004) | |
| Kenya | Subsistence/trade | 42.9% (7) | Fitzgibbon et al. (Reference Fitzgibbon, Mogaka, Fanshawe, Robinson and Bennett1999) | |
| Madagascar – Makira Forest | Subsistence | 100% (5) | Golden (Reference Golden2009) | |
| Latin America | ||||
| Brazil, 101 Amazon sites | Subsistence | 90% | Peres (Reference Peres, Robinson and Bennett1999a); Peres and Palacios (Reference Peres and Palacios2007) | |
| Brazil, Mata de Planalto | 27–69% | Cullen et al. (Reference Cullen, Bodmer and Pádua2000) | ||
| Bolivia | Subsistence | 50% (10) | Townsend (Reference Townsend, Robinson and Bennett2000) | |
| Ecuador, Quehueiri-ono | Subsistence | 30% (10) | 35.30% | Mena et al. (Reference Mena, Stallings, Regalado, Cueva, Robinson and Bennett1999) |
| Paraguay, Mbaracayu | Subsistence | 0% (7) | 53% | Hill and Padwe (Reference Hill, Padwe, Robinson and Bennett1999) |
| Paraguay, Mbaracayu | Subsistence | 0–40% | Hill et al. (Reference Hill, McMillan and Farina2003) | |
| Peru, Manu National Park | Subsistence | 26% (19) | Ohl-Schacherer (Reference Ohl-Schacherer, Shepard, Kaplan, Peres, Levi and Yu2007) | |
| South/Southeast Asia | ||||
| Indonesia, Sulawesi | Subsistence/trade | 66.7% (6) | O’Brien and Kinnaird (Reference O’Brien, Kinnaird, Robinson and Bennett1999) | |
| Indonesia, Sulawesi | Subsistence/trade | 74% (4) | Lee (Reference Lee, Robinson and Bennett1999) | |
| India, Nagarahole | 75% | Madhusudan and Karanth (Reference Madhusudan, Karanth, Robinson and Bennett2018) |
Abbreviations: CAR = Central African Republic; DRC = Democratic Republic of Congo.
Column I: percentage of species hunted unsustainably (number of species studied). Sustainability indicators reported here are generally determined through the examination of the relationship between estimated productivity and off-take rates.
Column II: percentage by which densities of target species are lower in moderately to heavily hunted forests than in un-hunted forest.
6.4 Drivers of Extraction
Given the trends in human populations and infrastructure growth, impending large-scale degradation of ecosystem structure and content are underway in tropical forest regions. However, understanding what drives the ever-increasing extraction of wild meat, currently the most pervasive human activity in large forest blocks, is essential.
6.4.1 Wealth and Proximity to Wildlife Areas
Wild meat extraction patterns as described above are driven by a number of economic, social, geographic or other factors that reflect the scale of human reliance on wildlife. Brashares et al. (Reference Brashares, Golden, Weinbaum, Barrett and Okello2011) point out that wild meat can be viewed as an ‘inferior good’ or a ‘normal good’. As an ‘inferior good’, poorer, rural households would typically consume more wild meat than wealthier, urban households because wildlife provides a cheap and accessible source of food and income. In contrast, as a ‘normal good’, wild meat, like most household goods, would increase as household wealth grows. These two perspectives, although informative, oversimplify the reasons for wildlife consumption since there are a number of interacting and dynamic factors involved (Brashares et al. Reference Brashares, Golden, Weinbaum, Barrett and Okello2011). Overall, inhabitants of poorer rural areas have greater access to wildlife and the price of wild meat relative to alternative foods is lower. Using data across 2,000 households and 96 settlements in four countries in Africa Brashares et al. (Reference Brashares, Golden, Weinbaum, Barrett and Okello2011) present evidence of the link between household wealth and wildlife consumption. Results from this study indicate that the least wealthy households in rural settings consistently consume greater amounts of wild meat (Fig. 6.4a), whereas wealthier households show higher rates of consumption in urban settings (Fig. 6.4b). The split between urban and rural settings, as suggested by Brashares et al. (Reference Brashares, Golden, Weinbaum, Barrett and Okello2011), reflects considerable spatial variation in access to wildlife, as well as wild meat prices relative to those of alternative foods, and opportunity costs of time spent hunting, all of which are correlated with wealth measures. Conflicting results obtained in other studies may be due to the impact of the co-occurrence of spatial differences in wealth and wild meat consumption patterns.

Figure 6.4 Household wealth is (a) significantly and negatively related to consumption for the 500 most rural households and (b) positively related to consumption for the 500 most urban households.
Most available information on amounts of wild meat consumed relate to rural people (see Chapter 1) with only a few studies concentrating on urban settings (East et al. Reference East, Kümpel, Milner-Gulland and Rowcliffe2005; Fa et al. Reference Auzel2019; Wilkie et al. Reference Wilkie, Starkey, Abernethy, Effa, Telfer and Godoy2005). Comparisons between rural and urban wild meat consumption in Gabon showed that rural populations consumed significantly more wild meat (and less domestic meat) than did urban people (Wilkie et al. Reference Wilkie, Starkey, Abernethy, Effa, Telfer and Godoy2005). In a number of towns in Rio Muni, Equatorial Guinea, Fa et al. (Reference Bird, Bliege Bird and Codding2009) found that availability of wild meat differed substantially among localities, primarily depending on their location relative to forest areas. Despite these differences, overall meat intake was greater in wealthier households in all studied localities. However, because wealth distribution profiles differed significantly between sites, socio-economic conditions in the largest settlement, the city of Bata, influenced wild meat consumption in a distinct manner from the smaller, more rural sites. Reasons for this may be related to the fact that the substantially wealthier groups in Bata were consuming wild meat exclusively for prestige reasons. In contrast, wealth did not affect the likelihood of consuming domestic meats, and there was strong evidence that both site and wealth affected fish consumption: wealthier families were less likely to consume fish.
Until recently, urban consumption within the Amazon was not considered important and much of the emphasis had been placed on urban wild meat consumption in one city, Iquitos, in Peru (Bodmer & Lozano Reference Bodmer and Lozano2001). Based on this perception, for some time, urban wild meat consumption in Amazonia was regarded as negligible (Nasi Reference Nasi2001; Rushton et al. Reference Rushton, Viscarra, Viscarra, Basset, Baptista and Brown2005). Recent studies suggest that this is not the case since there are significant city markets in the region where many wild animal species are sold for human consumption. For example, in the Brazilian Amazon well-established wild-meat markets have been documented in Abaetuba (Chaves Baía Júnior et al. Reference Alves, Mendonça, Confessor, Vieira and Lopez2009) and in two pre-frontier cities in the region (Parry et al. Reference Parry, Barlow and Pereira2014). Estimates of about 473 tonnes of wild meat have been calculated as annually traded in a number of cities in the Amazonian tri-frontier (Brazil, Colombia and Peru) region according to Van Vliet et al. (Reference Van Vliet, Mesa, Cruz-Antia, de Aquino, Moreno and Nasi2014). Although studies documenting sale of wild meat in urban centres in Latin America are mounting, factors affecting wild meat consumption and trade in this region are still largely undescribed in comparison to African cities (Fa et al. Reference Bird, Bliege Bird and Codding2009). However, a few studies point to how the economic and cultural background of consumers in Amazonian cities, for example, affect how much wild meat is eaten (Chaves et al. Reference Chaves, Wilkie, Monroe and Sieving2017; Morsello et al. Reference Morsello, Yagüe and Beltreschi2015). El Bizri et al. (Reference El Bizri, Morcatty and Ferreira2020b) found that in a study of six urban wild-meat markets in Amazonas state, a significant proportion (80%) of urban dwellers buy and consume wild meat. In Brazilian cities close to forest areas, Parry et al. (Reference Parry, Barlow and Pereira2014) showed that the poorest urban households hunt to obtain wild meat, whereas wealthier residents buy it. This is because hunting is the cheaper option for poorer people in cities, but also because the lack of formal employment, more common among this group allows them to spend more time in this activity. In some Amazonian cities, urban hunters profit from the sale of up to 97% of their game to closed markets (Van Vliet et al. Reference Van Vliet, Cruz and Quiceno-Mesa2015). According to a further study by El Bizri et al. (Reference El Bizri, Morcatty and Ferreira2020b) only a low number of urban residents declared hunting wild meat in the study, indicating that rural hunters are the most active supplying city markets. This is because hunters from rural areas in Amazonia are mainly subsistence hunters, but may sell part of their hunting yields, to generate money to buy urban goods, such as clothes and foods (Antunes et al. Reference Antunes, Rebêlo and Pezzuti2019). For instance, in the Peruvian Amazon, Bodmer and Lozano (Reference Bodmer and Lozano2001) found that rural hunters sell around 7% of mammals hunted, whereas Morcatty and Valsecchi (Reference Morcatty and Valsecchi2015) found that around 21% of yellow-footed tortoises harvested by rural hunters in Amazonia were traded in urban wild meat markets. What is clear is that hunting wildlife for urban markets is a prerogative of rural inhabitants. The El Bizri et al. (Reference El Bizri, Morcatty and Ferreira2020b) study found that the proportion of rural inhabitants within a municipality was correlated with the proportion of inhabitants that declared consuming wild meat in cities, the reported frequency of consumption, and the prices per kilogram in the market. This pattern may be a result of the economic connectivity between urban and rural sectors in these municipalities. Thus, in municipalities where the rural population is larger, urban people are able to buy wild meat more frequently from rural people who hunt. Because these small cities are often isolated and only accessible by boat, domestic and processed products become more expensive due to higher transportation costs. As a consequence, wild meat prices are higher in small cities, where rural inhabitants outnumber urban ones, because trading in wild meat is one of the most prevalent and cost-effective activities in localities where agricultural commodities do not have a large local market and are uncompetitive due to high costs and long transportation times (Wilkie et al. Reference Sirén and Wilkie2016).
Wild meat extraction (and therefore consumption) is related to proximity to harvestable wildlife populations (Brashares et al. Reference Brashares, Golden, Weinbaum, Barrett and Okello2011). According to the data in Brashares et al. (Reference Brashares, Golden, Weinbaum, Barrett and Okello2011) the effect of distance seems to disappear at 30 km or more, that is, consumption rates in settlements as close as 30 km to a wildlife harvest area were like those as far as 150 km away (Fig. 6.5a). Wild meat prices were cheaper around sites nearer to harvest areas, but higher in urban markets since having travelled some distance from its source after being sold to middlemen (Fig. 6.5b). From data for wild meat and domestic meat and fish in 52 markets Brashares et al. (Reference Brashares, Golden, Weinbaum, Barrett and Okello2011) showed this effect (Fig. 6.5b). The price of wild meat relative to alternative meat also increased with increasing distances from hunting areas.

Figure 6.5 (a) Distance of human settlements from harvestable wildlife populations in Ghana, Tanzania, Madagascar and Cameroon was a strong predictor of the amount of wild meat that households in those communities consume annually as well as (b) the price that consumers paid for wild meat in Ghana and Tanzania
Because wild meat prices increase with proximity to urban areas, those hunters who harvest wild meat nearer cities should gain relatively more from selling their catch than those hunters in more remote areas. Consequently, hunters closer to cities are more likely to sell rather than consume their quarry. Brashares et al. (Reference Brashares, Golden, Weinbaum, Barrett and Okello2011) showed that a high proportion (75–95%) of wildlife harvested in the settlements most isolated from commerce networks was consumed locally by the hunter’s household or neighbour. In contrast, hunters who lived within 10 km of an urban market sold more than 80% of their catch to outsiders.
6.4.2 Non-wealth Factors
As outlined in the section above, wild meat is consumed primarily by the rural poor who live closer to wildlife areas. People eat wild meat in rural localities because it is cheaper than other meat sources or simply because no alternatives are available in the marketplace (Apaza et al. Reference Apaza, Wilkie and Byron2002; Wilkie & Godoy Reference Wilkie and Godoy2001). Some studies have indicated that consumers prefer the taste of wild meat (Chardonnet et al. Reference Chardonnet, Fritz, Zorzi, Feron, Bissonette and Krausman1995; Trefon & de Maret Reference Trefon, de Maret, Bahuchet, Bley, Pagezy and Vernazza-Licht1999) or wish to add variety to their diet and consume it for special social events and occasions (Njiforti Reference Njiforti1996). Despite this variety of possible reasons that may motivate buyers to eat wild meat, most studies have focused on the socioeconomic background of consumers as the main reason underpinning their choice (Brashares et al. Reference Brashares, Golden, Weinbaum, Barrett and Okello2011; Wilkie & Godoy Reference Wilkie and Godoy2001). Findings relating to wealth show price and income have significant roles in determining the level of consumption of wild meat, fish, chicken and beef (Apaza et al. Reference Apaza, Wilkie and Byron2002; Wilkie & Godoy Reference Wilkie and Godoy2001; Wilkie et al. Reference Wilkie, Starkey, Abernethy, Effa, Telfer and Godoy2005). Nonetheless, as Brashares et al. (Reference Brashares, Golden, Weinbaum, Barrett and Okello2011) has indicated, household wealth is only weakly associated with eating wildlife, and, thus, such a lack of a strong correlation could be explained by the undisclosed importance of other factors. Wild meat consumption can therefore be affected by other factors such as age, gender and geographical setting (Hema et al. Reference Hema, Ouattara and Parfait2019; Luiselli et al. Reference Luiselli, Petrozzi and Akani2017). Luiselli et al. (Reference Luiselli, Hema and Segniagbeto2019), using face-to-face interviews in Togo, Nigeria, Burkina Faso and Niger, examined the possible links between wild meat consumption frequency and types eaten relative to the age and gender of consumers as well as the influence of settlement type, ecological and country setting. Significant differences were evident in consumption between rural and urban areas in all four countries but the proportion of persons not consuming any wild meat was highest in urban areas. This observation was explained not by gender differences but by young people consistently avoiding wild meat, especially in urban areas. The complicated interplay between tradition and evolution of social systems (especially the trends towards Westernization) may explain the different perceptions that people have towards consuming wild meat in the four studied countries. Hence, a unifying theory of wildlife consumption will require taking into account the many drivers underlying different peoples’ consumption practices, even specific to an intervention area, as suggested by Chausson et al. (Reference Chausson, Rowcliffe, Escouflaire, Wieland and Wright2019). An in-depth understanding of behaviours and practices is also needed. For example, in a study of urban settlements in the Colombian Amazon, Morsello et al. (Reference Morsello, Yagüe and Beltreschi2015) argue that beliefs, attitudes and social norms explained consumption and preference of wild meat in the study locations. They argue that, as in Nardoto et al. (Reference Nardoto, Murrieta and Prates2011) for Amazonian towns, that even though wild meat was not the preferred source of animal protein, it was routinely consumed in the studied towns because it was the local custom.
6.5 Spatial Patterns of Extraction
Data on the spatial extraction of different species used for food can be obtained from either wild meat market studies (Fa Reference Albrechtsen, Macdonald, Johnson, Castelo and Fa2007) or from records of prey taken by hunters in villages or camps (see Taylor et al. Reference Taylor, Scharlemann and Rowcliffe2015). Most studies documenting offtake, consumption and trade of wild meat in tropical forests have focussed on West and Central Africa with much less information for South American and Asian forests (see Coad et al. Reference Coad, Fa and Abernethy2019). Although the number of publications on wild meat use since the 1960s has increased significantly (see Chapter 1), most studies have targeted small catchment areas (often around single sites) over short time periods (but some regional assessments such as Fa et al. Reference Aviram, Bass and Parker2002 have been published) and limited data of wild meat extraction rates are available at a larger scale (and over longer time frames). Although such research may be affected by the lack of comparability between the studies used in the analysis, they still allow us to generate a broad understanding of wild meat extraction and availability patterns over large geographical areas. No doubt, these approximations will be further enhanced as more data becomes available. However, there is still a paucity of biological and socioeconomic data at a regional scale that can be used for determining patterns of wildlife exploitation to help decision-makers highlight areas that are at greater from unsustainable hunting (Ziegler Reference Ziegler2010). Thus, developing regional maps delimiting hotspots of wild meat extraction can pinpoint areas requiring conservation interventions, and ultimately assist in protecting forest ecosystem and their biodiversity. Such maps are a useful data visualization tool for communicating the current situation of wildlife subjected to hunting, of use for decision-makers, protected area managers and researchers. Such maps are useful representations of the state and future of the wild meat resource and the pressures acting upon it.
A first attempt to project large-scale wild meat extraction in a large region is the spatial analyses performed in Ziegler et al. (Reference Sandalj, Treydte and Ziegler2016) for Central Africa. These authors used data on the number of carcasses and species of mammals hunted in 27 sites between 1990 and 2007 in Cameroon, Central African Republic, Democratic Republic of Congo, Equatorial Guinea, Gabon and Republic of Congo. By examining the relationship between environmental and anthropogenic variables, they mapped (Fig. 6.6a) the intensity of wild meat extraction. Mean (±SD) annual total biomass offtake per recorded site was 25,657 ± 23,538 kg/yr (303–84,093 kg/yr). Catchment area sizes ranged between 45 km2 and 1,010 km2. The highest annual biomass extraction was 294 kg/km2 but lowest recorded was 1 kg/km2; mean annual offtake was 92 kg/km² ± 78.9 kg/km². Mean (±SD) number of hunted species per site was 20 ± 8.7 (7–39 species). A number of different anthropogenic variables used to construct the map included road density and distance from the hunting locality to the nearest protected area. These proved to be adequate proxies to predict annual offtake. Lower annual offtake in areas with higher road densities explained almost 23% of the variation in annual biomass offtake per km² and distance from the hunting locality alone, 17%.


Figure 6.6 (a) Spatial prediction of hunting pressure using distance to protected areas, roads, and population density. From Ziegler et al. (Reference Sandalj, Treydte and Ziegler2016) reprinted with permission from John Wiley & Sons. Risk zones: See legend for key to low, moderate, high (over exploitation likely) and high risk. CD, Democratic Republic of Congo; CG, Republic of Congo; CM, Cameroon; CF, Central African Republic; GA, Gabon; GQ, Equatorial Guinea. (b) Anthropogenic pressures (i) above median areas of rural human population density. (ii) below median areas of distance to urban areas. (iii) below median areas of distance to roads. (iv) above median areas of distance to protected areas. (v) Wild meat extraction patterns emerging from the overlay of urban areas, road networks, protected areas and densely populated rural areas (areas with a total score of 4 had the highest wild meat extraction potential, whereas areas with a total score of a 0 had the lowest). From Fa et al. (Reference Fa, Olivero and Farfán2015a) reprinted with permission from John Wiley & Sons.
As expected, total annual wild meat offtake and distance to protected areas was significantly negatively correlated (Ziegler et al. Reference Sandalj, Treydte and Ziegler2016). Similarly, the number of species recorded in each site (= species richness) and road density and human population density were significantly correlated, explaining 64% of the variance. Using the median of the predicted values for annual offtake (156 kg/km²) and hunted species (n = 16), hunting pressure was divided into four classes: (1) lower pressure (annual offtake <156 kg/km²; number of hunted species <16), (2) moderate pressure (annual offtake >156 kg/ km²; number of hunted species <16), (3) high pressure (annual offtake <156 kg/km²; number of hunted species >16), and (4) very high pressure (annual offtake >156 kg/km²; number of hunted species >16). Predicted hunting pressure areas within the study area indicated a patchy distribution (Fig. 6.6a) where many protected areas are located in predicted higher hunting pressure zones accounting for approx. 1.5 million km² (39%) of the total area of the Congo Basin and concentrated along three main broad zones. Approximately 36% of the Congo Basin (371,740 km²) was characterized as zones of moderate hunting pressure, encompassing Cameroon and half of the land area of Republic of Congo and Central African Republic as well as the southern part of Democratic Republic of Congo.
Because wild meat hunters are typically central place foragers (Section 4.2), their hunting patterns should be distributed on the landscape according to how easily they can reach forested areas that support game (Levi et al. Reference Levi, Lu, Yu and Mangel2011a; Sirén et al. Reference Sirén2004). As shown in Ziegler et al. (Reference Sandalj, Treydte and Ziegler2016), a well-developed infrastructure, including roads, rail- and waterways, in tropical forests, improves accessibility and transportation and therefore facilitates the extraction of wild meat in the Congo Basin. In fact, estimated hunting offtake in Ziegler et al. (Reference Sandalj, Treydte and Ziegler2016) was not explained by any single environmental factor but by increased road density values and proximity to protected areas. Similar effects of road networks on hunting were found by Fuentes-Montemayor et al. (Reference Fuentes-Montemayor, Cuarón, Vázquez-Domínguez, Benítez-Malvido, Valenzuela-Galván and Andresen2009), and Benítez-López et al. (Reference Benítez-López, Santini, Schipper, Busana and Huijbregts2019) developed a map of hunting pressure across the tropics where the distance to the nearest access point and market were used as a predictor of the spatial distribution of hunting pressure.
Simple Euclidean distance measures can successfully describe coarse patterns of game depletion even if hunting information is not considered. For example, Fa et al. (Reference Fa, Olivero and Farfán2015a) inferred wild meat extraction patterns using only the overlap of urban road networks, protected areas and densely populated rural areas resulting in similar patterns to the map in Zeigler et al. (Reference Endo, Peres and Haugaasen2016) which also used hunting offtake data (Fig. 6.6b). However, according to Deith and Brodie (Reference Deith and Brodie2020), fine-scale environmental features like topography and land cover influence hunter movement decisions while foraging and may offer more realistic and generalizable predictions of the distribution of hunting effort. These authors compared simple, commonly used measures of landscape accessibility against a novel, high-resolution accessibility model based on circuit theory and assess their ability to predict camera-trap detections of hunters across tropical forests in Malaysian Borneo. Deith and Brodie (Reference Deith and Brodie2020) show that hunter movements are strongly correlated with the accessibility of different parts of the landscape, and these are most informative when they integrate fine-scale habitat features like topography and land cover.
Similar to extraction maps produced for the Congo Basin and Borneo, Peres et al. (Reference Endo, Peres and Haugaasen2016) mapped the potential extent of large primate extirpation in the Brazilian Amazon. Because human hunters concentrate hunting effort near households, highly susceptible game species, such as large primates, are extirpated first near human settlements. Peres et al. (Reference Endo, Peres and Haugaasen2016) assumed central place hunting by a single forest hunter for a total of 915,877 georeferenced rural households within different forest phytogeographic boundaries in the region. Population density, biomass density, or another abundance metric for 16 game and non-game primate species functional groups, from pygmy marmosets to the largest atelines (Ateles spp. and Lagothrix spp.) was calculated from line-transect surveys at 166 Amazonian forest sites (Fig. 6.7). This unprecedented dataset was used by the authors to determine the impact of defaunation of the most harvest-sensitive species that would lead to losses in aboveground biomass, given that primates are one of the main tree seed dispersers. The resulting map shows that areas that are heavily settled in the southern and eastern Amazon and along the main tributaries of the Amazon River are depleted (Fig. 6.8a and b), but that non-hunted refugia exist within inaccessible regions and large protected areas that are depopulated or sparsely populated. The actual spatial extent of overhunting varies regionally due to local food taboos that affect primate hunting, or the actual areas accessible to hunters; the latter may diverge due to topographic differences (see Deith & Brodie Reference Deith and Brodie2020). Overall, the study indicates that large primate frugivores would be completely extirpated in 103,022 km2 and overhunted in 236,308 km2 across Brazilian Amazonia; 3.3% and 7.5% of the total remaining forest area, respectively. The total area affected by any level of hunting represents 32.4% (1,017,569 km2) of all remaining forest areas, approx. 1.34-times larger than the cumulative area deforested across this region over the 1970–2014 period (Peres et al. Reference Endo, Peres and Haugaasen2016).

Figure 6.7 (a) Geographic location of 166 Amazonian and peri-Amazonian forest sites across eight of the nine Amazonian countries on which forest primate population density estimates were available; (b) spatial distribution of all georeferenced rural households across the phytogeographic boundaries of Brazilian Amazonia.

Figure 6.8 Maps (a) of the overall distribution of depletion envelopes excluding all deforested areas as of 2013 (shown in lighter grey); (b) of the population depletion envelopes for a game species that is highly sensitive to hunting (spider monkey, Ateles spp.) based on a biodemographic model that considers both the behaviour of central place hunters and the population dynamics of prey species.
The Peres et al. (Reference Endo, Peres and Haugaasen2016) map for the Brazilian Amazon as well as Ziegler’s et al. (Reference Sandalj, Treydte and Ziegler2016) for the Congo Basin clearly show that there are hotspots of greater hunting pressure in those areas with more roads and with higher human population density. Similar regional assessments of hunting pressure for Southeast Asia are not available. For the Congo Basin, Ziegler et al. (Reference Sandalj, Treydte and Ziegler2016) also show that the proportion of small- and medium-sized rodents in the recorded offtake studies increased significantly in areas of higher human presence. This finding is not unexpected as there is evidence that hunting pressure is likely to be higher where there are more hunters (areas of higher human population density) or where hunters have better access to hunting sites, often facilitated by more roads (Fa et al. Reference Fa, Olivero and Farfán2015a). As a result, sites in less disturbed habitats will still have more intact species assemblages, with more large-bodied species present (Dupain et al. Reference Dupain, Nackoney and Mario Vargas2012). The higher proportion of rodents in hunter bags in African sites is an indication of a decline in slow-breeding large-bodied taxa and a replacement by faster-breeding species (see Section 5.5.3).
Differences in the composition of fauna, often related to habitat type and disturbance history, will impact the hunting potential of a region. Moreover, accessibility to hunters as well as the actual number of hunters in the region will influence the biomass of wildlife extracted. Studies of how habitat type and hunting history may explain the structure of the mammalian community in an area have been undertaken extensively for Amazonian forests (Peres Reference Peres, Robinson and Bennett1999a, Reference Akçakaya and Sjögren-Gulve2000). However, few studies are available for African moist forests (Effiom et al. Reference Effiom, Birkhofer, Smith and Olsson2013, Reference Effiom, Birkhofer, Smith and Olsson2014). As has been observed for the Amazon (Fa & Brown Reference Fa and Brown2009), it is likely that type of habitat and history will affect mammalian assemblages in Africa in a similar way. In both the Amazon and the Congo Basin, environmental perturbations, such as selective logging, slash-and-burn agriculture, surface wildfires and forest fragmentation as well as hunting, can lead to marked changes in relative abundances of tropical forest vertebrates. Despite this, given the broad geographic spread in the analyses by both Peres et al. (Reference Endo, Peres and Haugaasen2016) and Ziegler et al. (Reference Sandalj, Treydte and Ziegler2016), the maps are likely to be a good reflection of the spread of hunting pressure in such large forest blocks. However, there are differences in their accuracy based on the type and quality of data used. Studies such Ziegler et al. (Reference Sandalj, Treydte and Ziegler2016) employed hunting data exclusively drawn from the literature. As these data were neither random nor systematic, but determined by the contemporaneous studies that were available, the map is likely to comprise some bias. The dataset in Peres et al. (Reference Peres, Emilio, Schietti, Desmoulière and Levi2016), in contrast, is drawn from field data systematically collected through line transects and, therefore, is not a reflection of game extraction but of the abundance of the game remaining. The ideal of generating data from a large sample of sites during a similar time period is not only time-consuming but also cost-prohibitive. Thus, even though literature-based or prey abundance data assessing spatial patterns of extraction may suffer some constraints (e.g. linked to the comparability of field methods and study periods, validation of study site geolocations, and determination of hunting catchment areas), results for Central Africa and the Amazon corroborate other published studies that show, as expected, higher anthropogenic activities and population densities to generate greater hunting pressure (Fa et al. Reference Fa, Olivero and Farfán2015).
6.6 Estimates of Overextraction
Estimates of wild meat offtake in tropical forests range from global appraisals of what proportion wild animal protein contributes to people’s diets (Prescott-Allen & Prescott-Allen Reference Prescott-Allen and Prescott-Allen1982), to more precise extrapolations of numbers and biomass consumed within the Congo and Amazon Basins (Fa & Peres Reference Fa, Peres, Reynolds, Mace, Redford and Robinson2001; Fa et al. Reference Fa, Currie and Meeuwig2003). From these latter studies, extraction rates were calculated for 57 reported mammalian taxa, for a rural human population of 24 million within a forest area of 1.8 million km2 in the Congo Basin (taken from Wilkie & Carpenter Reference Wilkie and Carpenter1999). Resulting numbers suggest that as many as 579 million animals were consumed in the Congo Basin annually, producing around 4 million tonnes of dressed wild meat (Fa et al. Reference Fa, Currie and Meeuwig2003). This figure contrasts with Wilkie and Carpenter’s (Reference Wilkie and Carpenter1999) study, which estimated only 1 million tonnes. The latter figure is based on extrapolations of actual meat consumed from figures assembled by Chardonnet et al. (Reference Chardonnet, Fritz, Zorzi, Feron, Bissonette and Krausman1995) to estimate an average consumption of meat per person in the region. Using data on production and extraction for all mammal species exploited, Fa et al. (Reference Fa, Currie and Meeuwig2003) calculated harvest rates from empirical data derived from hunting studies in 36 sites in seven West and Central African countries (Cameroon, Equatorial Guinea, Gabon, Republic of Congo, Democratic Republic of Congo, Central African Republic and Ghana). Although the magnitude of extraction in the two studies are different, these figures are likely to still be underestimates, since sample sizes are low. Despite this caveat, the amount of wild meat extracted and consumed per unit area in the Congo Basin is still orders of magnitude higher than in the Amazon. In terms of actual yields of dressed carcasses (given that muscle mass and edible viscera account on average for 55% of body mass), Fa and Peres (Reference Fa, Peres, Reynolds, Mace, Redford and Robinson2001) estimate that 62,808 tonnes are consumed in the Amazon and around 2 million tonnes in the Congo Basin. More specifically, estimated hunting rates for Amazon and Congo Basin species, shown in a graph of production versus extraction (Fig. 6.9) indicate that most are exploited unsustainably in the Congo, whilst most hunted Amazonian taxa are still within the sustainable part of the graph. Congo Basin primates appear more heavily hunted than other species; 12 of the represented 17 species (>70%) fall above the 20% line.

Figure 6.9 Hunting rates are unsustainably high across large tracts of tropical forests as seen in the relationship between extraction and total production of wild meat throughout the Amazon and Congo basin (solid and open symbols, respectively) by mammalian taxa.
These differences in species exploitation between the two continents are predominantly a result of larger human population sizes within a smaller forest area in the Congo Basin, and the fact that a large proportion of what hunters kill is sold in towns and villages for profit. Therefore, per capita harvest rates (kg/person/yr) in relation to number of consumers, show a lower variation for South American settlements than for Africa where they decline significantly from an average of approx. 500 kg/person/yr in smaller settlements to 1 kg/person/yr in the largest settlements (Robinson & Bennett Reference Robinson and Bennett2004). This does not indicate greater consumption rates of wild meat per person but the fact the wild meat is commercialized.
6.7 Defaunation
The archaeological and paleontological evidence suggests that premodern peoples might have driven animal species to extinction. Mass extinction events of large-bodied vertebrates in Europe, parts of Asia, North and South America, Madagascar and several archipelagos are relatively well documented in the fossil and subfossil record (Young et al. Reference Young, McCauley, Galetti and Dirzo2016). Whether they are attributable to post-Pleistocene human overkill and/or climatic and environmental change remains controversial, although the latest analyses (Andermann et al. Reference Andermann, Faurby, Turvey, Antonelli and Silvestro2020) strongly imply that increasing human population size caused past extinctions (Box 6.1). In more recent times, extinction events induced by overexploitation have also been common as European settlers wielding superior technology expanded their territorial frontiers and introduced market and sport hunting. A prime example is the catastrophic loss of wildlife driven by uncontrolled market hunting, and unrelenting subsistence killing suffered in North America at the end of the nineteenth century (Mahoney & Geist Reference Mahoney and Geist2019). Such unbridled hunting for meat, skins or merely recreation led to near extinction of once-vast bison herds in North America. There is also the notorious example of the extinction of what was once the most numerous bird in the world, the passenger pigeon (Bucher Reference Bucher and Power1992).
Box 6.1 Prehistoric megafaunal extinctions
There has been a long and controversial debate on the extent of human contributions to prehistoric species extinctions, especially the late-Quaternary extinctions of megafauna. Based on different data sets, diverging assumptions and conflicting interpretations of several schools of thought have emerged:
Humans have been driving species to extinction since the beginning of the late Pleistocene after their expansion from Africa into Europe, Asia, Australia and the Americas (Diniz-Filho Reference Diniz-Filho2004; Fiedel & Haynes Reference Fiedel and Haynes2004; Haynes Reference Haynes and Hewlett2007; Johnson Reference Johnson2002; Johnson et al. Reference Johnson, Alroy and Beeton2016; Klapman & Capaldi Reference Klapman and Capaldi2019; Martin & Klein Reference Martin and Klein1984; Raczka et al. Reference Raczka, Mosblech and Giosan2019; Sandom et al. Reference Sandom, Faurby, Sandel and Svenning2014; Smith et al. Reference Marlowe and Kent2018; Surovell et al. Reference Surovell, Waguespack and Brantingham2005, Reference Allocati, Petrucci, Di Giovanni, Masulli, Di Ilio and De Laurenzi2016). Key is a strong human hunting pressure leading to overkill, particularly of megafauna mammals (Whittington & Dyke Reference Whittington, Dyke, Martin and Klein1984); blitzkrieg, that is rapid overkill (Mosimann & Martin Reference Mosimann and Martin1975); and a sitzkrieg, that is hunting alongside habitat fragmentation, fire and introduction of exotic species and diseases (Diamond Reference Diamond1989).
Others have argued that there is insufficient evidence for hunting as the cause of human-caused extinctions or that extinction models are highly sensitive to underpinning assumptions about the extinction dynamics (Grayson & Meltzer Reference Grayson and Meltzer2003, Reference Alvard, Gillespie and Alvard2004; Lima-Ribeiro et al. Reference Jorge, Galetti, Ribeiro and Ferraz2013; Lima-Ribeiro & Diniz-Filho Reference Lima-Ribeiro and Diniz-Filho2017). On the other hand, Emery-Wetherell (Reference Emery-Wetherell, McHorse and Byrd Davis2017) highlights that maps of last megafaunal occurrence in North America are consistent with climate as a primary driver in some areas, but the analysis cannot reject human activities as contributing causation in all regions.
Some argue that rapid or synchronous continental-wide extinction is not human-mediated but extinctions are associated with sustained climatic and environmental change especially due to glacial-interglacial cycles during the late Quaternary (Hocknull et al. Reference Hocknull, Lewis and Arnold2020; Lorenzen et al. Reference Lorenzen, Nogu?s-Bravo and Orlando2011; Wroe & Field Reference Wroe and Field2006; Wroe et al. Reference Wroe, Field, Fullagar and Jermin2004).
Some data indicate situation-specific extinction dynamics with differing underpinning causations whereby the importance of hunting and other factors such as climatic and environmental change varied considerably between sites and continents (Wroe et al. Reference Wroe, Field, Fullagar and Jermin2004). For example, Broughton and Weitzel (Reference Broughton and Weitzel2018) concluded that the causes for extinctions in North America varied across taxa and by region whereby either extinctions are linked to hunting (mammoth, horse, sabre-toothed cat); to climate and ecological change (Shasta ground sloth, mastodon, mammoth in the Great Lakes region); or to both (mammoth in the Southwest region).
A synthetic model ascribes extinctions to the combined effect of humans and climate change (Barnosky Reference Barnosky2004; Bartlett et al. Reference Bartlett, Williams and Prescott2016; Gibbons Reference Gibbons2004; Haynes Reference Fiedel and Haynes2018; Mondanaro et al. Reference Mondanaro, Di Febbraro and Melchionna2019; Prescott et al. Reference Prescott, Williams, Balmford, Green and Manica2012; Saltré et al. Reference Althabe2019).
In a study applying Bayesian models to the fossil record to estimate how mammalian extinction rates have changed over the past 126,000 years, Andermann et al. (Reference Andermann, Faurby, Turvey, Antonelli and Silvestro2020) showed that human population size is able to predict past extinctions with 96% accuracy. This study combined data of prehistoric extinctions of 271 mammal species since the beginning of the late Pleistocene and 80 mammal extinctions since the year 1500. Predictors based on past climate, in contrast, perform no better than expected by chance, suggesting that climate had a negligible impact on global mammal extinctions.
Highly visible anthropogenic threats, such as deforestation, habitat degradation and climate change, have been the focus of much of our attention on biodiversity loss, often overshadowing the effects of direct exploitation. But overhunting is at least as serious a problem, often resulting in environments that might appear to be pristine but are devoid of wildlife, especially large-bodied wildlife (Peres et al. Reference Elkan, Elkan, Moukassa, Malonga, Ngangoue, Smith, Peres and Laurance2006). The meta-analysis of 176 hunting studies by Benítez-López et al. (Reference Benítez-López, Alkemade and Schipper2017) revealed that bird and mammal abundances were 58% (25% to 76%) and 83% (72% to 90%) smaller in hunted compared with unhunted areas. Abundances were reduced within 7 and 40 km from roads and settlements for birds and mammals, respectively. The commercial aspect of defaunation was evident by the fact that accessibility to major towns where wild meat could be traded impacted depletion.
Remote sensing data have indicated that only 23.5% of the current extent of forest ecosystems was considered intact in 2008, defined as containing an unbroken expanse of natural ecosystems within areas of current forest extent, without signs of significant human activity (Potapov et al. Reference Potapov, Yaroshenko and Turubanova2008). However, whilst remote sensing can identify habitat loss, conversion and degradation, it does not account for ‘empty forests’ (sensu Redford Reference Redford1992) due to hunting. Benítez-López et al. (Reference Benítez-López, Santini, Schipper, Busana and Huijbregts2019) mapped the spatial patterns of mammal defaunation in the tropics in what appear intact forests using a database of 3,281 mammal abundance declines from local hunting studies. They found an average abundance decline of 13% across all tropical mammal species, but there were large differences regarding mammals of different body size (Fig. 6.10). Medium-sized species were being reduced by >27% and large mammals by >40%. Defaunation, defined here as declines of 10% or more (see Section 6.7.1), was predicted on half of the pantropical forest area, 52% of the intact forests, 62% of the wilderness areas and 20% of protected areas in the tropics, particularly in West and Central Africa and Southeast Asia.

Figure 6.10 Geographic variation in hunting-induced defaunation for (a) all species, (b) small-sized species (<1 kg, e.g. Sciurus spp.), (c) medium-sized species (1–20 kg, e.g. Alouatta spp.), and (d) large-sized species (>20 kg, e.g. Tapirus spp.). The insets represent the total area (y-axis) under different levels of defaunation (x-axis, from D = 0 to D = 1). Note that the y-axes in the four insets have different scales.
As an example, unprecedented rates of local extinctions of medium to large-bodied mammals have been demonstrated from the Atlantic Forest biome in eastern South America. This biome is one of the world’s most important tropical biodiversity hotspots and one of the ‘hottest’ of the global biodiversity hotspots (Myers et al. Reference Myers, Mittermeier, Mittermeier, da Fonseca and Kent2000). Only 10.8% of the original forest cover in the surveyed four biogeographic subregions has been converted to other land-uses (Ribeiro et al. Reference Ribeiro, Metzger, Martensen, Ponzoni and Hirota2009). What remains of the original forest has only 767 from a possible 3,528 populations of ten terrestrial and seven arboreal mid- to large-bodied mammal species still persisting (Canale et al. Reference Canale, Peres, Guidorizzi, Gatto and Kierulff2012). Patchiness of remaining forest fragments makes populations especially vulnerable as fragments are highly accessible to hunters. Forest patches retained only 3.9 out of 18 potential species occupancies on average. Geographic ranges had contracted to 0–14.4% of their former distributions. In the Atlantic rainforest’s Serra do Mar bioregion, mammalian biomass declined by up to 98% in intensively hunted sites (Galetti et al. Reference Galetti, Brocardo and Begotti2017). This level of overkill was also confirmed by using the fate of selected surrogate Neotropical large mammal species to map the level of defaunation. Jorge et al. Reference Jorge, Galetti, Ribeiro and Ferraz2013) mapped the occurrence of the jaguar, tapir, white-lipped peccary and the muriqui – the largest apex predator, herbivore, seed predator and arboreal seed disperser, respectively – in 94 locations of Atlantic Forest remnants. They observed that 96% of these sites are depleted of at least one of the four surrogate species and 88% are completely depleted of all four surrogate species.
6.7.1 Defaunation Index
The defaunation index (DI) of Giacomini and Galetti (Reference Dirzo, Young, Galetti, Ceballos, Isaac and Collen2013) quantifies the loss of species richness through matched site comparisons between an affected contemporary site and a reference site which represents a non-affected contemporary or historic site (e.g. in a forest fragment and a nearby protected area as a reference site). The index ranges from 0.0 for a completely intact faunal assemblage in the study area to 1.0 for a completely defaunated study site to −1.0 for a completely defaunated reference site. A defaunated reference site may seem counterintuitive as the reference site is supposed to be non-affected by species loss but negative DI values might arise due to species reintroductions or invasive species in the affected site. The index can be applied to different types of data – species occurrence, biomass, or site occupancy –depending on practical limitations and data availability.
It is the only index that allows quantification of the effects of hunting on the reduction of species richness in a given area. Even when a contemporary reference site is not available, probable occurrences can be estimated using known distribution maps for species assessed by the Red List (IUCN Reference Barychka, Purves, Milner-Gulland and Mace2020b). Although these range maps are estimated themselves based on often limited available information, the use of the IUCN polygons is a widely established methodology (Bogoni et al. Reference Bogoni, Pires, Graipel, Peroni and Peres2018). The index can be geared towards the importance of species for different biological aspects, such as ecosystem function or conservation importance by the weight parameter for species importance that is part of the equation to calculate DI.
The index quantifies species loss for any reason and cannot distinguish whether the loss occurred because of hunting, habitat alteration, habitat fragmentation or the non-synergistic or synergistic combination of these. Moreover, the index is unsuited for the practical assessment of sustainability of hunting for management purposes as it is an a posteriori assessment of species loss that has already occurred rather than a method that can flag-up non-sustainable hunting whilst the target species still occur and intervention is still possible. Depending on the choice of the weight parameter, different DI values might be calculated for the same data set; thus, DI values are not always directly comparable between studies and sites. For example, species importance might be equal for any species, resulting in DI values that follow an exact monotonically decreasing function of richness. If, however, species’ body size is taken as weight to act as a proxy for vulnerability to extinction and conservation concern, the resulting DI values can vary substantially at the same richness. Other choices for the assumed weight are possible. Giacomini and Galetti (Reference Dirzo, Young, Galetti, Ceballos, Isaac and Collen2013) point out that the criteria for its choice must be justified on a priori grounds and not on a posteriori inspection of resulting index values.
Example: Bogoni et al. (Reference Bogoni, Pires, Graipel, Peroni and Peres2018) calculated the DI for the entire mammal assemblage and for functional groups within the Atlantic Forest of South America which is one of the most endangered major ecoregions worldwide. Because only 11.7% of its original vegetation cover remains and the remaining habitat fragments are mostly highly disturbed (Ribeiro et al. Reference Ribeiro, Metzger, Martensen, Ponzoni and Hirota2009), historic species assemblages were reconstructed from the probable species occurrences calculated from the Red List geographic range polygons. A total of 105 studies provided data on 497 mammal assemblages from 164 independent clusters of study sites from which mammal inventories are available. The results showed high levels of defaunation of DI > 0.5 for most of the Atlantic forest. Comparing contemporary and historical mammal assemblages at any given site for all mammal taxa yielded a mean total defaunation index of 0.71 ± 0.25 ranging from 0.61 for small-bodied species to 0.76 for large-bodies species and to 0.79 for apex-predators (Fig. 6.11). Accounting for possible overestimation of the historical baseline through existing mammal distribution polygons, smaller but still very large DI values were estimated with a mean overall index of 0.57 ± 0.20. The geographic distribution of DI values across the entire Atlantic Forest biome was interpolated from the geographic distribution of the DI values in the separate clusters of study sites by kriging which accounts for spatial autocorrelation of the data. The eastern portions of the Atlantic Forest contain the regions with the highest levels of defaunation

Figure 6.11 Frequency distribution of the overall defaunation index for medium- to large-bodied mammals across the Atlantic Forest biome of South America. The heavy vertical lines indicate mean values. Inset map (lower right) shows the geographic distribution of study sites in eastern Brazil.
6.7.2 Ecological Consequences of Defaunation
Defaunation not only has the above-described devastating effects on the species involved, but also on a plenitude of cascading effects that result in changed and depauperated environments, ecosystem services and human food security. Defaunation has long-term cascading effects on animal and plant community structure and ecosystem functioning, which manifests in a myriad way.
In predator–prey systems, prey species benefit from the removal of their predators, which can trigger further effects on various ecosystem services. For example, sea otters on the northern Pacific coast of North America are sensitive to overhunting and became almost extinct in the nineteenth and twentieth centuries (Estes Reference Estes1990). Sea otters prey on sea urchins, which in turn feed on kelp. Wilmers et al. (Reference Wilmers, Estes, Edwards, Laidre and Konar2012) calculated that kelp net primary productivity is 25–70 g C/m2/year in the absence of otters, but over 10-fold higher when they are present (313–900 g C/m2/year). The ecosystem service by increase in carbon storage is estimated to be worth US$205 million to $408 million on the European Carbon Exchange for the otter’s ecosystem area of approximately 5.1 × 10¹⁰ m2.
Another reduced ecosystem service by defaunation involves changes to prevalence and transmission of some zoonotic disease (Chapter 7). Young et al. (Reference Dirzo, Young, Galetti, Ceballos, Isaac and Collen2014) experimentally excluded large wildlife from a savanna ecosystem in East Africa. Consequently, rodent population density doubled and with it the density their flea vectors infected with Bartonella spp., which causes bartonellosis in humans. Similar cascading effects by reductions in predator abundance increase the zoonotic risk of hantavirus and Lyme disease (Levi et al. Reference Levi, Kilpatrick, Mangel and Wilmers2012; Suzán et al. Reference Fuentes-Montemayor, Cuarón, Vázquez-Domínguez, Benítez-Malvido, Valenzuela-Galván and Andresen2009). Human welfare is also impacted by ecosystem services such as the suppression of pest insects and, to a lesser extent, pollination services by birds and bats. Maas et al. (Reference Maas, Clough and Tscharntke2013) observed in their exclusion experiments in Indonesian cacao agroforestry fields that insect herbivore abundance increased leading to the decrease of 31% of crop yield in this billion dollar per year industry.
A growing body of studies has demonstrated a significant impact of the defaunation of mid- and large-sized animals on plant regeneration and thus carbon storage through changes in seed dispersal, pre- and post-dispersal seed predation, leaf herbivory or browsing. Exclusion experiments have demonstrated increased seedling density, survival, recruitment and increased understory vegetation cover through reduced seed predation and herbivory (Aliaga-Rossel & Fragoso Reference Aliaga-Rossel and Fragoso2014; Beck et al. Reference Beck, Snodgrass and Thebpanya2013). Whilst such experiments can demonstrate that plant community structure depends on vertebrate community structure, they are no analogues for real-world defaunation because they impact vertebrate communities differently. Exclusion experiments also exclude herbivores (e.g. ungulates) or seed predators (e.g. rodents), which are not hunted or hunted but not critically depressed in their abundance in real-world settings. Moreover, they fail to exclude arboreal and volant species such as primates, birds and bats, many of which are seed dispersers. Contrary results were observed by Rosin and Poulsen (Reference Rosin and Poulsen2016) in experiments that excluded large animals but not rodents. Here, rodents caused the greatest seed mortality for all species, removing 60% of accessible seeds, leading to a reduction of seedling establishment by 42% compared to sites with intact fauna. Gardner et al. (Reference Gardner, Bicknell, Baldwin-Cantello, Struebig and Davies2019) conducted a meta-analysis of real-world defaunation and manipulation experiments and confirmed these contrasting findings. Observed defaunation was associated with reduced forest regeneration whilst experiments were associated with increased forest regeneration. Overall, defaunation caused decreases in seedling density and richness. The defaunation of primates and birds caused the greatest declines in forest regeneration.
Defaunation changes the spatial structure and dynamics of tree populations and leads to a decline in local tree diversity over time (Harrison et al. Reference Bailey, Peacock, de Garine and Harrison2013) because hunting directly impacts tree species whose seeds are dispersed by animals. For example, defaunation causes population genetic changes in the large-seeded queen palm in the Atlantic Forest of South America whereby trees in hunted forest fragments show lower allelic richness and stronger fine-scale spatial genetic structure compared to protected forest (Giombini et al. Reference Giombini, Bravo, Sica and Tosto2017). In a meta-analysis, Kurten (Reference Kurten2013) confirmed that larger-seeded species consistently experience reduced primary seed dispersal when large seed-dispersing animals are absent. Resilient frugivores, such as small birds, bats and marsupials, which are not targeted by hunters, can disperse seeds up to 12.0 ± 1.1 mm in width, but larger animal-dispersed seeds are dispersed only by larger animals (Bello et al. Reference Bello, Galetti and Pizo2015). Moreover, there is a functional relationship between seed diameter and traits related to carbon storage, with trees that produce seeds larger than 12 mm having a high carbon stock capacity. Thus, large seed dispersers are functionally linked to forest carbon storage (Bello et al. Reference Bello, Galetti and Pizo2015). Consequently, overhunting of larger seed-dispersing animal species shifts plant species composition towards species, including lianas and low wood-density tree species, that are abiotically dispersed or dispersed by small animals(Kurten et al. Reference Kurten, Wright and Carson2015). Defaunation can negatively impact carbon storage in tropical forests by favouring the latter species as they store much less carbon than high wood density trees, which have typically large seed size (Bello et al. Reference Bello, Galetti and Pizo2015; Jansen et al. Reference Jansen, Muller-Landau and Wright2010; Putz Reference Putz1983). There is a relationship between wood volume and seed size with large-seeded animal-dispersed trees being larger than small-seeded animal-dispersed species, but smaller than abiotically dispersed species (Osuri et al. Reference Osuri, Ratnam and Varma2016). Because defaunation impacts preferentially large-bodied animal species, which disperse large seeds and, thus, large trees, defaunation shifts tree populations towards species with smaller trees. Consistent with this are simulations which demonstrate that African, American and South Asian forests, which have high proportions of animal-dispersed species, consistently show carbon losses (2–12%) when becoming defaunated, whereas Southeast Asian and Australian forests, where there are more abiotically dispersed species, show little to no carbon losses (Osuri et al. Reference Osuri, Ratnam and Varma2016). Field studies in Africa (Effiom et al. Reference Effiom, Birkhofer, Smith and Olsson2013, Reference Aliaga-Rossel and Fragoso2014; Poulsen et al. Reference Clark, Poulsen, Malonga and Elkan2013; Vanthomme et al. Reference Vanthomme, Bellé and Forget2010), Mesoamerica (Kurten et al. Reference Kurten, Wright and Carson2015; Wright et al. Reference Wright, Stoner and Beckman2007), southern Asia (Brodie et al. Reference Brodie, Helmy, Brockelman and Maron2009) and Southeast Asia (Chanthorn et al. Reference Chanthorn, Hartig, Brockelman, Srisang, Nathalang and Santon2019) corroborate that defaunation of large frugivore, seed-dispersing species affects the recruitment, relative abundance and population growth rate of animal-dispersed large-seeded trees. Loss of dispersal is also substantiated by the increase of genetic similarity in tree communities due to defaunation (Pérez-Méndez et al. Reference Pérez-Méndez, Jordano, García and Valido2016). In an Afrotropical forest, hunting reduced the mean dispersal distances of nine mammal-dispersed tree species by 22% (Poulsen et al. Reference Clark, Poulsen, Malonga and Elkan2013). Hunted forest also had significantly lower above-ground biomass than logged and undisturbed forests. Using field data and models to project the impact of hunting on large primates in the Brazilian Amazon, Peres et al. (Reference Peres, Emilio, Schietti, Desmoulière and Levi2016) found that loss of large primates alone leads to losses in aboveground biomass of 2.5–5.8% on average, with some losses as high as 26.5–37.8%. Such changes in plant structure, dynamics, regeneration, etc., affect the forest’s ability to store carbon which impacts us globally.


 Open access