


Introduction
There is an excellent and abundant literature on the characteristics of sea ice, one of the most outstanding papers being that of Reference MalmgrenMalmgren (1927). Additional references are to be found in Reference DorseyDorsey (1940), and to the more recent work in Arctic sea ice (1958) and in Ice and snow (Reference KingeryKingery, 1963).
The observation that sea ice is composed of pure ice with trapped brine pockets was apparently first made by Reference BuchananBuchanan (1887) and later by Reference MalmgrenMalmgren (1927). Malmgren also studied the salinity in relation to the rate of freezing and the continuous decrease in salinity with aging. A more recent examination of salinity profiles during sea-ice growth was made by Reference Weeks, Assur and KingeryWeeks and Lee (1958), which shows a consistent salinity reduction as the ice thickens. The compositional differences from level to level in sea ice are generally very erratic as was clearly shown by Reference ButkovichButkovich (1956) and Reference Weeks and LeeWeeks and Lee (1962, p. 93). Although the average salinity decrease with age has been proved, the detailed mechanism of this change has not been developed. Any attempt to explain the means of brine drainage must, of course, be compatible with related characteristics of sea ice with the same history, namely, the brine-concentration differences and the permeability. Therefore, a sampling program and analytical procedure were designed for this study to show a consistency, if one existed, in the changing composition of sea ice that might be used as a basis for explaining the physical mechanism of brine escape.
Sampling and Analysis
Samples were collected during December 1964 and January 1965, with a few additional samples taken in June 1965, offshore at the Arctic Research Laboratory, Barrow, Alaska. A patch of undisturbed young ice was selected that had frozen from open water with little or no slush. The area remained undeformed during the sampling period. The ice thickness was ~50 cm. initially, 120 cm. on 1 February 1965 and 160 cm. in June when the sampling was terminated.
At each sample site the sections were taken alternately from cores drilled 25 cm. apart so that all specimens received identical treatment. They were retained in their proper orientation, examined for structural features, split length-wise, sawed into sections 5 cm. long, then placed in sealed plastic containers, melted, stirred, filtered and sealed in plastic bottles for shipping and later analysis. The ambient temperature averaged below −35°C. during this part of the cold period.
Three groups of samples collected on 21 December, 17 January and 1 February were analyzed by titration and the salinity concentrations are plotted in Figure 1. Salinity differences of ~2‰ to 3‰ may exist at the same level between the halves of a 7.5 cm. core or between two cores. The salinity differences between 5 cm. levels are commonly 0.5 to 1.0‰, the maximum being ~2‰
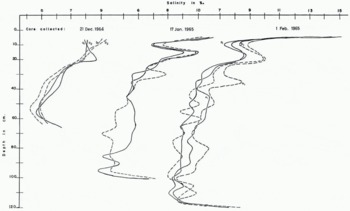
Fig. 1. Composition of sea-ice cores. Cores were collected on the dales indicated. 25 cm. apart, split, cut into 5 cm. sections and analyzed chemically by Mr. R. W. Riley, Department of Oceanography, University of Washington. Solid lines represent composition for halves of one core and dashed lines are for halves of the other core
The specific gravity values for the cores collected during June are plotted in Figure 2. Some distinct differences between these and the cores collected during the freezing season are evident even though the scatter is similarly great. The measurements were made with a calibrated specific gravity balance which was checked against the values determined by titration. Specific gravities of 1.0035 and 1.0074 are equivalent to salinities of, ~5‰ and ~10‰, respectively. A comparison of the specific gravity values indicates a general salinity decrease by early melt season from ~1.0035 to ~1.0030, rough averages for the total lengths of the cores. The most apparent difference is in the distinct change in slope of the curves above the 45 cm. level. All of the salinity profiles from cores collected in early December were sub-parallel, and those from later collections show little or no parallelism except to the 20–25 cm. levels.
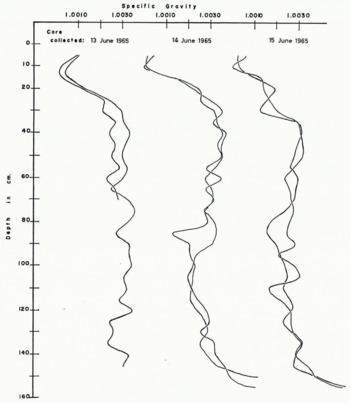
Fig. 2. Composition of young sea-ice cores in the early melt season. Cores were collected on the dates indicated. Two cores were collected 25 cm. apart, cut into 5 cm. sections and used for specific gravity determinations
One core was collected from old pack ice, each section was cut into 5 cm. lengths and placed in individual plastic containers immediately at the drilling site so that any brine seepage was retained. The nearly completely leached out zone terminates at the ~25 cm. level, and the salinities continue very low to the water-table at the 41 cm. level.
It is interesting to note that the average specific gravity of the core from the old pack ice is ~1.0025 (~4‰ salinity) or nearly the same as that of young sea ice cores at the beginning of the first melt season. The migration of the high surface salinity, above the 45 cm. level, is apparently not reflected at the lower levels as the melt season approaches, although the descent of brine may provide some irregular salinity changes.
Permeability and Brine Drainage
The permeability of sea ice is one of the few characteristics that may be suitably studied in situ without causing a disturbance to the temperature profile. The permeability of sea ice has been observed by Reference MalmgrenMalmgren (1927, p. 6) and Reference AssurAssur (1958, p. 111), who have described the filling of pits dug in the ice by seepage of high-salinity brine. Some in-place permeability studies were therefore made, followed by thin-section work on the removed specimens.
The permeability of sea ice was conveniently examined by use of a dye that is marketed under the trade name “Dy-Chek” (a Turco Company product) for examination of metal parts for cracks and flaws. It was diluted with tetrachloroethane which proved a satisfactory vehicle.
Dilute dye solution was poured uniformly over an area of young sea ice ~30 cm. by 40 cm., that could be sawed and lifted without flooding the surface with sea-water. The dye was allowed to stand about 20 min. before the block was cut and removed, then trimmed and sawed into slabs thin enough (~2 cm.) to be translucent. Most blocks, especially from ice less than ~9 cm. thick, were sawed into slabs as soon as they were removed. When working with ice ~20 cm. thick, a few blocks (12 or 14) which were kept in an upright position were taken to the cold room for sawing and photographic mapping of the slabs for use as thin-section material.
Dye solution placed on young sea ice ~5 to 8 cm. thick penetrates the entire mass; on ice of ~20 cm. thickness, the uniform penetration was ~6 to 8 cm. with many penetrations to ~10 and 14 cm. The ice that is 20 cm. thick will commonly average one drainage channel per 800 cm.2 surface area that will permit dye to completely pass through the block. Figure 3 shows the characteristic dye penetration in a section of young sea ice; it also clearly shows a large drainage channel that was sealed well enough to admit no dye.
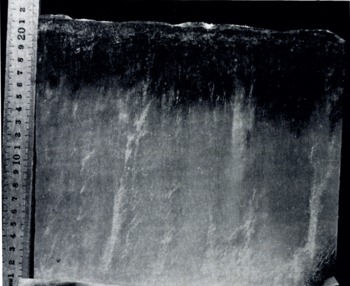
Fig. 3. Permeable young sea ice. The top 6 cm. show dense dye stain. Whitish streaks are sealed drainage channels
The large drainage channels appearing in Figure 3 are the type inherited from the continuous convection in the liquid, as previously demonstrated (Reference Bennington and KingeryBennington, 1963[a]). Some of the large channels are continuous but some of them are not. Few of the continuous ones remain open and permit dye penetration. The blocks of ice that were dyed and taken to the cold room did not show perceptibly greater dye penetration than those that were sawed at the sample site.
The permeability of thick young sea ice (90 to 100 cm.) was examined by coring, pouring dye solution into the hole then continuing the drilling. Three cores were taken concurrently and four sets of three cores each were taken from the thick ice. Figure 4 shows a representative core, the top left section being the ice surface, the center tier and third tier placed in sequence below the first tier. The dye stain in this core is from interior penetration and not from having been smeared over the surface by the drill.

Fig. 4. Young sea-ice core. Dye-stained sections and drainage channel indicate permeability. The lower two sections are impervious. The core is 93 cm. in total length
The dye has stained the first two sections to a depth of ~1.5 cm. at the ice surface and at the 11 cm. level. Minor stain may be detected on the third section at the 21 cm. level. The depth of dye penetration in the ice-surface section was normally equal to the free-board which for this core was ~10 cm. If a drainage channel happened to be open at the surface, the dye penetrated 5 to 8 cm. below the water-table.
The dye penetration is most apparent in the top and the second sections of the second tier in this particular core; a porous zone as well as an open drainage channel have been stained. There was no brine migration during drilling and sample removal that could have left openings of such large volume. All of the cores taken collectively indicate that there is no consistent level in the ice that is impermeable; an impermeable core section may be found at any level in the ice adjacent to, above or below a permeable section.
Old pack ice of ~285 cm. total thickness that had lodged along the shore before freeze-up was also examined for permeability. It was found to be completely permeable above the water-table but impervious below that level, the free-board being ~41 cm.
Another group of cores was drilled and examined for permeability at the beginning of the melt season. The average daily temperature fluctuated from −2° to +2°C. At these temperatures, water began to drain into the hole at the level of the water-table, a depth of ~10 cm. in young ice ~160 cm. thick. Sections were drilled, quickly withdrawn, sawed into 6 cm. lengths, restored to original upright position and,~2 cm.3 dye solution was poured on the upper end. The cores were immediately split lengthwise and examined for dye penetration. All sections showed dye penetration of ~2 cm., and the most common penetration depth was 3 to 5 cm. and complete penetration was not uncommon. The time involved, generally 2 to 3 min. at temperatures below freezing point, was inadequate for a network of drainage channels to have developed during the sampling.
Essentially the same characteristics were observed on young and old ice at the beginning of the melt season. The higher-salinity young ice would normally be expected to be the more permeable but no differences were detected.
Types and Origin of the Brine-Drainage Features
The evidence from thin-section and permeability studies indicates that in sea ice there are at least two generations of brine-drainage channels, each composed of at least two types: the first is characteristic of ice growth and the second is characteristic of deterioration. The inherited type are easily observed and persistent features; straight sections in excess of 32 cm. in length have been measured in cores. The inherited channel is not consistently related to individual crystals or to crystal boundaries. They commonly become sealed during the freezing season even though brine expelled from the massive ice escapes through these channels.
Another type of first-generation drainage channel is formed by an interconnecting network of brine pockets between platelets. They characteristically appear as cone-shaped networks leading into the larger channels and initially do not cross-cut platelets. Although these features develop during crystal growth, they cannot be distinguished from similar channels that are of second-generation origin.
Of the two distinct types of second-generation brine-drainage features, one develops at the ice surface where the highly concentrated brine slowly begins to migrate by self-dilution at rising temperatures. Initially, a “corrosion pocket” forms at the ice surface as shown at the top left in Figure 5. These features may begin to form under snow cover by radiational heating. The descending brine may then enlarge or re-open old channels (see Reference NakayaNakaya, 1956, p. 14).
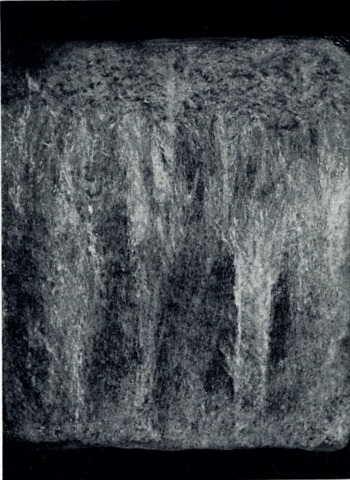
Fig. 5. Vertical thin section of young sea ice. The top of the section is at the ice surface. A corrosion pocket is visible at the to left and a drainage channel is at the lower right. Section 10 cm.×10 cm.
The origin of another type of second-generation brine-drainage feature cannot always be clearly determined. Some develop from brine-pocket migration between the platelets and are occasionally observed to cut across platelets as shown in the center of Figure 6. Others develop from Tyndall-figure migration as the melt season advances, cutting across platelets from the interior of a platelet where they originate. Any real difference between the brine pocket and the Tyndall figure is probably in the impurity at the point of melting, permitting the brine pocket to originate at a lower temperature. The pockets and figures migrate vertically towards the warmer side regardless of the attitude of the crystals as demonstrated by Reference NakayaNakaya (1956, p. 31). The direction of the brine migration has changed because of a slight change in the orientation of this specimen under the microscope. The crystal boundaries in young ice were commonly sealed and no evidence was observed that channels were preferentially located along crystal boundaries.

Fig. 6. Young sea-ice section. Tyndall-figure migration within platelets and the brine pocket between platelets is apparent. Platelets are ~0.5 mm. thick
When viewed normal to the c-axis the vapor figures appear edge-on as shown in Figure 7. The vapor-figure faces are clearly developed and easily observed in Figure 8. These vapor figures are sensibly identical to those described by Reference NakayaNakaya (1956) for single crystals of pure ice.
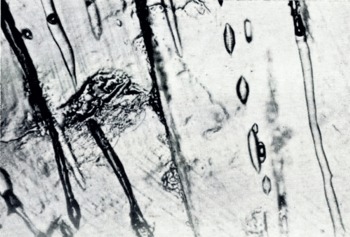
Fig. 7. Young sea ice. Migrating Tyndall figures seen edge-on. Platelet width ~0.1 mm.
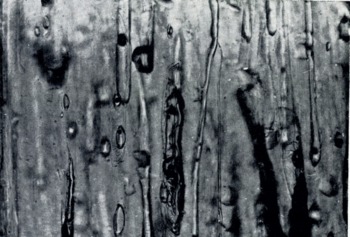
Fig. 8. Young sea ice. Interior faces in Tyndall figures are visible. Drainage-channel development from a brine pocket and Tyndall-figure migration
The drainage channels in ice that is, ~20 to ~30 cm. thick are dominantly the first-generation features. The second-generation features appear sparsely in the upper levels and increase in number in the lower levels of thick ice of ~100 cm. or more. The thin sections shown in Figure 9a, b and c were cut from the dense ice corresponding to the upper, intermediate and lower levels in the core shown in Figure 4. All of these sections are impervious but a distinct increase in the number of the second-generation features is detectable. There is also an increase in the number of interconnections where one brine pocket has merged with the trace of another figure. Conceivably, the brine pockets could “march” through the ice by the diffusion process first described by Reference WhitmanWhitman (1926), without leaving a tubule. However, this is unlikely in natural sea ice, because the migration of pockets shown in Figure 6 will eventually connect with a drainage channel. This brine escape mechanism does not appear to be the same phenomenon as that described by Reference HarrisonHarrison (1965), although the features within the individual platelets shown in Figure 9 are remarkably similar to the transpiration pores that he described.
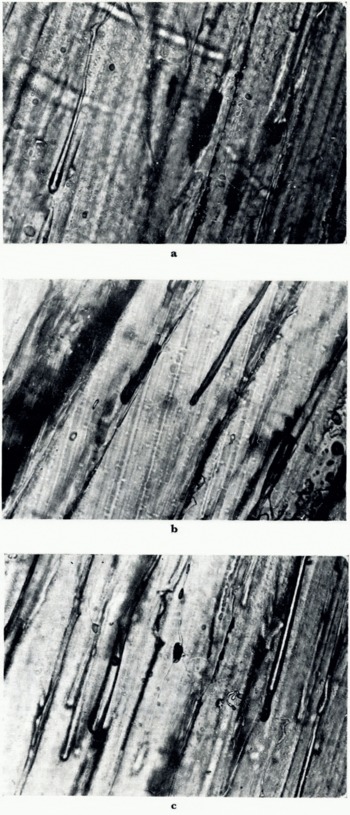
Fig. 9. Young sea ice. a. Upper; b. Center; c. Lower. Impervious zones show increased development of second-generation drainage channels. Platelets ~0.5–0.7 mm. in width
Discussion
The migration of brine from sea ice by brine-pocket migration or gravity drainage has been discussed by Reference WhitmanWhitman (1926), Reference Kingery, Goodnow and KingeryKingery and Goodnow (1963), Reference BenningtonBennington (1963[b]), Reference HarrisonHarrison (1965), and Reference HoekstraHoekstra and others (1965). Steps in a proposed crystal-growth and temperature-change continuum may be outlined: (i) brine expulsion during crystal growth and (ii) brine expulsion from the solid-ice mass.
Although many observations have been made on growing sea ice (Reference Harrison, Tiller and KingeryHarrison and Tiller, 1963[a], Reference Harrison and Tiller[b]; Reference Weeks, Assur and KingeryWeeks and Assur, 1963; Reference HarrisonHarrison, 1965; Reference HoekstraHoekstra and others, 1965), the actual brine-pocket sealing has not been observed and described. The details of the process are of particular interest in order to explain the retention of minor concentrations of brine by sea ice growing from normal salinity sea-water.
Brine that is expelled from the solid-ice mass may commonly be observed on fresh samples. Regardless of the ambient or ice temperature at the time of collecting a sample of young sea ice, very fine droplets of brine have always been observed to ooze from all freshly cut surfaces. This immediate brine escape is not necessarily an indication of gravity drainage but is more likely caused by a relief of internal stress. In natural sea ice, the escape of brine along crystal boundaries has not been observed. If it does occur, it leaves no obvious traces. It is presumed here that the rate of any significant gravity drainage is closely equal to the rate that the ice rises because of the increasing buoyancy of the thickening sheet.
The salinity differences shown in Figure 1 show a great lack of uniformity for solid grown from a homogeneous liquid at a uniform rate. The known irregularities which may be responsible for the salinity variations are the spacings of the inherited drainage channels and their communication with the interconnecting channels. From Figure 1 it can be seen that the variations in salinity near the advancing interface are retained during the further growth and apparently are not affected considerably by later brine migration.
From Figure 1 it is also apparent that sea ice of 4‰ to 5‰ salinity, nearly identical to that of old pack ice, can grow from sea-water of ~32‰ salinity which indicates that the first-generation features dominate in the brine elimination. Aging involves the second-generation features as well as enlargement of the first-generation drainage channels and the reduction of the salinity to values <4‰ (specific gravity of ~1.0025) for the entire column.
For thin ice formed at temperatures of −30°C. the second-generation features do not appear to develop immediately behind the freezing interface but are delayed until warmer temperatures or radiation permit concentrated surface brine to descend. The second-generation brine-drainage features begin to develop just behind the freezing interface nearly simultaneously with the first-generation features only when the ice is about 100 cm. thick. In this zone behind the interface, temperature fluctuations can cause brine migration by an internal-stress mechanism demonstrated by Reference NakayaNakaya (1956, p. 18) on pure ice; in the freezing of liquid figures, the remaining water flows into cracks and freezes if a liquid figure is allowed to freeze completely.
The analyses of ice cores of ~100 cm. length plotted in Figures 1 and 2 show fairly clear parallelism in the top 20 to 25 cm., indicating a probably uniform brine migration in that zone. At the lower levels the analyses prove a great variability in the composition. The following explanation is proposed to account for this.
The concentrated brine from the upper levels in the ice may be expelled by the internal-stress mechanism into the first-generation drainage channels of the type seen in Figure 4. As droplets accumulate at the upper levels, they will be at a freezing point below the freezing point for the brine at a lower level. The liquid-figure migration within the platelets involves brine of very low salinity and, although they may migrate within a platelet (as shown in Figure 3) for some distance, they will eventually cross-cut the platelet (Fig. 6) and enter a first-generation channel. If some colder droplets cascade down the channel, enough ice may be frozen by the lower-temperature brine to temporarily close the channel. Such a closure is no doubt transitory because the colder brine will undergo self-dilution in the warmer ice at the lower level. Minor retarding effects may be attributed to fine ice spicules within the droplets which would be re-melted. Dense brine droplets have been observed to nucleate new crystals with these fine ice crystals when they are carried to greater depths in supercooled sea-water (Reference BenningtonBennington, 1963[b]).
Conclusions
Incomplete though this work is, some comments and tentative conclusions may be presented along with a number of points requiring further investigation. Sample sizes were chosen to give an accurate analysis for a small volume that could be conveniently and quickly handled before melting and without detectable loss of brine. This 50 cm.3 size sample shows variations that do not appear in earlier profiles from larger samples (Reference ButkovichButkovich, 1956; Reference SchwarzacherSchwarzacher, 1959; Reference Weeks and LeeWeeks and Lee, 1958, 1962). These authors also average out the smaller variations necessary to identify the mechanism of differentiation which will require new analytical techniques.
The measurements, which were repeated on several cores, are adequate for the tentative conclusion that young sea ice grows with the same salinity as old pack ice.
It is difficult to account for the existence of open drainage channels below the water-table. The thermal contraction in sea ice at extremely low temperatures is insufficient to create the profusion of open channels. Furthermore, no sign of a relief of stress of such magnitude is noted while drilling cores or sawing blocks that are permeable, nor is an equivalent volume of brine lost at the time of drilling. Many of these channels were sealed at a level of only ~10 cm. above the ice–water interface.
The reason for the existence of such pronounced compositional differences over distances of 2 or 3 cm. horizontally as well as vertically in ice specimens with identical growth history and sensibly similar ice structure is still to be clearly explained. It is surprising that such differences should exist in a mass that is exceedingly permeable.
Acknowledgements
This work was sponsored by the Office of Naval Research through Contract NONR 477(24) to the University of Washington, Department of Atmospheric Sciences, administered by Dr. P. E. Church, Chairman of the Department. Grateful acknowledgement is tendered to N. Untersteiner for many discussions and to both N. Untersteiner and E. LaChapelle for critically reviewing the manuscript.


