


E.L. Carson awarded the 2014 FSAI student prize for oral communication
Chronic obstructive pulmonary disease (COPD) is characterised by irreversible airflow obstruction and affects three million individuals within the UK( 1 ). One in four COPD patients present with sarcopenia, which has been associated with a poorer chance of survival( Reference Shrikrishna 2 ). Vitamin D may help prevent the progression of COPD by a) prevention of infections and exacerbations through immune modulation( Reference Hansdottir 3 ) and b) prevention of sarcopenia by maintaining fat free mass (FFM) and muscle strength( Reference Scott 4 ). The aim of the current study was to assess seasonal fluctuations in vitamin D status and any associated changes in FFM and muscle strength in COPD patients.
To date, 39 COPD patients have provided consent and completed both time-points of the study; once at the end of winter and once at the end of summer, corresponding to the nadir and peak of vitamin D status respectively. Height (m) and weight (kg) were measured at both time-points, together with FFM (kg) using bioelectrical impedance (Tanita Cooperation, Tokyo, Japan) and muscle strength (kg) using hand-grip dynamometry (Takei Scientific Instrument Company Limited, Japan). Non-fasting 10 ml blood samples were obtained at both time-points and used to quantify serum 25-hydroxyvitamin D (25(OH)D) concentration as a measure of vitamin D status, using the gold standard liquid chromatography-tandem mass spectrometry (API 4000, AB SCIEX).
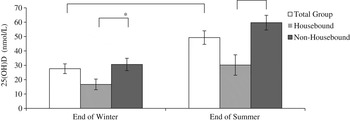
Fig 1. Bar chart of mean (±SD) 25(OH)D concentrations for the total group (n 39), housebound patients (n 10) and non-housebound patients (n 29) at end of winter and end of summer. *P < 0.05; **P < 0.01.
Following paired t-tests in the total group, mean (SD) 25(OH)D concentration was significantly lower at the end of winter, compared to end of summer (27.9 (20.4) vs 50.5 (26.8) nmol/L respectively; P < 0.001) and this was more evident in housebound patients compared to those who were not housebound. In regression analysis, 25(OH)D concentration was not significantly associated with FFM (kg) at either time-point; however, 25(OH)D concentration was positively associated with muscle strength at both end of winter and end of summer (β = 0.29; p = 0.004 and β = 0.14; p = 0.031, respectively).
Owing to the favourable effects of vitamin D status on muscle strength, there may be a requirement for vitamin D supplementation during winter months in non-housebound COPD patients and all year round supplementation in their housebound counterparts.
This work was funded by the Department for Employment and Learning. Ethical approval was obtained from the Office of Research Ethics Committee Northern Ireland (ORECNI) and the study was conducted according to the guidelines laid down in the Declaration of Helsinki.

