


Introduction
Africa’s large terrestrial birds have shown severe declines across the continent in recent decades (Garbett et al. Reference Garbett, Herremans, Maude, Reading and Amar2018, Hofmeyr et al. Reference Hofmeyr, Symes and Underhill2014, Lee et al. Reference Lee, Ottosson, Jackson, Shema and Reynolds2021), with large-scale alteration and degradation of intact natural habitats driving this loss (Skowno et al. Reference Skowno, Jewitt and Slingsby2021, Venter et al. Reference Venter, Hawkins and Cramer2017). The Black Stork Ciconia nigra has been highlighted as a species with alarming potential population loss over recent decades across southern Africa (Barnard and de Villiers Reference Barnard and de Villiers2012). Smith et al. (Reference Smith, Underhill and Brooks2017) noted that although citizen science reporting suggests a similar range, i.e. extent of occurrence (EOO), frequency of reporting within the range has decreased dramatically, with sightings becoming far more fragmented. Both Barnard and de Villiers (Reference Barnard and de Villiers2012) and Smith et al. (Reference Smith, Underhill and Brooks2017) relied on data from Southern Africa’s Bird Atlas Projects (SABAP1 and SABAP2) and associated changes between these (for more details see Underhill et al. Reference Underhill, Brooks and Loftie-Eaton2017). Using these databases, Black Stork had the largest declines in reporting rates of all southern Africa’s stork species (Smith et al. Reference Smith, Underhill and Brooks2017). In South Africa, Lesotho, and Eswatini the species is listed as “Vulnerable” (Monadjem et al. Reference Monadjem, Boycott, Parker and Culverwell2003, Taylor Reference Taylor, Taylor, Peacock and Wanless2015), but the global status is “Least Concern” (BirdLife International 2022). Given that there is evidence of a geographical distinction between the Black Stork populations in the Northern Hemisphere and the resident population in the Southern Hemisphere, these declines indicate a need to review the status of the Southern Hemisphere population.
The Black Stork is a widespread, large wading bird which, in the Northern Hemisphere, occurs from western Europe to northern China and Japan (del Hoyo et al. Reference del Hoyo, Elliott and Sargatal1992). Black Storks in this region are tree-nesters (Anna Reference Anna2012) and migratory, overwintering in sub-Saharan East Africa and the Sahel, northern India, and eastern China (Chevallier et al. Reference Chevallier, Baillon, Robin, Le Maho and Massemin‐Challet2008, del Hoyo et al. Reference del Hoyo, Elliott and Sargatal1992). Studies on this population indicate that Black Storks are shy and wary of anthropogenic disturbance: they prefer to forage and breed in isolated areas away from human activity (Cano-Alonso and Tellería Reference Cano-Alonso and Tellería2013, Chevallier et al. Reference Chevallier, Le Maho, Baillon, Duponnois, Dieulin, Brossault and De Franclieu2010). The birds are associated with water bodies (Jiguet and Villarubias Reference Jiguet and Villarubias2004), with tracked birds indicating a strong preference for rivers with higher water quality (Jiguet and Villarubias Reference Jiguet and Villarubias2004, Moreno-Opo et al. Reference Moreno-Opo, Fernandez-Olalla, Guil, Arredondo, Higuero, Martín and Soria2011). The foraging range of the northern, migratory sub-population during the breeding season is surprisingly large (Jiguet and Villarubias Reference Jiguet and Villarubias2004), but no comparative estimates exist for the seemingly independent southern African sub-population.
Unlike the typical seasonal movements of Black Stork in the Northern Hemisphere, the southern African sub-population is considered resident (Anderson Reference Anderson2005, Kopij Reference Kopij2016, Siegfried Reference Siegfried1967). This sub-population occurs from Malawi, south to Mozambique, South Africa, and Lesotho, and westwards to Namibia (Anderson Reference Anderson2005). Like the northern populations, the southern population is also associated with water bodies (Cano-Alonso and Tellería Reference Cano-Alonso and Tellería2013, Chevallier et al. Reference Chevallier, Le Maho, Baillon, Duponnois, Dieulin, Brossault and De Franclieu2010). The species has been described as particularly prevalent in the dry season when water levels recede, causing the formation of shallow pools with high concentrations of fish (Anderson Reference Anderson2005). Although typically solitary, Black Storks have been recorded forming small congregations around such prey-dense pools (Tarboton Reference Tarboton1982, Tilson and Kok Reference Tilson and Kok1980). In South Africa the winter breeding season (from May) largely coincides with this period (Anderson Reference Anderson2005), and young birds fledge in September/October, when water levels are at their lowest point (Tarboton Reference Tarboton1982). Similar to a small population of Black Storks on the Iberian Peninsula, Spain (Cano-Alonso and Tellería Reference Cano-Alonso and Tellería2013), but unlike the European population (Anna Reference Anna2012), the southern African population breeds on cliffs in inaccessible mountainous regions (Siegfried Reference Siegfried1967, Tarboton Reference Tarboton1982). These nest sites commonly overlook bushveld, plantations, indigenous forest or kloofs, and ravines above watercourses, with the highest cliffs on isolated mountains preferred (Clarke Reference Clarke1904, Symons Reference Symons1915, Tarboton Reference Tarboton1982). However, nest sites found in Lesotho typically overlooked high-altitude grassland (DGA pers. obs.). Studies on cliff-nesting Black Storks on the Iberian Peninsula showed no indication that inter-specific competition for nest sites has a detrimental effect on nesting behaviour (Cano-Alonso and Tellería Reference Cano-Alonso and Tellería2013). However, cliffs that are readily accessible to humans showed a significant reduction in productivity (Cano-Alonso and Tellería Reference Cano-Alonso and Tellería2013).
In South Africa, Black Storks usually build their own nests (preferably facing north or south) from sticks and often near other cliff-nesting species such as Cape Vulture Gyps coprotheres, Southern Bald Ibis Geronticus calvus, and Lanner Falco biarmicus and Peregrine F. peregrinus falcons (Tarboton Reference Tarboton1982). In northern South Africa, the Magaliesburg and Nyl River catchment areas were considered traditional breeding sites, in addition to the unusually high concentration of nest sites in the Luvuvhu River and Mutale River gorges of the northern Limpopo River, where nests were spaced at intervals of only 2.2–4.7 km, as opposed to an average conspecific nest distance of 6–20 km elsewhere (Tarboton Reference Tarboton1982).
Although South Africa’s sparsely distributed population is estimated to number <1000 individuals, confidence in this estimate is low (Taylor Reference Taylor, Taylor, Peacock and Wanless2015). Tarboton (Reference Tarboton1982) assessed the breeding status of the Black Stork in the (then) Transvaal, an area covered in modern-day South Africa by the provinces of Limpopo, Mpumalanga, Gauteng, and North West. Between 1976 and 1981, Tarboton (Reference Tarboton1982) identified 40 Black Stork nest sites in this area, containing approximately 50–70 breeding pairs. The Black Stork’s choice of breeding habitat and reliance on seasonal rainfall makes accurate population estimates very difficult (Siegfried Reference Siegfried1967). This is compounded by the bird’s breeding habits: some birds are faithful to one nest location, whilst others may use different nests in a local area in successive years, resulting in nests that are occupied in some years but not in others (Siegfried Reference Siegfried1967). Since most of the Black Stork’s breeding habitat was in remote areas least affected by a growing human population and by urban and rural development, it was concluded that the species was not threatened in the old Transvaal region (Tarboton Reference Tarboton1982). Tarboton’s (Reference Tarboton1982) publication represents the last known publication on the status of Black Stork in South Africa and newer information on the status of the resident southern African population remains largely anecdotal. If one considers the severe environmental changes that have occurred since 1982 (Jewitt et al. Reference Jewitt, Goodman, Erasmus, O’Connor and Witkowski2015, Scholes and Biggs Reference Scholes and Biggs2005), the status of the population is in urgent need of review.
Regional status assessments of Black Storks in southern Africa have been carried out several times since the late 1960s (Siegfried Reference Siegfried1967, Tarboton Reference Tarboton1982, Taylor Reference Taylor, Taylor, Peacock and Wanless2015). These assessments have relied on sightings data collected from surveys across the region but have not made use of modern habitat distribution modelling techniques to quantify the availability of breeding and foraging habitat for this species in southern Africa. In this study we aim to provide a more robust estimate of the available suitable habitat for breeding and foraging Black Storks across South Africa using a combination of field-based surveys, citizen science databases, as well as distribution and population modelling techniques.
Methods
Breeding surveys
To ascertain breeding activity, we revisited historic sites captured by Tarboton (Reference Tarboton1982) and surveyed these regions for new breeding activity. From 1976 to 1981, 40 Black Stork nest sites were surveyed in northern South Africa (Tarboton Reference Tarboton1982). Of these 40 historical nest sites, we resurveyed six nests located on the Luvuvhu River and Mutale River in northern Limpopo Province, each year from 2017 to 2019 (Figure 1). Historical nest sites in the Waterberg region, i.e. Naauwpoort (−24. 612, 28.539), Buffelspoort (−24.773, 28.303), Kranskop (−24.723, 28.532), Mooiwater (−24.418, 28.074), Witkop (−24.791, 28.737), and Sussenvale (−24.771, 28.347) were checked for breeding activity in July 2016 and 2017, respectively. A survey of the Magaliesberg Mountain range was conducted on 5 May 2018 at two known nesting sites in the Nooitgedacht (−25.858, 27.537) and Skeerpoort (−25.748, 27.762) areas. A reported nest site on the Lapalala Game Reserve (−23.851, 28.334) was also checked for recent breeding activity in February 2020 (no breeding), but breeding was confirmed in September 2021. Observers spent a minimum of one hour (usually two) at strategically selected vantage points (with good visibility and coverage of key sections of the targeted cliff-line), to passively observe (using binoculars and telescopes) any Black Stork activity.
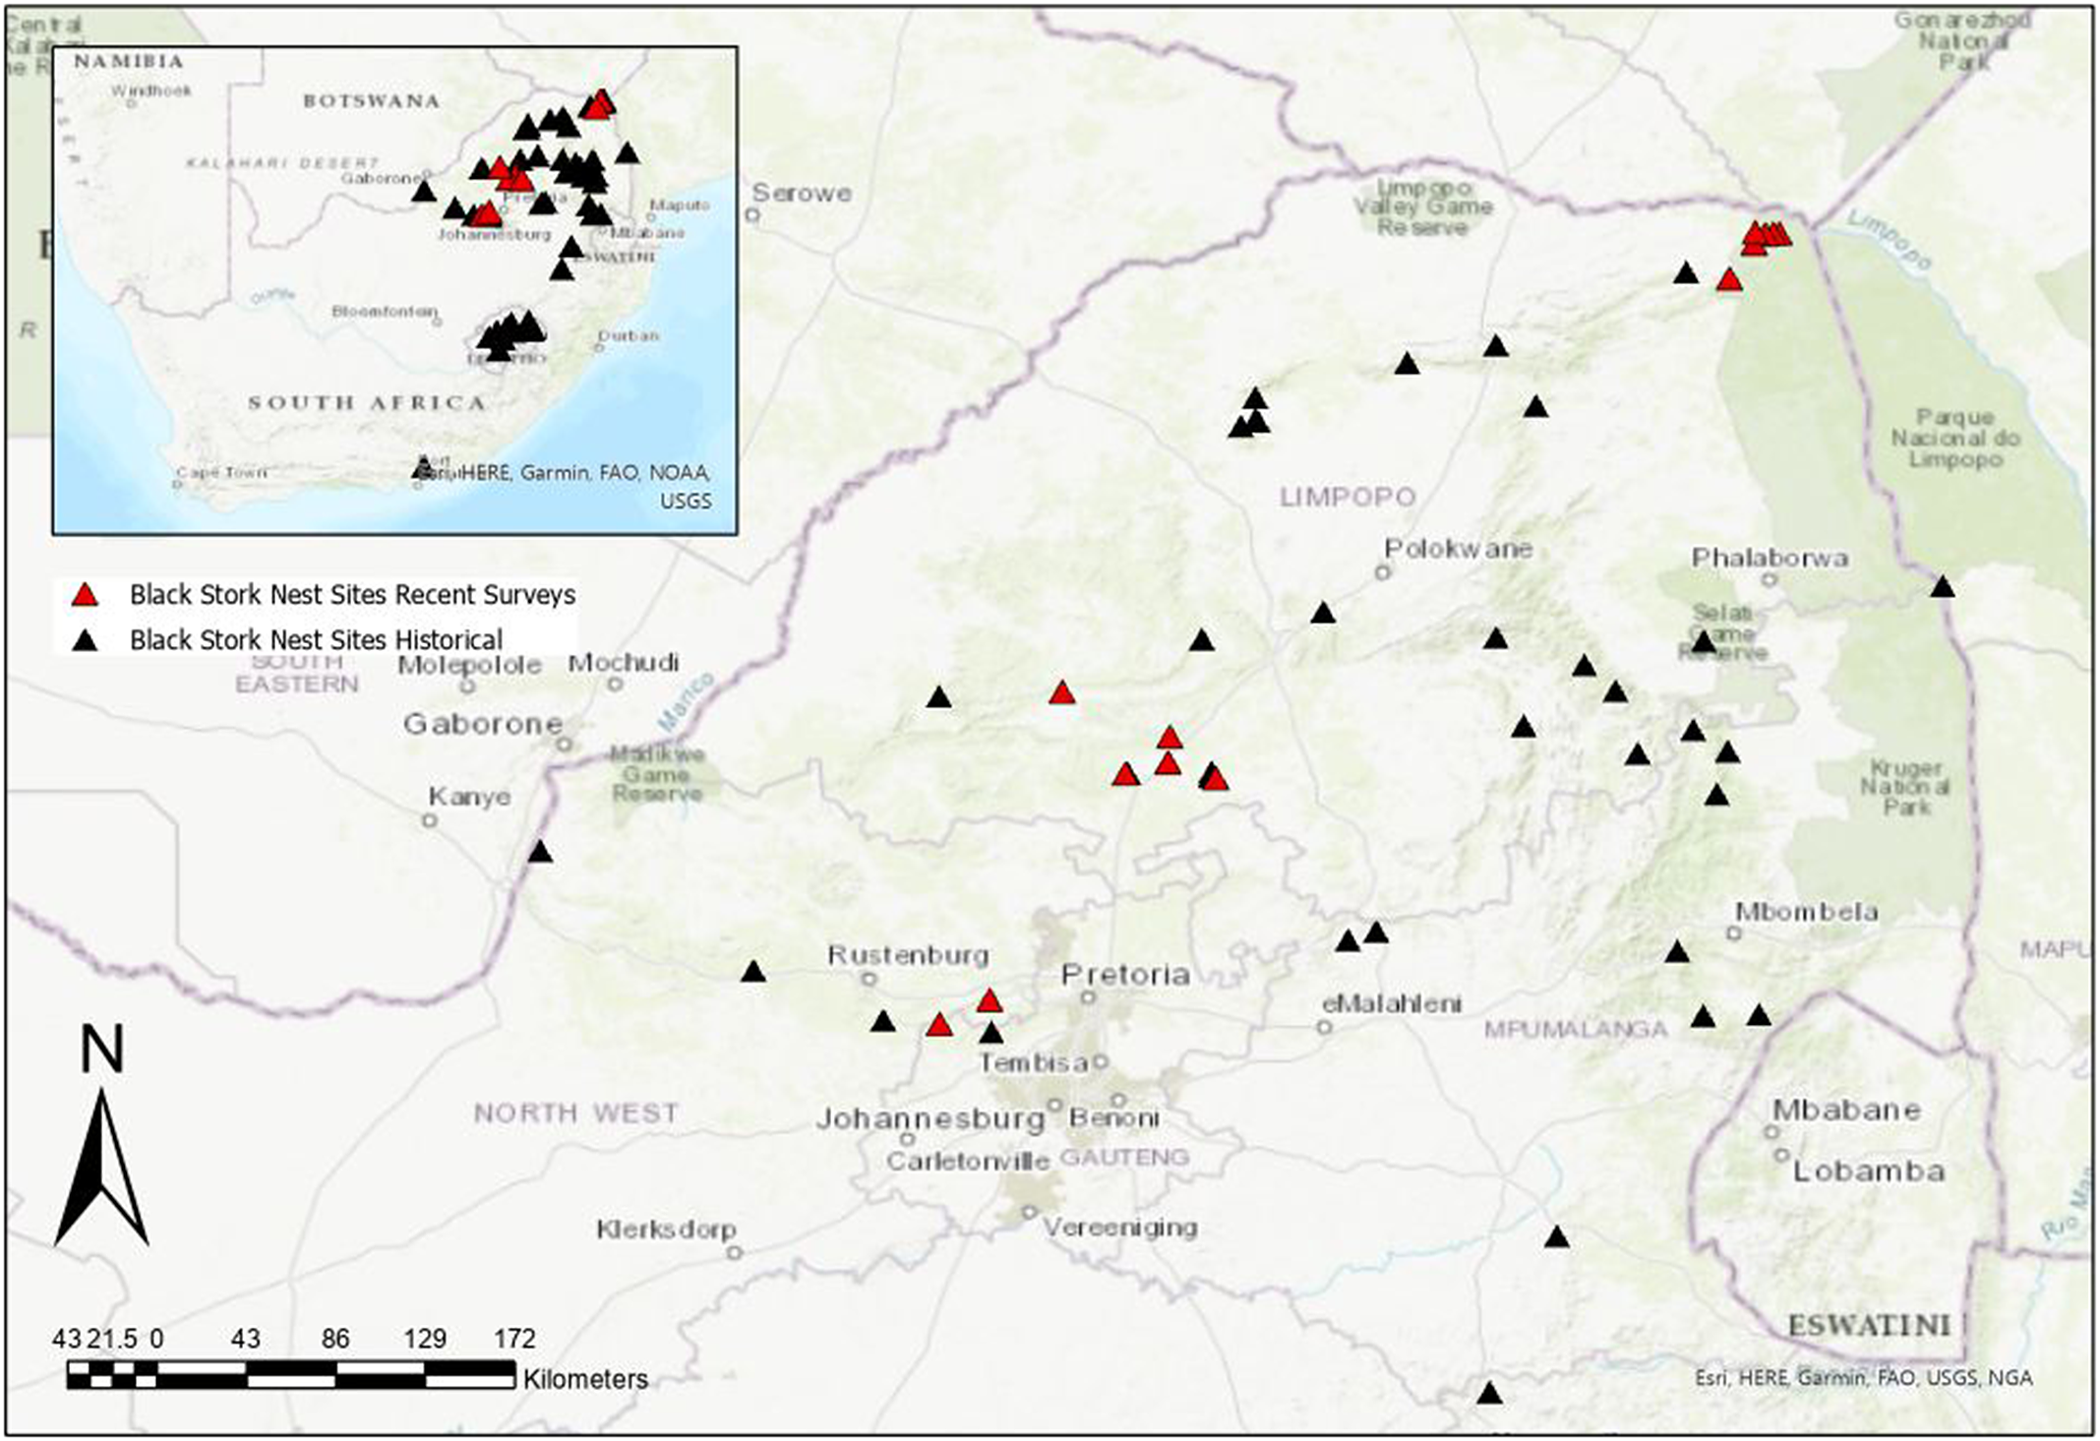
Figure 1. Historical Black Stork nest sites (black triangles) and recently resurveyed sites (red triangles) across northern South Africa.
To search for new nest locations and foraging individuals, a team of up to six people surveyed the northern Greater Kruger Region. We conducted these surveys on foot along strategically selected sections of the Luvuvhu River valley which contained known historical nest sites (Figure 1). Approximately 50 km of river valley with potential nesting cliffs was walked between where the Luvuvhu River forms the Kruger National Park boundary (−22.713, 30.889) and Crooks Corner (−22.426, 31.307) during each survey year. Breeding records were also obtained from ad-hoc breeding reports across South Africa during this period (2018–2021), contributed mostly by WT, AJ, and DA.
Habitat suitability models
Habitat suitability models (species distribution models) were created to model foraging range using point location data, as well as to model breeding range based on nest record data. As the available data were presence-only data, we used the machine learning maximum entropy modelling approach of Maxent 3.3.3k (Phillips et al. Reference Phillips, Anderson and Schapire2006) to construct these models. For model validation, we used 20 cross-validation replicate runs, with training iterations set to 5,000. We used the logistic output format. Variable importance was measured using the jackknife feature, and we examined response curves to determine how variables were influencing predictions from resulting plot data. Models were run sequentially, excluding variables making up less than 1% contribution of the full model. We used the area under the curve (AUC) of the receiver-operating characteristics to determine the ability of the models to distinguish between suitable and unsuitable areas (Phillips et al. Reference Phillips, Anderson and Schapire2006). We used the “logistic threshold for equal training sensitivity and specificity” for both models (breeding and foraging) to determine possible presence and absence areas, and represented these graphically following the modelling strategy of Spottiswoode et al. (Reference Spottiswoode, Olsson, Mills, Cohen, Francis, Toye and Hoddinott2013). The area covered by SABAP2 distribution maps was used to validate models (see description below).
Species point location data for the foraging range model
For the foraging range model, we used Black Stork GPS point location data submitted via the BirdLasser bird reporting app (Lee and Nel Reference Lee and Nel2020) between 2015 and 2021. These location data are not vetted, and often represent locations of observers at the time of a sighting (Evans Reference Evans2021), as well as potential errors in identification. As such, this dataset was manually vetted. The first step was to cross-check the data points against known distributions, such as SABAP2 distribution maps, maps from the 2015 Eskom red data book of birds of South Africa, Lesotho, and Swaziland (Taylor et al. Reference Taylor, Peacock and Wanless2015), and against land cover spatial layers. To ensure equal sampling distribution through the species range we assigned points to a 3 km × 3 km grid system. Duplicate records in each cell were randomly removed until only one record remained. As the location data indicated the location of the bird observer rather than the location of the observed bird, some points were edited by manually moving them to the closest suitable habitat for the species: water bodies were considered suitable habitat and were identified via satellite imagery and land cover layers. Points were deleted where there was uncertainty, and the record was assumed to be either an error or represented the species flying over. At the end of the data preparation process, we had 532 occurrence data points.
Species point location data for the breeding range model
For our breeding distribution model we used the historical nest locations and recent ad-hoc records. We searched for additional nest site data from iNaturalist (a citizen science biota logging application), finding one record. After data were thinned as per the process for the foraging range distribution model above, we had 50 occurrence points.
Environmental covariate data
We used a range of bioclimatic variables from the WorldClim database (Fick and Hijmans Reference Fick and Hijmans2017), and environmental variables as predictor variables in our models (Table S1). Environmental covariates included aspect, soil type (Jones et al. Reference Jones, Breuning-Madsen, Brossard, Dampha, Deckers, Dewitte and Gallali2013), terrain ruggedness (Riley et al. Reference Riley, DeGloria and Elliot1999), slope, and waterbodies from the South African national land cover dataset (DFFE 2020). All environmental covariates were downscaled to the layer with the highest resolution, namely land cover (30 m spatial resolution).
Analysis of relative abundance changes from SABAP data
We use the ongoing SABAP2, together with the first SABAP project (SABAP1 1987–1992), to examine metrics of abundance and range change. These are citizen science projects using the “BirdMap” protocol (Brooks et al. in review). In short, birders submit bird lists using a set protocol that involves a minimum of two hours of birding effort in a geospatial cell known as a pentad (an area 5 × 5 minutes latitude and longitude). The spatial sampling scale of SABAP1 was the quarter degree grid cell (QDGC), each of which contains nine pentads. Areas with multiple lists allow indices of abundance to be calculated, as well as abundance change if examined with a temporal gradient (Lee et al. Reference Lee, Altwegg and Barnard2017). The simplest measure of abundance is “reporting rate”, which is the number of times a species appears across a selection of lists, expressed as a proportion (or percentage).
Abundance and range change between SABAP1 and SABAP2
To compare range and relative abundance changes between SABAP1 and SABAP2, we present the summarised reporting rate data from these databases. To create confidence intervals (CI) of reporting rate and range changes between these projects that account for spatial sampling bias, we used the random sampling strategy of Brown et al. (Reference Brown, Arendse, Mels and Lee2019). In essence, a bootstrap of 1,000 draws of 50 pentads from across the species range is performed, and 95% CI calculated. We considered only QDGCs with more than four lists, and used only those within South Africa, Lesotho, and Eswatini. To give context to the results, we repeated this exercise for the morphologically and ecologically similar Saddle-billed Stork Ephippiorhynchus senegalensis.
Abundance changes within the SABAP2 temporal period
We examined relative abundance change over the 14-year period (2008–2021) using SABAP2 full protocol cards (SABAP 2021). It should be noted that the spatial domain of this data set is smaller compared with the SABAP1 range, resulting in slightly higher reporting rates compared with the previous analysis step, as regions where the species was recorded during SABAP1 but not SABAP2 are excluded.
Interannual reporting rates were examined at several temporal scales. In the first instance, this was to check that there were no seasonal changes that may be resulting from migrations from other parts of the species’ range. A slight temporal pattern in reporting rate was detected (Figure S2) and as such, further investigation was undertaken in relation to the breeding season (May–October, representing the nesting period and two months post fledging associated with fledgling dependence on parents), and at different spatial scales. To identify if there had been any decrease in the probability of recording a species across this set of pentads from 2008 to 2019, we performed the following filtering steps: only the pentads within South Africa, Eswatini, and Lesotho were considered, only full protocol cards where it was indicated that all habitats had been visited were selected, and we considered only those pentads with more than four lists. We then summarised this data as to whether or not a species had been recorded (i.e. binary) within a pentad for each month of each year. Following the methods of Brown et al. (Reference Brown, Arendse, Mels and Lee2019), we then modelled the probability of reporting as logistic regression with predictor variables year (scaled to 1–12), breeding season (Yes/No), and longitude (for spatial effects) with the log of number of lists as an offset, pentad as a random effect, and “period” being the years 2008–2014 and 2015–2019 due to the influence of the data submission pathway (Lee and Nel Reference Lee and Nel2020). We only considered data to 2019 due to the influence of the Covid-19 pandemic and associated lockdowns on atlassing efforts during 2020 and 2021 (Rose et al. Reference Rose, Suri, Brooks and Ryan2020). We used the lmerTest package (Kuznetsova et al. Reference Kuznetsova, Brockhoff and Christensen2017) as wrapper for the lme4 package (Bates et al. Reference Bates, Mächler, Bolker and Walker2015) in R to implement our model. We used Akaike information criterion (AIC) to compare between competing models, with a-priori models selected to examine our biological questions. Our null model included intercept plus the controlling variables (numbers of lists, pentads, and periods). We report on the full model, null model, and top model by AIC. The null and full models were the only models within two AIC of the top model.
The above modelling process, being binary, has the potential to mask relative abundance change, i.e. limited capacity to tell one from 10 birds from locations where the bird can occur. Specifically, to examine potential population declines in the western range, as suggested by the SABAP1–SABAP2 changes, we aimed to identify any interaction between breeding season and abundance. We defined the western part of the range as being west of 27 longitude (from inspection of distribution records). We then performed a Poisson generalised linear model regression of abundance in pentads using log-transformed reporting rate as percentage plus 0.1 (to correct for log 0 and reduce variance inflation parameters) as the measure of abundance, with reporting rate summarised for the 2008–2019 period by geographical region and breeding season, including the interaction of these parameters. We also present linear model results of reporting rates as a function of year for the subset of pentads identified as breeding range pentads from the Maxent modelling.
For graphical interpretation of trends, we also provide summarised reporting rates across the species range, by year, separating the 310 pentads which overlay the Kruger National Park. This protected area was identified as a region with year-round high reporting rates during the above modelling steps and was also a region of interest given our surveys in the north. The Kruger National Park area has received extensive and consistent coverage throughout the SABAP2 project due to the high degree of tourism in the park.
Population distribution modelling accounting for breeding season using random forest predictive modelling applied to SABAP2 data
The Maxent models allow fine-scale habitat suitability modelling using point location data and fine resolution remote-sensing products. However, the BirdLasser point data are limited in their ability to capture the suspected within range movement associated with breeding season given the lack of confirmed absence data coupled with the more limited temporal scale. Thus, to map breeding and non-breeding season ranges we used the random forest machine learning methods as implemented through the ranger package in R (Wright and Ziegler Reference Wright and Ziegler2017) using presence and absence from SABAP2 pentad data. For our predictive surface we created training and testing surfaces of the region based on a randomised 50–50 split of pentads, using this threshold to reduce spatial sampling bias. We filtered data based on pentads with two or more cards. We also further implemented a vagrancy step for pentads with >100 cards but less than 1% reporting rate, these locations were converted to 0: in South Africa only some pentads in urban environments satisfy this criterion. For breeding and non-breeding season we then implemented predictive modelling based on the WorldClim variables and values derived from the South African Landuse cover (DFFE 2020), summarising percentage cover in a pentad for water (natural and artificial lakes), wetlands, rivers, forest cover, agricultural land (all types), fallow land, all urban and residential cover types, and mining. For breeding season (May–October) and non-breeding season we then ran 1,000 models, presenting a visual model of the mean of these predictions, and associated image of standard deviation. Compared with the Maxent models, these are at a much more coarse resolution (pentad). Model validation was performed using the yardstick package in R (Kuhn and Vaughan Reference Kuhn and Vaughan2021), classifying pentads with >0.5 probability of occurrence as predictions of presence. We report on accuracy, sensitivity, and specificity for model performance.
Black Stork population estimation in South Africa, Lesotho, and Eswatini
Population estimation and trends have recently been calculated from SABAP2 data for Black Harrier Circus maurus using probability surfaces (Cervantes et al. Reference Cervantes, Martins and Simmons2022). We examined potential population size using two techniques. First, we used the Maxent breeding range model output to aggregate suitable habitat at the pentad level and created a probability score of suitability between 0 and 1 by taking the mean across geospatial raster output using the “exact_extract” function from the exactextractr R package (Bason Reference Bason2021). We then assumed an absolute maximum of five pairs per pentad based on nest intervals in ideal habitat based on our surveys. This maximum was then multiplied by the habitat suitability probability for each pentad with a probability score of >0.058 (a low threshold, being half the sensitivity threshold) and >0.321 (a high threshold, being twice the sensitivity threshold), i.e. in each case
 $$ N=\sum \limits_np\hskip0.2em \ast \hskip0.2em 5 $$
where N is the population (or carrying capacity estimate in this case), n is the number of pentads at the given probability threshold, and P is the mean probability output. The result provided an indication of breeding pair carrying capacity across this geographical domain.
Secondly, the analysis of seasonal distribution across South Africa strongly suggested a large proportion of the population is outside the predicted breeding range during the breeding season. We thus used the seasonal distribution random forest models in a similar manner to estimate populations as that for the Maxent model. However, in this case we used a probability surface of >0.5, as the probability surface was very extensive and included most of the subregion where we can confidently assume general absence. Based on our recent transect encounter rates, we further assumed density in pentad to be between two and four individuals for the non-breeding season distribution at peak capacity.
We then used the International Union for the Conservation of Nature (IUCN) Criterion A worksheets to estimate annual rates of decline based on the above results. Generation length was 15.9 (Bird et al. Reference Bird, Martin, Akçakaya, Gilroy, Burfield, Garnett and Symes2020), with starting year set to 1990 and end year 2020, and a range of population estimates centred around estimated start values (950) and end values (600), using the exponential change model.
Results
Breeding surveys
Of the 17 historical sites checked over our six-year survey, we found conclusive evidence of breeding at only two sites. None of the historical nests in the Waterberg region were found to be active; these seemed to have been abandoned for several years. Breeding surveys along the Luvuvhu River in northern Kruger National Park only managed to locate one active nest (−22.461, 31.069) with an approximately 30-day-old chick in 2018. This nest was located 100 m upstream from one of Tarboton’s (Reference Tarboton1982) historical nest sites (Figure 1). No other active nest sites were found along the length of the Luvuvhu River. However, seven individuals were observed during the 2017 survey (1.4 individuals/10 km) and nine individuals (eight adults and one chick) were observed during the 2018 survey (1.8 individuals/10 km).
The 2018 survey at the Skeerpoort Cape Vulture Colony (Magaliesberg) recorded a pair of Black Storks performing what was likely a breeding display. A presumed male was flying in tandem above a presumed female in front of the cliff face with his white undertail coverts spread. No nest was observed during this survey. Incidental surveys during 2021, a wetter than average year, revealed a breeding site in Lesotho located while monitoring Southern Bald Ibis, and three new sites that fledged young in the Waterberg region (WT).
Maxent breeding distribution model
The most influential variable predicting breeding distribution in our model was slope, with higher probability with increasing slope (indicating the presence of cliffs): percentage contribution was 59% and permutation importance was 78.3% (see Table S1 for final model results, Figure 3 for the probability surface, and Table S2 for response curves). Other important variables included annual rainfall and mean annual temperature. The equal training sensitivity and specificity logistic threshold for this model was 0.1156. The average test AUC for the cross validation replicate runs was 0.955 ± 0.076 (SD).
The binary breeding model output using the logistic threshold (Figure 2) highlighted the cliffs in the north and eastern parts of South Africa, especially in Lesotho and the Soutpansberg, Waterberg, and Magaliesberg Mountain ranges. This model also identified areas in the Western Cape and Northern Cape Provinces, even though there are no recent breeding records in the model identified areas. However, there are historical records for these areas (Allan Reference Allan, Harrison, Allan, Underhill, Herremans, Tree, Parker and Brown1997), and as there is potential for these sites to be used for breeding in future, they should be considered potential breeding habitat for this species.
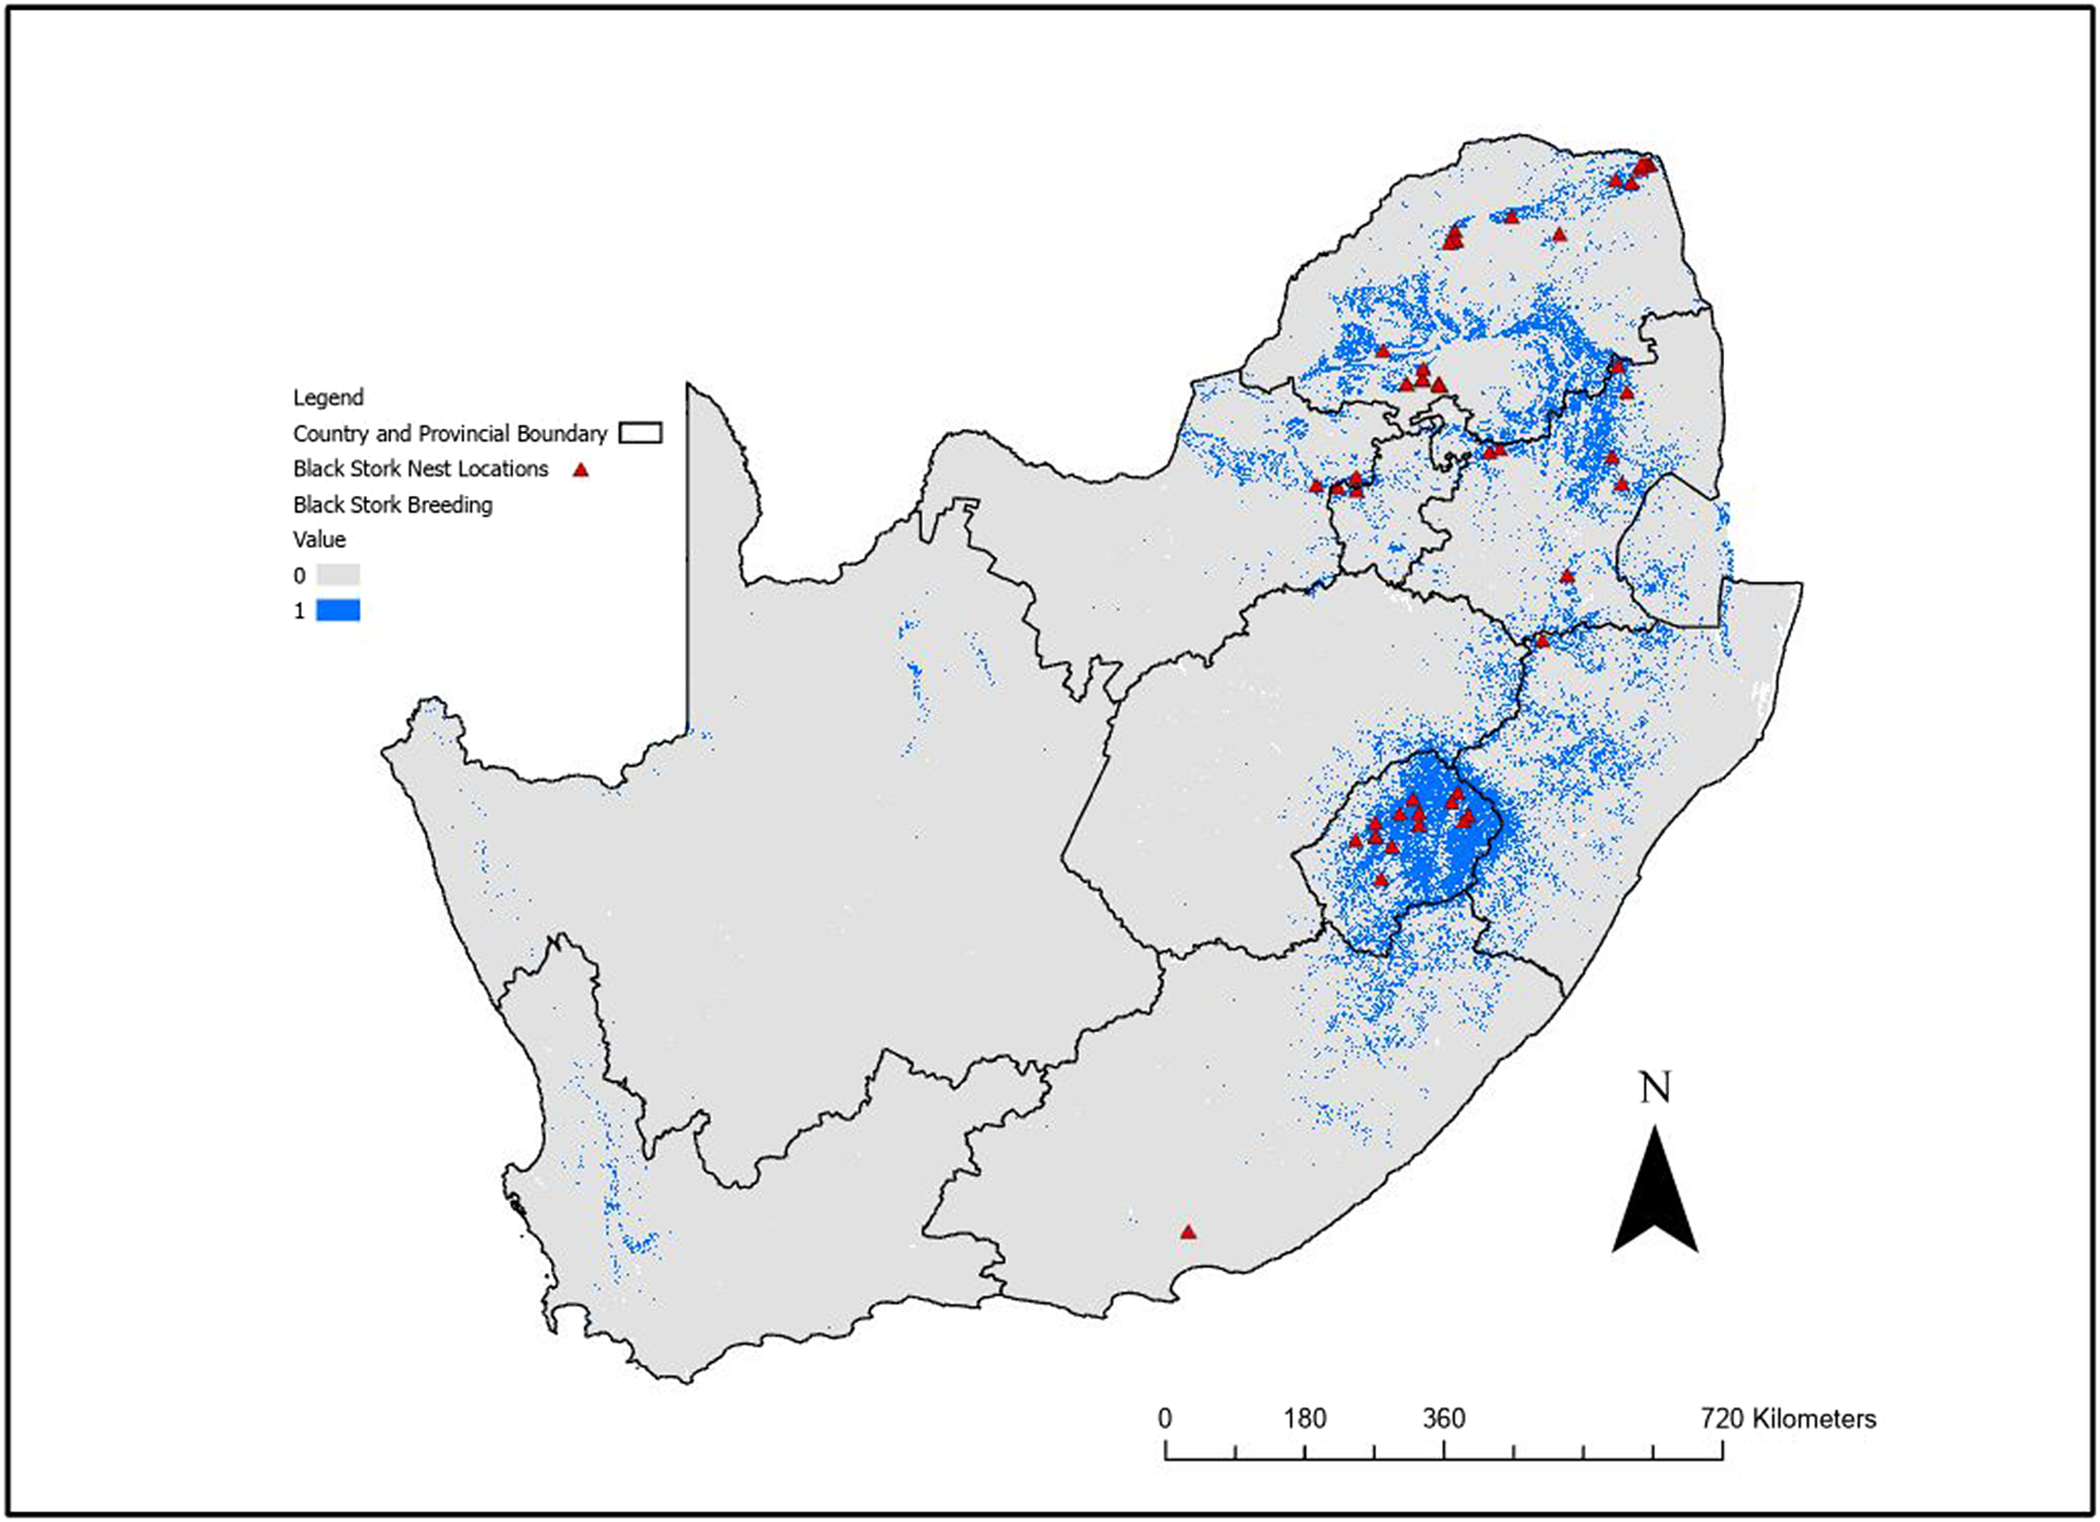
Figure 2. Binary output from the Maxent breeding range distribution model for Black Stork after application of the sensitivity threshold for South Africa, Lesotho, and Eswatini. Blue (value = 1) indicates suitable breeding habitat, with nest records used for modelling indicated. Black lines indicate provincial or national boundaries.
Maxent foraging distribution model
The most influential variable predicting the foraging range was drainage lines with a 25% contribution and a permutation importance of 18.9. Mean temperature in the coldest quarter (Bio11) and a subset of land cover with dams with a buffer of 300 m were the next two most important variables. The equal training sensitivity and specificity logistic threshold was 0.193. The average test AUC for the replicate runs was 0.908 ± 0.029 (SD).
The foraging model (Figure 3, Figure S3) identified the southern and eastern provinces as regions with highest suitability, with less suitable habitat in the Free State, Northern Cape as well as the western section of the North West Province. The model identified rivers, dams, and other water bodies used by the species. The foraging model predicted 150,210 km2 of suitable foraging habitat, while the breeding model predicted 313,034 km2 of the area covering South Africa, Lesotho, and Eswatini.
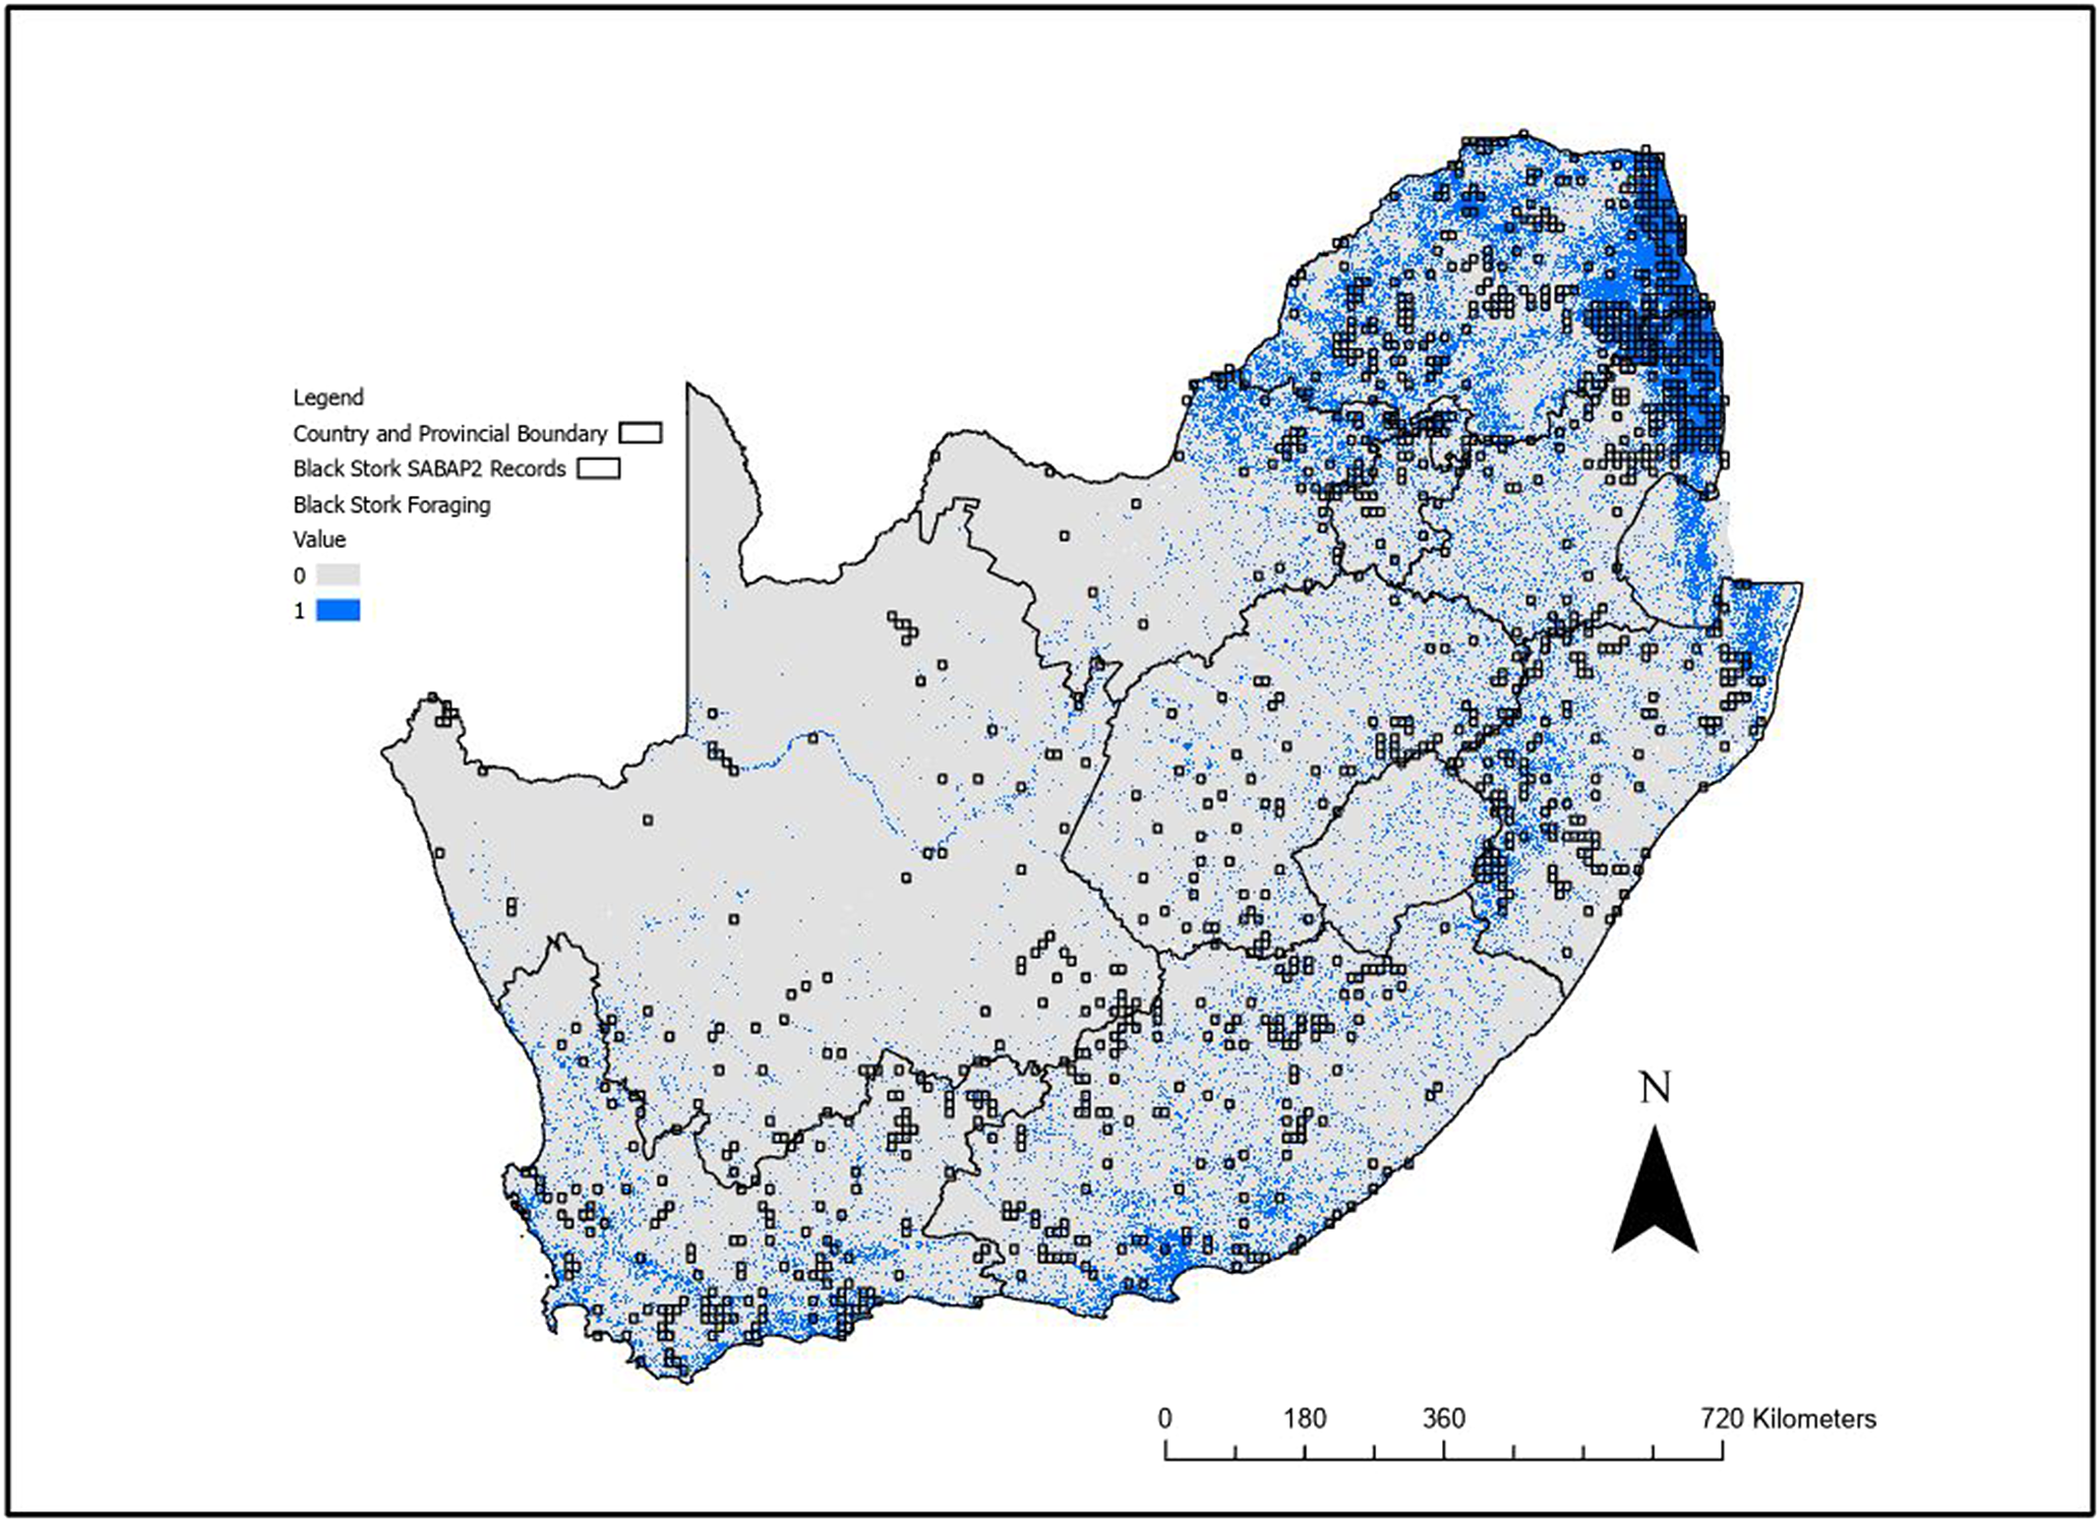
Figure 3. Binary outputs from the Maxent foraging range distribution model for Black Stork using the 0.193 sensitivity threshold. Blue (value = 1) indicates suitable foraging habitat. The area covered by this threshold is 150,210 km2. The second Southern African Bird Atlas Projects (SABAP2) pentads where the species has been recorded are also shown (squares).
At the derived threshold of the habitat suitability model for foraging range, 100% of SABAP2 pentads where Black Stork have been recorded overlapped with the predicted foraging model outputs. While there was also substantial prediction into areas where no Black Storks have yet been recorded, a visual inspection showed this is usually near to SABAP2 records and there appeared to be little systematic over prediction.
Population changes from SABAP data
Changes between SABAP1 and SABAP2
Compared with SABAP1, Black Stork is now a rarely encountered species in the southern African historical reporting domain: mean reporting rate within the SABAP1 historical range for SABAP2 was 1.7% (95% CI: 1.5–1.9%) compared with 7.7% (CI = 6.6–7.7%) during SABAP1. Declines in relative abundance (as measured by reporting rate) as well as range are significant: the percentage reporting rate change is −75% (CI: −73% to −77%) and range change is −35% (CI: −33 to −37%). By comparison, Saddle-billed Stork reporting rate change was −54% (CI = −52% to −56%) and range change was −5% (CI: −2 to –8%). In other words, there was an indication of a decrease in abundance for Saddle-billed Stork, but not for its range. Black Stork has not been detected in 56% of QDGCs during SABAP2, which recorded the species in SABAP1 (Figure 4). Declines in reporting rates of Black Stork were recorded in 21% of QDGCs between the two projects. Despite the notable declines, Black Stork have been recorded with higher reporting rates in SABAP2 for 6% of QDGCs, and have been recorded for the first time in 13% of QDGCs that did not record the species during SABAP1 (Figure 4). However, SABAP2 has had far greater temporal coverage compared with SABAP1.

Figure 4. (A) A comparison of the changes in reporting rates for Black Stork between the first and second Southern African Bird Atlas Projects (SABAP1 and SABAP2) at the quarter degree scale. The “absent” category means the species has only been recorded in SABAP1 and not in SABAP2, while the “new” category indicates that the species has only been observed in those quarter degree grid cell (QDGCs) during SABAP2. (B) A map of change, with red indicating decreased reporting rate between atlas periods (as percentage), and blue indicating increases. Dark grey indicates no occurrence records for either period.
Changes within SABAP2
Across the species range, the analysis of the probability of reporting within the SABAP2 2008–2019 period did not identify year as significant when accounting for atlassing effort (Table 1). The best model included breeding season with a trend towards higher probability of reporting outside the breeding season. There is a consistent but non-significant lower probability of reporting for the more recent sampling period (2015–2019). The reporting rate model (Table 2) shows stronger evidence for a spatial and temporal pattern of reporting, with higher reporting in the west in the non-breeding season (Figure 5). However, year was a significant negative predictor of reporting rate when considering only the subset of 228 pentads identified as suitable breeding habitat from the Maxent model (model estimate = −0.161 ± 0.056%, t = −2.87, P = 0.014).
Table 1. Model results of a logistic regression examining the probability of reporting across the second Southern African Bird Atlas Project (SABAP2) sampling period 2008–2019 for those pentads of the Black Stork SABAP2 range sampled more than four times across all habitats. Sampling effort was used as an offset in this model, and pentad was considered a random effect. AIC = Akaike information criterion.

Table 2. Model output examining reporting rate change (log reporting rate + 0.1) in relation to the interaction between broad spatial regions across South Africa (west or east of 27°E) and breeding season (breeding “Yes” is May–October). Intercept here is west in non-breeding season, with 408 degrees of freedom


Figure 5. Modelling of the log reporting rate from the second Southern African Bird Atlas Projects (SABAP2) data suggests an interaction between breeding season and broad geographical region, with higher reporting in the west during the non-breeding season.
Kruger National Park
Kruger National Park was identified as an important foraging area for Black Stork in the foraging distribution models. It is one of the most well atlassed areas within SABAP2 and allows an inspection of interannual relative abundance changes. A close inspection of the 310 pentads which cover this reserve showed a peak reporting rate of close to 8% in 2013, followed by a moderate decline in the reporting rates of Black Stork between 2014 and 2018, which coincides with the occurrence of a severe drought across the region (Figure 6). Movement between the Kruger National Park and the rest of South Africa is likely a frequent occurrence, with a seasonal pattern suggested when inspecting the annual daily reporting rate patterns (Figure 7). This pattern suggests a higher reporting rate in the Kruger National Park during the non-breeding season.

Figure 6. (Top) The mean annual reporting rates for Black Stork range inside and outside Kruger National Park (n = 308 pentads) during the second Southern African Bird Atlas Project (SABAP2). (Bottom) Reporting rate for just the subset of pentads that occurs in the core breeding distribution. The line is a linear model fit, with grey shading indicating 95% confidence intervals. Note: 2021 was an above average rainfall year.

Figure 7. Reporting rate here (static line) is the average calendar day reporting rate across the relevant range in the entire second Southern African Bird Atlas Project (SABAP2) survey period (using data for all years), for inside and outside Kruger National Park. The smooth black line is the period May–October (breeding season = Yes), a loess fit, with 95% confidence interval as grey shading.
Population distribution modelling accounting for breeding season using random forest predictive modelling applied to SABAP2 data
The random forest predictive modelling provided a good fit to the data, with test accuracy 0.91 and sensitivity 0.99. Specificity, however, was 0.12, indicating substantial predictions to regions where the species has not been recorded during SABAP2. The visual interpretation of the breeding and non-breeding random forest predictive models of Black Stork across our modelling domain revealed a higher probability of occurrence associated with the modelled breeding region during the breeding season, but that there was still extensive probability of occurrence outside optimal breeding regions (Figure 8). The probabilities of encountering the species outside optimal breeding habitat are much more extensive outside the breeding season (austral summer and autumn) (Figure 8).

Figure 8. Random forest predictive models at the pentad level presenting mean probability of occurrence from 1,000 model runs using randomised presence/absence data from the second Southern African Bird Atlas Project (SABAP2). The left column is the breeding season, and the right column the non-breeding season. The middle row is the 50% threshold, with red representing values >0.5, while the lowest panel indicates standard deviation of the predictions: where blue in this chart and grey in the charts above coincide, we can be confident of absence.
Black Stork population estimation in South Africa, Lesotho, and Eswatini
The breeding site carrying capacity based on the Maxent breeding habitat suitability model gave a range of 924–2,228 pairs. The non-breeding random forest model population estimation was based on the possibility of the presence of birds in 262 pentads across South Africa and Lesotho, resulting in a population range of 319–638 individuals (all age classes). An unlikely upper limit on the population estimate, based on a possible 10 birds per pentad, is 1,596. Given that Lesotho consistently comes out as a region of high importance for Black Stork across modelling pathways, but given a recent breeding pair estimate of 20 (Ambrose Reference Ambrose2020), we consider it extremely unlikely the population approaches the upper limit. Taken together, it is unlikely the breeding population of South Africa, Lesotho, and Eswatini exceeds 300 pairs.
Discussion
Breeding surveys
Our formal surveys of historical breeding locations revealed a lack of breeding activity over a multi-year period, and we found no new breeding locations. These surveys corresponded with dry years (Swemmer et al. Reference Swemmer, Bond, Donaldson, Hempson, Malherbe and Smit2018). Otherwise, surveys consisted of structured as well as opportunistic surveys: this survey team has concurrently been monitoring various other species that nest in similar cliff habitats, e.g. Cape Vulture, Southern Bald Ibis, Peregrine Falcon, and Taita Falcon Falco fasciinucha. These revealed just two previously unknown breeding sites (one in South Africa, one in Lesotho). Three active and successful nests were monitored in the Waterberg areas in 2021, a year corresponding to above-average rainfall (WT local observations). However, the citizen science SABAP2 results indicated that much of the population is outside the breeding range (e.g. in southern Kruger National Park) during the breeding season, suggesting a substantial non-breeding population. Overall, these patterns have alarming implications for species recruitment, especially since existing population estimates, and our population estimates suggest a small total population of <700 individuals.
While based on small samples (all that are possible for this species), our available evidence suggests that breeding is tied to rainfall. Large tracts of north-eastern South Africa experienced a drought from 2014 to 2016, although this did not result in the total drying up of many of the major perennial river systems (Swemmer et al. Reference Swemmer, Bond, Donaldson, Hempson, Malherbe and Smit2018). Initial periods of drought can also result in hyper food abundance with fish trapped in drying puddles. Tarboton (Reference Tarboton1982) noted that the large perennial rivers in the Kruger National Park are likely a refuge against the impacts of droughts for Black Storks, with historically large flocks of birds observed in the winter breeding months when the previous summer’s rainfall has been poor, and breeding is unlikely to have taken place (Bell Reference Bell1969, Ross Reference Ross1966, Siegfried Reference Siegfried1967). It is unclear whether any breeding took place during the drought, but the potential knock-on effects of the extended low rainfall period have likely been documented in this study. Tarboton (Reference Tarboton1982) suggested that a lack of suitable foraging sites close to nesting sites is a possible reason for the scarcity of Black Storks in South Africa. Indeed, modelling nest site carrying capacity suggested there never has been a massive population of Black Storks in this region, but currently the population is also not limited by nest site availability.
Habitat suitability modelling
Our spatial models suggest a narrow breeding range centred on the eastern escarpment and associated mountain ranges, but a much more extensive foraging range tied to water availability. Both our modelling approaches essentially suggest Black Storks could potentially be found across much of the region outside of the breeding season, but probabilities are very low and this is reflected in the isolated and incidental records scattered across much of the drier western parts of the country. The larger non-breeding range is more likely associated with post-breeding and juvenile dispersal than migration. Tracking of several large-bodied bird species has revealed extensive dispersal across the subregion (Reading et al. Reference Reading, Bradley, Hancock, Garbett, Selebatso and Maude2019, Whitecross et al. Reference Whitecross, Retief and Smit-Robinson2019). The sustained presence of birds in the Kruger National Park points to the importance of this conservation area to this species.
Breeding population
Taylor et al, (2015) estimated <1000 breeding birds across South Africa, Lesotho, and Eswatini based on low reporting rates and historical breeding records (although note that the Anderson Reference Anderson2005 estimates was for a similar population for the entire southern Africa geographical domain, which includes Namibia and Zimbabwe). Our estimate of the number of potential breeding pairs is in general agreement with the Anderson (Reference Anderson2005) estimates, as is our population estimate based on foraging range. This assumes a similar situation in Namibia and Zimbabwe, outside our modelling domain, but for which we have little reason to believe the situation is better. Our population estimates are a consequence of our modelling pathways and a resulting probability surface extrapolated across the survey domain, with thresholds based on our experiences of the species. There are many assumptions related to these figures, and so at best we have medium confidence in these. For instance, the models would assume stationarity, but we used data from over many years accumulated through the atlas project and birds are mobile across the landscape. In essence, a few birds dispersing widely but recorded regularly could result in figures based on this method not representative of the real population, which is very much the likely scenario for Black Stork. Therefore, we view the upper estimates based on the foraging model (those >1000) as extremely unlikely in reality, especially based on observations from the breeding grounds.
Kopij (Reference Kopij2016) provided breeding site estimates of 35–50 for Lesotho based on surveys from 1996 to 2002. Ambrose (Reference Ambrose2020) commented on the estimate of up to 50 breeding pairs in Lesotho as an overestimate, suggesting there are likely no more than 20 pairs. He also noted that a well-known nest site near the Roma University campus had been abandoned. The Lesotho highlands consistently come out as important, especially for the breeding population, through all the spatial models we examined. If Ambrose (Reference Ambrose2020) is correct, and extrapolating these figures to other potential breeding sites, then the breeding population for the subregion would most likely only be in the low hundreds. However, surveys by DGA and AJ (unpublished data) suggest the Kopij (Reference Kopij2016) estimate is likely to be still accurate. Eswatini may hold 10 pairs and cannot be considered a significant stronghold for the species, although these pairs are important and must be protected (Monadjem et al. Reference Monadjem, Boycott, Parker and Culverwell2003).
The paucity of records from the Western Cape during the SABAP2 period is noticeable. AJ and Anthony van Zyl recorded two active nests in late October 2020, both on the Teekloof River gorge straddling the escarpment between the Western and Northern Cape Provinces. The Baviaanskloof is an IBA (SA093) that purportedly hosts a breeding population of 4–10 pairs of Black Storks (Marnewick et al. Reference Marnewick, Retief, Theron, Wright and Anderson2015). One of this manuscript’s authors (ATKL) is a resident of the western Baviaanskloof and is not aware of any breeding Black Storks, having observed them only in a transitory capacity and never during formal surveys through the region (Lee et al. Reference Lee, Barnard and Hockey2015). We located only one nest record from the citizen science database iNaturalist for a nest in the Zuurberg Mountains of the Eastern Cape Province.
Population change observed through the SABAP citizen science programmes
The comparison of SABAP1 and SABAP2 range and reporting rate measures confirmed the Smith et al. (Reference Smith, Underhill and Brooks2017) synthesis of population change analyses for the storks, suggesting greatest reporting declines and range contraction for Black Stork compared with any of the other southern African stork species. It is important at this juncture to note that for irruptive and mobile species, it is much harder to link actual populations to reporting rates (Lee et al. Reference Lee, Altwegg and Barnard2017, Lee and Barnard Reference Lee and Barnard2017). We employed the analysis pathway used by Brown et al. (Reference Brown, Arendse, Mels and Lee2019) for Black Oystercatchers, a species known to be expanding its range, and for which positive indicators of change using the atlas data were found. However, the finding of a dramatic decrease for Black Stork between atlas periods is moderated against a lack of significant range-wide declines reported from SABAP2 data from 2008 to 2019. A visual inspection of the regions from which Black Stork have not been recorded during SABAP2 highlights large areas of the south-western Cape, North-West, Free State, Eastern Cape, and Northern Cape Provinces. However, sightings across this region were and are erratic, and many of these locations do not offer suitable breeding habitat: data presented in The atlas of southern African birds (Harrison et al. Reference Harrison, Allan, Underhill, Herremans, Tree, Parker and Brown1997) indicate no breeding records for the Karoo region, but where reporting rates were high (>10%). Recent decades have recorded very dry conditions across the Karoo (Archer et al. Reference Archer, Du Toit, Engelbrecht, Hoffman, Landman, Malherbe and Stern2022). Lesotho and adjacent escarpment areas of the Eastern Cape, with high SABAP1 reporting rates, have been poorly surveyed during the SABAP2 period. An irruption event during the SABAP1 period resulting in high reporting rates cannot be ruled out and so we have only medium confidence that the dramatic decrease in reporting rate represents a real population collapse, especially given the low breeding site carrying capacity.
Inspection of SABAP2 data suggests that much of the former SABAP1 range may have been linked to post-breeding dispersal. A lack of recent breeding activity would explain the dramatic apparent population declines that could be inferred on the assumption that these locations represented resident birds and if previous records were instead from juvenile birds or post-breeding dispersing birds. Nonetheless, even across north and eastern South Africa, representing the known breeding range, there is a consistent pattern of decreased reporting between atlas periods. In addition, there are no current known nesting locations in the Cape Fold Mountains of the Western Cape (A. Turner, K. Shaw pers. comm. 2021), although there were breeding records associated with the SABAP1 period (Allan Reference Allan, Harrison, Allan, Underhill, Herremans, Tree, Parker and Brown1997).
A concern among citizen science projects are situations of misidentification. However, the adult Black Stork is a distinctive bird. Confusion is possible with Abdim’s Stork Ciconia abdimii: this migratory species was second only to Black Stork in terms of reduced reporting rates and range change (Smith et al. Reference Smith, Underhill and Brooks2017), and never occurred over much of the south-western region from which Black Stork has disappeared. However, juvenile Saddle-billed Storks, common in the Kruger National Park, may result in misidentifications.
Black Storks are long-lived creatures and as such, the slow declines we are observing in the SABAP2 data might be indicative of a population which is not losing many adults but is failing to recruit significant numbers of juveniles due to limited breeding. Given that climate change models predict a drier future for South Africa, and that this is already being observed, and that breeding appears tied to rainfall, is of concern for the species.
Conservation management guidelines
The information on threats facing the South African Black Stork population is sparse and should be re-evaluated. The most significant concern is the general lack of information on most aspects of the South African population. Although significant research has been carried out on the European population and associated population over-wintering in Africa, it is unclear whether these results are applicable to an isolated population that has been facing different environmental pressures for a significant amount of time. A review of the status of most stork species from across Africa, which did not include Black Stork, recommended revised conservation categories in almost all cases (Gula et al. Reference Gula, Clay Green, Fritts, Dean and Gopi Sundar2022).
Extensive research on the European Black Stork has identified habitat degradation, deforestation, industry, farming, building of dams, and powerline collisions as the major threats to the species in Europe (Anna Reference Anna2012, Chevallier et al. Reference Chevallier, Le Maho, Baillon, Duponnois, Dieulin, Brossault and De Franclieu2010). Likewise in southern Africa, loss and degradation of habitat through desertification and agricultural intensification, hunting and persecution at trout farms (Siegfried Reference Siegfried1967), pollution of wetlands through the build-up of pesticides and other chemicals, and collisions with powerlines (Zietsman Reference Zietsman1993) have been identified as major threats to the species. During the construction of the Katse Dam (Malibamatso catchment and adjacent areas of Lesotho) three Black Stork sites, identified during the pre- and post-inundation survey and monitoring, were submerged. The dam also removed the typical Black Stork riverine foraging habitat in the area, and the birds did not return despite other likely suitable cliffs being available at the site. Biodiversity offsets (protecting areas of high conservation value) will be required if dam and infrastructure developments, such as those associated with the continued roll out of the Lesotho Highlands Water Project, continue to threaten breeding habitat. BirdLife South Africa submitted a Habitat Suitability Model for this species to the Department of Forestry, Fisheries and the Environment’s National Web-based Environmental Screening Tool. The function of this tool is to flag developments whose footprint overlaps with the breeding distribution of this species, thereby triggering specific monitoring requirements during the environmental impact assessment process.
We strongly encourage the use of mitigation measures such as the marking of powerline infrastructure with bird-scaring devices and using site-screening tools to minimise the impacts of planned developments. Conservation management plans should focus on river quality as far as 20 km away from nesting sites, protecting and managing feeding habitats, and improving food resources by establishing shallow artificial pools in grasslands or along rivers (Jiguet and Villarubias Reference Jiguet and Villarubias2004).
Current risk of regional extinction by IUCN criteria
Black Stork is a species “on the edge” with regards to classification using criteria A, with outcomes sensitive to small changes in starting values and model type (exponential or linear) (Figure 9).

Figure 9. Population change assessment using the International Union for the Conservation of Nature (IUCN) category A2 based on a variety of starting and end populations and the exponential change model. The dark grey point represents our current best estimate of the initial and current populations centred on 950 and 600 individuals, with the larger light-grey circle representing a confidence interval of radius 200.
Ultimately, the IUCN categories and criteria model (Figure 9) and reporting rate and range changes between SABAP1 and SABAP2 point to a potential population size reduction of >50% between the late 1980s and present (c.40 years, approximately three generations) as reflected in range change as well as relative abundance, and thus qualifies as “Endangered” by criteria A2b (i.e. population reduction observed, estimated, inferred, or suspected in the past where the causes of reduction may not have ceased OR may not be understood OR may not be reversible; based on an index of abundance appropriate to the taxon). In addition, the small population (<1000), combined with ongoing projected declines make the species “Vulnerable” by criteria C1, if projected declines are at 10% within two generations (32 years); “Endangered”, if projected to be 20% (unlikely according to SABAP2 data). This population of Black Stork currently occupies an EOO and Area of Occupancy (AOO) of greater than 20,000 km2, and 2,000 km2, respectively, and as such meets no thresholds under criteria B (geographical range). The population is not severely fragmented, and it is not experiencing extreme fluctuations in its EOO, AOO, or in the number of locations or the number of mature individuals in the population. Information to inform criteria E is lacking, specifically information on adult and juvenile survival, maximum age of reproduction, and most other metrics. We cannot be sure whether adjacent populations (Zimbabwe, Namibia) are a source or sink for the regional domain considered here, but we suspect strongly they are unlikely to represent a significant rescue effect.
Taken together, despite low confidence in the population decline between atlas periods, but with evidence of a lack of breeding that is likely tied to rainfall, the species should be regionally classified as “Endangered” given likely ongoing low recruitment, impacts of anthropogenic disturbance, and likely impacts of climate change. Surveys across the range of the southern African population that better quantify the population size are required, and the need for further nest site monitoring is clear. Further climate change modelling would also be insightful. Citizen scientists are encouraged to record details of individuals encountered, including group sizes and if any immature birds are present. Non-adult birds are recognised by their non-uniform black plumage and duller bills. Protection, including limiting human disturbance, is required at breeding sites, as well as along key foraging rivers, where water quality and food resources require monitoring.
Supplementary materials
The supplementary material for this article can be found at http://doi.org/10.1017/S0959270923000059.
Acknowledgements
We would like to thank Niall Perrins for funding that made the initial breeding surveys of historical sites in northern South Africa possible. We thank the following people for assistance with surveys, planning, and comments on this manuscript: Fanie du Plessis (BirdLife South Africa), Michele Tarboton, Peter Mundy, Lance Robinson, Sharon Thompson (SANParks), Herman Ntimane (SANParks), Anthony van Zyl, Sandra Visagie (SANParks), Dalton Mabaso (SANParks), Kyle Walker, Andrew D. de Blocq (BirdLife South Africa), Caroline Howes, Craig Whittington-Jones (Gauteng Department of Agriculture and Rural Development), Simeon Bezeng (BirdLife South Africa), and Kerri Wolter (Vulpro). Thanks to all the users of BirdLasser and contributors to SABAP2: this paper would not have been possible without you (even those that didn’t see a Black Stork). We also need to thank the Ingula Partnership (Eskom) as a funder of this project and SANParks for logistical support and permits.


 Open access