


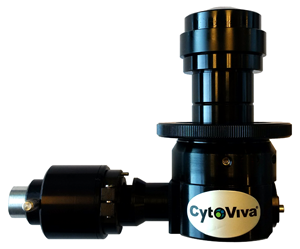
Introduction to the Enhanced Darkfield Illuminator
The continued emergence of nanotechnology as a preeminent field of research and development has necessitated the creation of new and improved tools and equipment to aid in this effort. In support of these evolving needs, capabilities of many of the existing tools that have proven useful for determining size (for example, dynamic light scattering, nanoparticle tracking), morphology (scanning electron microscopy), location in biological matrices (confocal microscopy), and quantitative identification of sample composition (Raman microscopy), have continued to be refined, and new features have been introduced. However, none of these techniques allow the researcher to quickly and easily image their target nanostructures in their native state, free of complicated sample preparation. The introduction of the CytoViva, Inc. Enhanced Darkfield (EDF) Illuminator (Figure 1a) in 2005 was aimed at addressing some of these unmet needs.
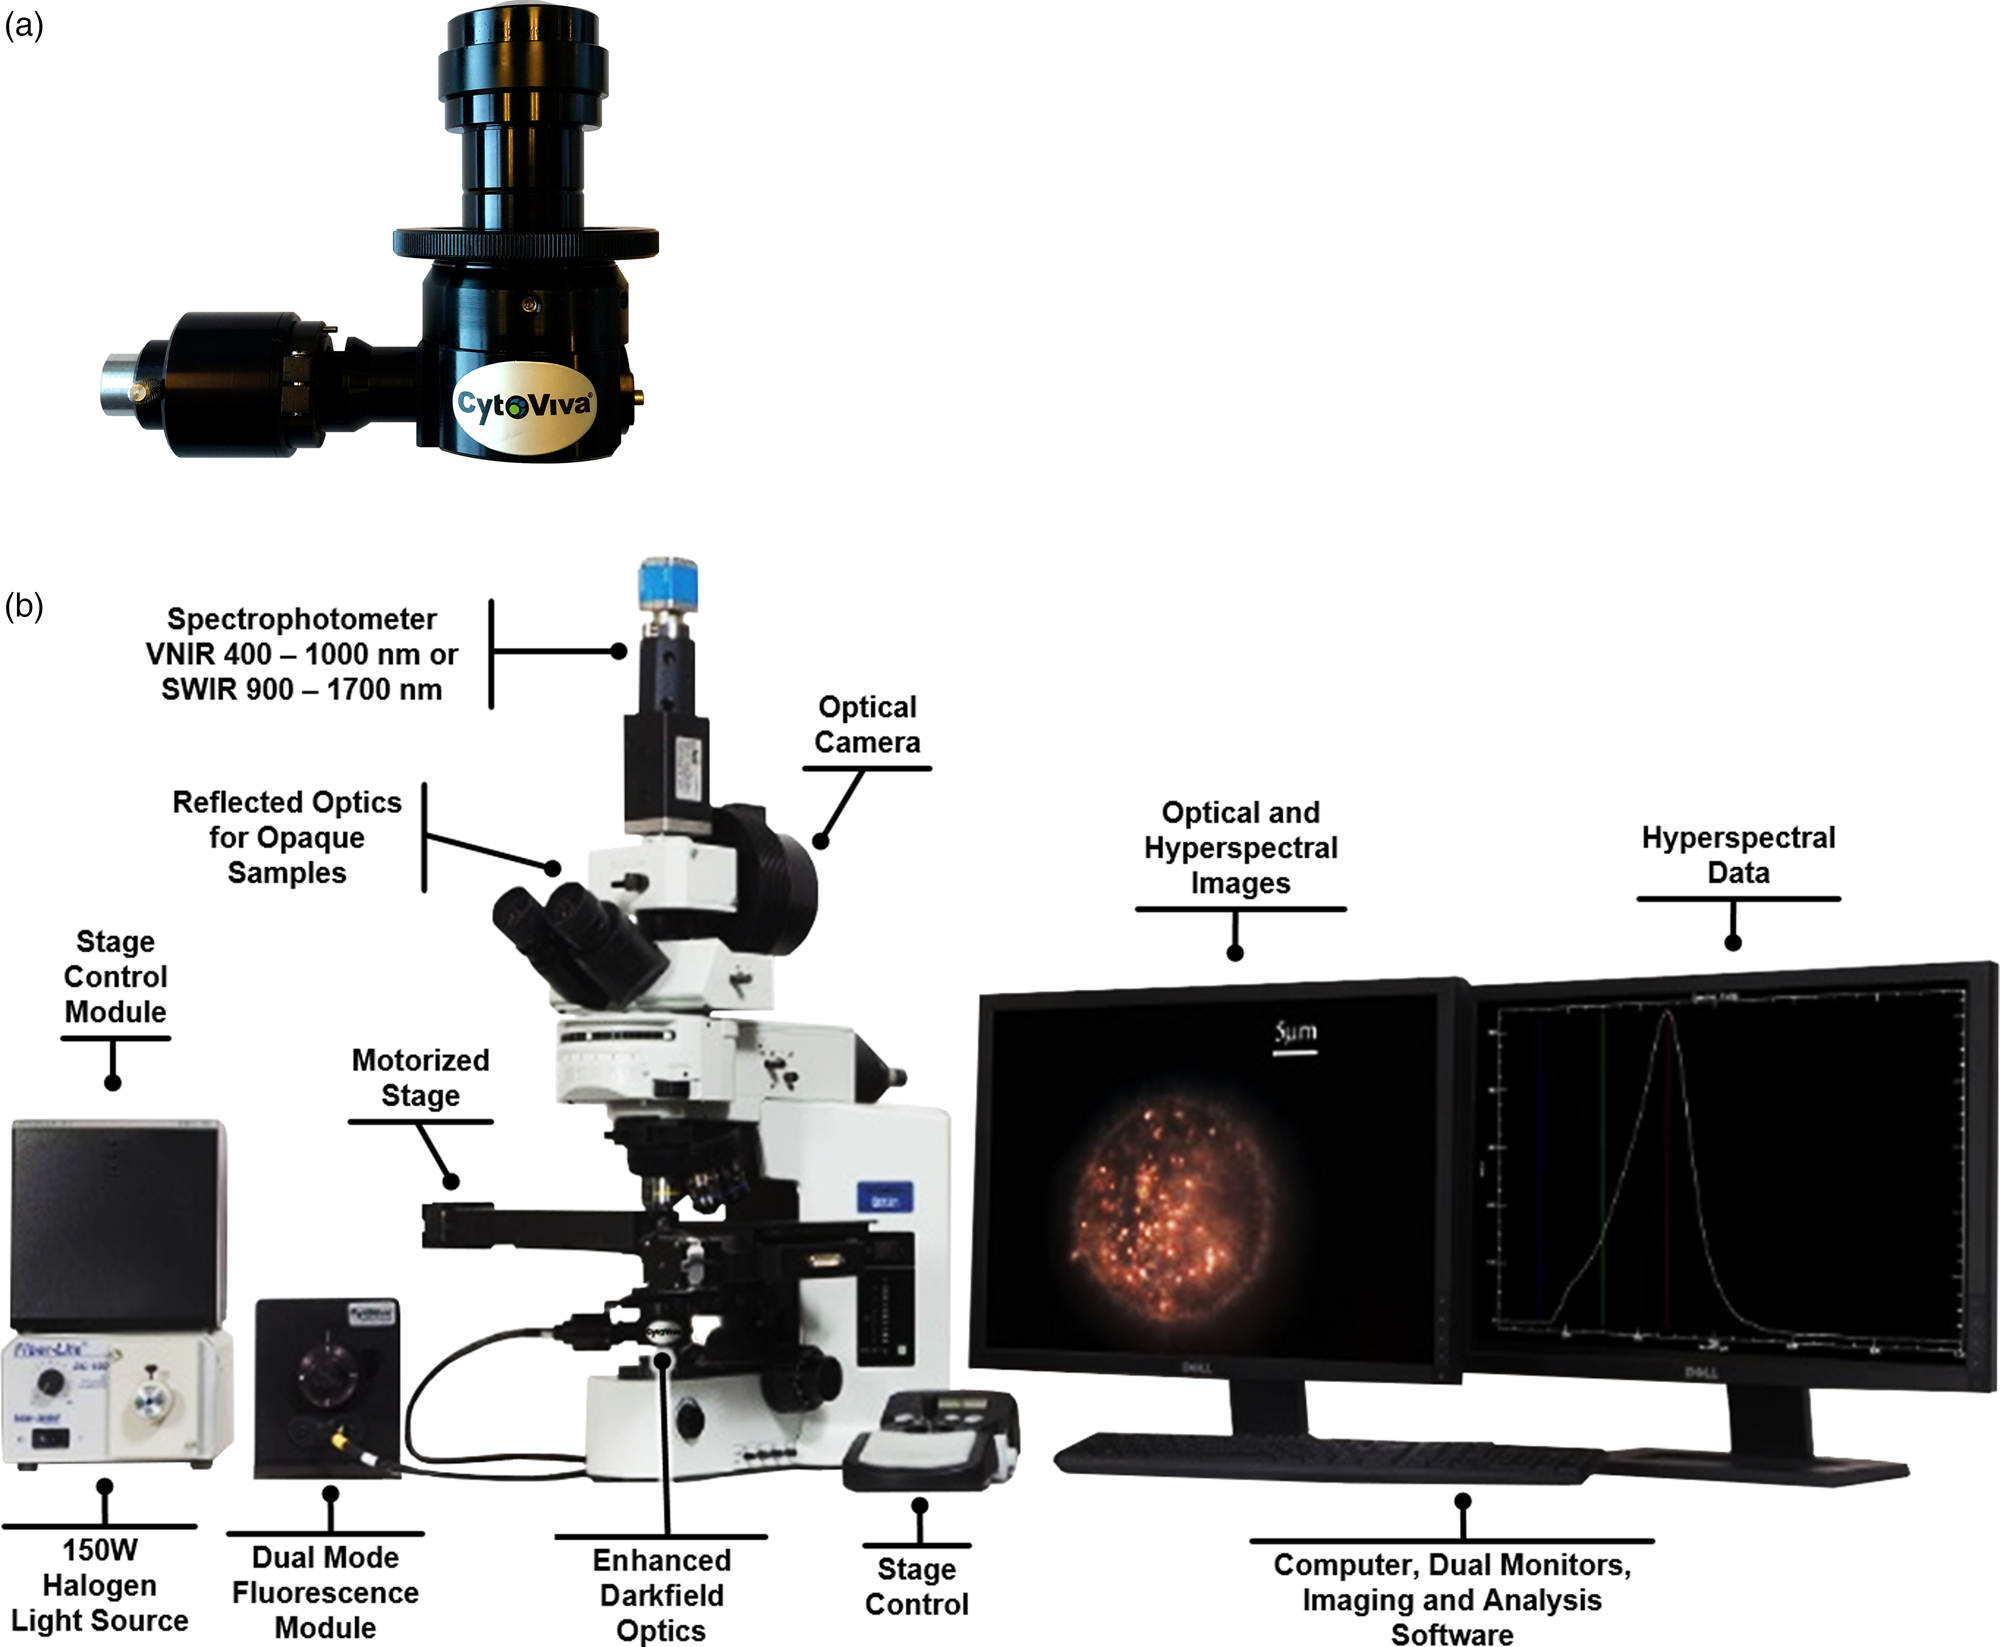
Figure 1: (a) CytoViva EDF Illuminator. (b) EDF Illuminator installed in the condenser mount of the CytoViva Hyperspectral Microscope System.
Darkfield illumination has long been known as a useful tool in optical imaging of biological samples since it does not require labeling. It leverages the advantages inherent in high numerical aperture, oblique angle illumination to produce images based on reflection, refraction, and scatter. The limitations with standard darkfield illumination arose from two issues. The first is the difficulty in properly focusing the light emitted from the condenser onto the desired image plane of the sample. The second is the loss of light inherent in the construction of the light path (that is, loss through various diffusion lenses in the base of the microscope as well as through the air gap between the field diaphragm and the entrance to the condenser). The EDF illumination technique addresses these issues through bypassing the normal light path. Instead, it is an enclosed system that directs the source illumination directly into the condenser, fixing the geometry of the light path from the light source to the entrance slit of the condenser. This makes focusing the condenser onto the desired imaging plane of the sample much easier and more consistent. The EDF design also collimates the light entering the condenser, thereby reducing stray light and background noise. The result is an optimized darkfield image with a superior signal-to-noise performance when compared to standard, commercially available darkfield condensers. The design also allows the EDF Illuminator to be compatible with a wide variety of upright and inverted microscopes from most major original equipment manufacturers (OEMs) (Figure 1b).
This improved performance has opened up new possibilities, allowing researchers to optically image nano-constructs in a variety of translucent sample matrices with a clarity and fidelity previously unavailable. This includes plasmonic particles (Au, Ag, Pt) down to 10–20 nm; metal oxides (TiO2, Fe2O3, ZnO2) down to 20–40 nm; polymeric particles down to 40–60 nm; and lipids down to 80–100 nm. Other nano-scale constructs such as multi-walled carbon nanotubes (MWCNTs) are also easily imaged with this technique. No labeling or other special sample preparation is required prior to imaging. Further, the technique is very easy to master, as new users can be taught to obtain high-quality images in less than one hour, even without prior experience in microscopy.
Key Design Elements and Performance Attributes
The patented EDF Illuminator (US patent numbers Nos. 7,542,203 (2009), 7,564,623 (2009)) owes its improved performance to three factors. The first of these is the disconnection of the illuminator from the standard light path through the base of the microscope, instead passing the light directly from the source into the illuminator via a liquid light guide (Figure 2). This configuration allows for relatively little light loss from the bulb to the annulus of the condenser. The second factor is the internal design of the illuminator. Once light enters the barrel of the illuminator, it is collimated and then reflected off a first surface mirror, which is aligned such that it projects the resulting beam of light directly onto the annulus of the condenser. Light then passes through a high N.A. (1.2–1.4) cardioid oil condenser and is directed onto the sample after passing through a thin layer of imaging oil and (typically) a 1 mm glass slide. The cardioid condenser has a total working distance of 1.5 mm. Thus, with a typical upright microscope imaging configuration, there is a 0.5 mm working distance available after accounting for the 1 mm slide. This fixed optical train from the light source to the sample creates pre-aligned Köhler illumination. This in turn facilitates the third major factor contributing to improved performance: allowing the focal point of the condenser to be aligned precisely with the desired image plane, which in turn is precisely aligned with the focal point of the objective being used. A variety of objectives can be used with the EDF Illuminator, but in order to capture optimal performance, it is best to use a high-quality (Plan Apochromat) oil objective with an adjustable iris. The illuminator is also compatible with a variety of light sources with outputs ranging from 400 nm – 2200 nm, including those optimized for fluorescence imaging. Regardless of the light source used, the EDF Illuminator's design results in maximum photon energy being compacted into a 400 µm diameter field of view. This concentration of precisely focused energy is what allows the creation of extremely high signal-to-noise images from reflection, refraction, and scatter off of the targeted area of the sample.

Figure 2: Optical train for the CytoViva EDF Illuminator.
All of these factors together combine to produce an optical imaging system which, as Zhang and colleagues [Reference Zhang1] demonstrated (Figure 3), produces a signal-to-noise improvement of up to 10× when compared to standard, commercially available darkfield condensers. While this is key to enabling enhanced nano-scale optical imaging, it also is critical to the ability to analyze these images when combined with other advanced techniques such as hyperspectral imaging, which will be discussed later in this article.

Figure 3: Comparison of signal-to-noise (S/N) ratio in conventional DF detection images (a–c) and EDF illumination images (d–f) of 160 nm native single superparamagnetic nanoparticles (SPMNPs) on coverslips. (a,d) SPMNP NH2; (b,e) SPMNP OH; (c,f) SPMNP COOH. Conditions: In the samples, SPMNPs were diluted 1/1000 in 100 mM sodium phosphate buffer (pH 8.3); images (a–c) collected with an Olympus BX-51 microscope with an Olympus conventional DF condenser (U-PCD2), and (d–f) were collected with a CytoViva EDF Illuminator; objective lens, LCPlanFl 60×/0.70 Iris; QuantEM 512SC; exposure time 10 ms, RSI = relative scattering intensity of the area within the dotted lines.
Applications Enabled with Use of the EDF Illuminator
The enhanced optical properties of the EDF Illuminator have enabled this technique to be used across a large variety of nano-related applications, ranging from alternative energy to cosmetics. However, in the interest of brevity, the discussion herein is limited to three applications that are the most common: nanomaterials development, nanotoxicology, and nano drug delivery. While all three applications have their own unique requirements, they all share the need to optically observe the forming, functionalization, and location of nano-constructs as they are placed in a variety of both biological and non-biological matrices. This ability to visualize the nano-construct in its native environment, free from labels or other markers, is critical to understanding and predicting how these constructs will behave in more complex, non-laboratory environments.
Nanomaterials development
The range of materials and applications being developed under the umbrella of engineered nanomaterials (ENMs) is almost limitless, ranging from carbon nanotubes to polymeric shells used in drug delivery to organic particles used in alternative energy development. The study of nanomaterials typically begins with validating the output of the chemistry designed to create the particles. The ability to see these particles optically, along with the other typical measurements (sizing, measuring zeta potential, etc.), is key to establishing that the desired results are actually achieved. Of course, the creation of the ENMs is only the first step, as introducing them into a functional role is most often the ultimate goal. The EDF illumination technique has been used extensively across all aspects of the ENM life cycle, including projects such as development of designed silver nanoparticles (AgNPs) for use in water purification [Reference Sankar2], building microcrystal-loaded poly(lactic-co-glycolic acid) (PLGA) microspheres specifically for use in extended drug retention in joints [Reference Ho3], and the design of organic photovoltaics. In the last example, Torreggiani and colleagues [Reference Torreggiani4] demonstrate the efficacy of a bi-continuous composite of electron donor and electron acceptor materials in boosting power conversion efficiency. As illustrated in Figure 4, the EDF Illuminator produces images with superior clarity and detail when compared to other techniques such as atomic force microscopy (AFM) and traditional brightfield microscopy. This capability, when coupled with hyperspectral image analysis, allows researchers to study the morphology and location of organic polymers on a variety of spin coat-treated substrates.

Figure 4: Comparison of images taken for poly (3-hexyl thiophene) phenyl-C61-butyric acid methyl ester (P3HT: PCBM blends (1:1 weight ratio, deposited onto glass substrate) by EDF microscopy, AFM, and standard light microscopy. a), d), and g): EDF images. b), e), and h): AFM images (topography). c), f), and i): images taken with a standard light microscope. a), b), and c): as-cast blends. d), e), and f): thermal annealed blends at 150°C for 30 min. g), h), and i): thermal annealed blends at 150°C for 2 hours. All images are 60 µm × 60 µm.
Nanotoxicology
The field of nanotoxicology has grown along with the introduction of ENMs in large-scale industrial and consumer product applications. Researchers have been working to develop means to model exposure and toxicity in vitro to determine potential implications to human health. The ability to optically image these ENMs interacting within functioning biological samples is key to determining potential toxicity issues, both in terms of causality and potential mitigation.
One example of published nanotoxicology research conducted with the EDF Illuminator comes from the lab of Dr. Sara Brenner at SUNY Albany [Reference Pena5]. Dr. Brenner's team used the EDF imaging capabilities, along with hyperspectral image analysis, to study the potential health impacts of exposure to CeO2 (ceria) and Al2O3 (alumina) on workers in the silicon wafer manufacturing industry. For this study, Dr. Brenner's team used porcine skin tissue, which serves as a toxicological model for cutaneous exposure to ENMs in industrial settings. Porcine skin samples were obtained from euthanized adult male pigs and exposed to both ceria and alumina solutions (Figure 5). Although Dr. Brenner's team went on to perform further analysis of these samples, the EDF imaging capability was the critical step in enabling further detailed analysis.

Figure 5: Positive control porcine skin tissue viewed by brightfield microscopy, EDF microscopy, and hyperspectral imaging (HSI) with mapping. Rows correspond to the stratum corneum of porcine skin tissue injected with ceria and alumina nanoparticles. Each column shows the same field of view imaged with different techniques. The first column corresponds to the brightfield view of H&E stained stratum corneum (40× magnification). The area enclosed in the red square is magnified to 100× and viewed using EDF microscopy (column 2) and HSI (column 3), where ENMs appear as high-contrast elements, indicated by arrows. Column 4 shows the HSI image mapped against the Reference Spectral Library, where the ENMs with positive matching are shown in yellow for ceria (arrows) and in magenta for alumina (arrows).
Nano drug delivery
The field of nano drug delivery is also growing rapidly as researchers continue to refine the use of NPs as drug delivery vectors. Similar to applications in nanotoxicology, the EDF illumination technique offers researchers the ability to optically observe functionalized NPs during in vitro studies as they interact with cells and tissue. This can be done with a variety of sample preparation techniques including cells fixed on a slide or coverslip; cryo-sliced, fixed tissue samples; or use of environmental chambers specifically designed for the EDF imaging modality. Furthermore, EDF illumination is also very useful in determining the efficacy of the functionalization process upstream of in vitro experiments. When combined with hyperspectral imaging and analysis, the user can easily determine the integrity of the functionalization process and monitor shedding of conjugates and drug loads. Finally, the EDF illumination technique can also be used in combination with propriety deconvolution routines and a Z-direction piezo stage to locate target NPs in the context of a 3D re-creation of targeted regions of the sample (CytoViva 3D Enhanced Darkfield Microscope). The combination of these techniques provides a unique suite of capabilities in the pursuit of novel drug development, allowing the user to optically observe loaded NP interaction with a targeted sample area to spectrally validate the integrity of the functionalization process both inside and outside of the cell or tissue, as well as locate the NPs in a 3D representation of the sample.
Dr. Devika Chithrani, University of Victoria, BC, used these capabilities in her work to improve the efficacy of bleomycin (BLM) by developing methods for delivering the BLM directly to the cell nucleus via a loaded gold nanoparticle (GNP) [Reference Yang6]. As seen in Figure 6, Dr. Chithrani used the imaging capabilities of the EDF illumination technique in combination with hyperspectral imaging to validate the loading of the GNPs and to locate them in the cell cytoplasm. She then used the 3D imaging capabilities to observe locations where the GNPs had penetrated the nucleus and caused breaking of the DNA double strand, which is the desired positive therapeutic result.

Figure 6: Imaging of GNPs using HSI: (A) Dark-field image of GNPs; (B) reflectance spectra of a few GNPs shown in (A); (C) darkfield image of an unstained cell with internalized GNP clusters (bright white spots pseudo-colored red); and (D) reflectance spectra of a few GNP clusters localized within the cell shown in (C). (E–H) Hyperspectral image of a stained nucleus and DNA double strand breaks (DSBs) in a cell. Three different channels were used to display the nucleus, GNPs, and DNA DSBs. Blue areas show the nucleus of the cell (E); green dots represent DNA DSBs (F); and red dots represent GNP clusters localized within cells (G); (H) A merged image of the three channels corresponding to the nucleus, GNPs, and DNA DSBs.
This example from Dr. Chithrani offers one of the most comprehensive examples of leveraging the full suite of capabilities offered by the improved optical performance of the EDF Illuminator. These capabilities offer users working on drug development, targeted delivery, and regulatory approval a tool that promises to dramatically accelerate their work and offer insights unavailable with any other commercially available analytical technique.
Imaging Modalities Enabled and Enhanced by Use of the EDF Illuminator
The optical performance of the EDF illumination technique provides a platform technology onto which multiple advanced imaging and quantitative image analysis capabilities can be introduced. These include a Dual Mode Fluorescence module for enabling darkfield-based fluorescence, hyperspectral imaging (HSI), 3D optical imaging, and Raman spectroscopy. All of these techniques are supported and enhanced by the improved signal-to-noise images produced by the EDF Illuminator.
Dual mode fluorescence
Creation of fluorescence images is enabled beginning with the use of a filter wheel containing the desired excitation filters, which are selectively placed in the light path between the exit of the light source and the entrance to the EDF Illuminator. A triple-pass emission filter is also placed in the turret of the microscope. The user can then modulate between pure fluorescence images and full broadband white light images, all without requiring typical image overlays. This is accomplished by simply rotating the filter wheel, thereby partially moving the excitation filter in and out of the light path until the desired combination of fluorescence excitation and white light is achieved.
Environmental chambers
For researchers interested in live cell imaging, CytoViva has partnered with two manufacturers of closed-system environmental chambers that have been tailored specifically to be compatible with the EDF illumination system. Warner Instruments can provide a traditional environmental chamber that is capable of controlling temperature and media flow. SynVivo, Inc. can provide a 3D-printed plastic microfluidic chamber, which can be designed to replicate specific in vivo flow models.
Hyperspectral imaging
The reliability of HSI microscopy data is highly dependent on the quality of signal received by the detector after passing through microscope objectives and the internal optics of the spectrograph deployed. Thus, the high-fidelity signal-to-noise capabilities of the EDF Illuminator are critical to the effective use of HSI analysis in biological and other translucent samples. CytoViva has developed a fully integrated hyperspectral microscopy system (CytoViva Hyperspectral Microscope) for use with the EDF Illuminator, which includes an automated X/Y translational stage, diffraction grating spectrograph coupled with detector, and customized analytical software that allows detailed mapping at the pixel level. Options for both visible near infra-red (VNIR) (400–1000 nm) and short wave infra-red (SWIR) (900–1700 nm) are available. The combination of the imaging capabilities of the EDF illumination technique with the analytical and mapping capabilities of HSI provide a powerful tool for use in the full range of nanotechnology-related fields.
3D optical imaging
As mentioned previously, the EDF Illuminator can be combined with a Z-direction piezo stage to acquire a series of 2D images, which can then be deconvolved with proprietary software and combined into a 3D representation of the sample imaged. This patented (US Patent No. 10,152,823 (2018)) capability was designed specifically for use with samples where determining the location of NPs or other targeted entities in context of a 3D space (for example, NPs in cells or tissue) was required.
Raman microscopy
The imaging and analysis capabilities of the EDF Illuminator optics coupled with HSI and/or 3D often require quantitative validation to achieve publishable results. Raman microscopy is often used in this role, so CytoViva has partnered with HORIBA Scientific to combine the EDF Illuminator/CytoViva HSI capabilities onto the HORIBA XploRA Plus© platform (Figure 7). This allows researchers to accomplish all of these tasks on one platform without having to move the sample between instruments and attempting to relocate the desired field-of-view (Figure 8).

Figure 7: CytoViva EDF Hyperspectral Microscope co-installed with the HORIBA XploRA Plus© Raman Microscope.

Figure 8: Sample data acquired using the combined CytoViva and XploRA system demonstrating (clockwise from upper left) imaging, differentiating, quantitatively identifying, and mapping MWCNTs in lung tissue.
Summary
The CytoViva EDF Illuminator represents a simple yet significant advancement in the field of optical microscopy. By virtue of its highly efficient treatment of light, the EDF illumination technique opens up new optical imaging possibilities and offers enhanced utility to existing imaging modalities. Coupled with its ease of use, compatibility with multiple OEM microscope frames, and relatively low cost, this technique has opened up an endless set of possibilities for extending the use of darkfield microscopy across multiple nanotechnology-related fields of research.


