


Policy Significance Statement
Understanding the value of satellite data is important in order to guide decisions regarding government investment in satellite system design and development as well as government purchases of commercial satellite data. Awareness of the value of satellite applications can also help to promote further use of this resource to address a broad array of issues.
1. Introduction
In the 1980s, polio crippled an estimated 350,000 children per year and was rampant in 125 countries. Since the World Health Assembly called for eradication of the disease in 1988, more than 10 million people have been spared the lifelong disability attributed to polio, largely achieved through vaccination campaigns (Tebbens et al., Reference Tebbens, Pallansch, Cochi, Wassilak, Linkins, Sutter, Aylward and Thompson2010). When a sufficient percentage of the population receives the oral polio vaccine (OPV), transmission of polio is halted, and with persistent effort, the disease can be eradicated.
The most recent country to successfully interrupt transmission of the disease was Nigeria, which was declared polio-free in August 2020 (World Health Organization Nigeria, 2020). This was an impressive achievement, given that just 8 years earlier, Nigeria had accounted for more than half of all wild polioFootnote 1 cases worldwide and was one of only three nations in the world—along with Pakistan and Afghanistan—where polio remained endemic (Guglielmi, Reference Guglielmi2020). Nigeria had been carrying out polio vaccine campaigns for decades, but the country reached a turning point due to a number of important interventions after 2012. One element of these interventions—and a key ingredient in achieving this historic feat – relied on satellite data (Center for International Earth Science Information Network [CEISIN], 2020).
Interrupting transmission of disease requires vaccination of a sufficient proportion of the population, and to ensure this, those planning vaccination campaigns must have an accurate understanding of the size and location of the population. In the case of Polio, campaigns focus specifically on vaccinating children under 5 years old. However, in many places where these campaigns occur, detailed maps do not exist, official censuses are infrequently conducted, and the population is changing dynamically, with rapid urbanization and the rise of new settlements. Due to these trends, the traditional methods of planning vaccine campaigns and estimating populations result in inaccuracies, with whole settlements missed and misestimates of the resources needed to effectively eradicate the disease. Under these circumstances, an insufficient number of children receive vaccinations in the targeted area and disease transmission continues.
In the case of Nigeria, researchers were able to use satellite data to develop more accurate maps and population estimates. These resources proved essential to the polio eradication efforts in the country. In this article, we review these efforts and provide an estimate of the socioeconomic benefits associated with the use of satellite data for this purpose.
We first discuss the importance of carrying out this type of socioeconomic valuation, particularly with regard to Earth observing satellites, and review approaches to doing so. We then move into the details of our case, summarizing the history of polio eradication efforts in Nigeria and discussing how satellite data were used to inform and support these efforts. We provide information and background on the data used to carry out our analysis, including a discussion of definitions, sources, and the assumptions made, and we explain the methodology used to place a quantitative value on these efforts. We then present the analysis and the estimated benefits. The article ends with a discussion of the limitations of this approach, as well as the qualitative benefits associated with these efforts and the potential for future work in this area.
2. Estimating the Value of Satellite Data
Accurately quantifying socioeconomic benefits associated with the use of satellite data is important. Earth observing satellites are often developed by governments and paid for by taxpayers, and an individual Earth observation satellite typically costs tens or even hundreds of millions of dollars to build and operate (Abrams et al., Reference Abrams, Asrar, Marzano, Minnett, Salomonson, Singhroy and Joseph Turk2014). Ensuring that the resulting data provides benefits that outweigh these costs is essential to making efficient investments in Earth observation technology now and in the future. Understanding and quantifying the value of satellite data is necessary for good decision-making.
This remains important even with regard to commercial satellite remote sensing data—which were the type of data used to support polio eradication efforts in Nigeria. Well-established satellite remote sensing companies, such as Maxar, rely on governments for the majority of their revenue. We are currently seeing a wave of new commercial remote-sensing companies aiming to bring new types of satellite data to the market, and it is likely that new companies will also see governments as essential customers (Erwin, Reference Erwin2021). As the government makes decisions regarding whether to purchase these data, how much to purchase, and at what price, it must have a good understanding of the types and total value of benefits that are likely to result from the use of the data.
While there is general agreement that satellite data are valuable, placing a quantitative value on the data are challenging for a number of reasons. First, satellite data, like data in general, are non-rival. When one person uses the data, it does not reduce the amount available for others. Ideally, we would like to understand all of the potential uses of a particular satellite data set to determine its total socioeconomic benefit. However, experience has shown that often the full set of uses of the data cannot be determined in advance. Government agencies have found that a large portion of new applications and scientific publications rely on older satellite data made available through their archives (Wulder et al., Reference Wulder, Masek, Cohen, Loveland and Woodcock2012).
In addition, while satellite data are frequently used by private companies that generate revenue from its use, it is perhaps most often used by scientists, government agencies, and non-profit organizations to generate new scientific knowledge or to develop new applications. For example, satellite data are used by the U.S. Department of Agriculture to predict global agricultural production, by the U.S. Forest Service to track wildfires, and by non-profit organizations to monitor illegal forestry and detect potential human rights abuses (Kansakar and Hossain, Reference Kansakar and Hossain2016). These types of applications are clearly valuable, but placing a dollar value on these efforts is difficult because they do not result in revenue or other easily quantifiable benefits.
One approach to improve our understanding of the value of satellite data is to undertake rigorous assessments of specific uses of satellite data to determine a dollar value associated with particular applications. By building a library of these examples, it is possible to get a more concrete understanding of the scope of the socioeconomic value of satellite data. NASA, in partnership with the non-profit organization Resources for the Future, created the Consortium for the Valuation of Applications Benefits Linked to Earth Science (VALUABLES) to fund projects that estimate the value of satellite data in a variety of areas.Footnote 2 VALUABLES projects, including this one, take a value of information (VOI) approach, focusing on the role of satellite data in a decision-making context. They examine how satellite data enabled an improvement in decision-making and determine the economic value of that improvement (Resources for the Future, 2021).
To do this, projects typically examine a counterfactual, comparing the outcome that would result if action was taken based on information based on satellite data to the outcome that would result if action was taken based on information not informed by satellite data. The difference in the net socioeconomic benefits between these two outcomes represents the value of the satellite data (Resources for the Future, 2021). This project uses this methodology to examine the use of satellite data to help plan polio vaccination campaigns in Nigeria.
It is worth noting that this approach is also not without challenges. In particular, it can be very challenging to develop a credible understanding of what the outcomes may have been without information informed by satellite data. There is uncertainty regarding the specifics of the alternative information as well as the decisions that would have been made based on that data. In addition, we only have a limited ability to identify and control for other factors that have also changed, in addition to the satellite-based information, such as project organization, management decisions, human experience, and broader societal and political context. Later sections address our approaches to addressing these issues, as well as areas of residual uncertainty.
3. Polio Eradication in Nigeria and the Role of Satellite Data
In 1977, the World Health Organization created the Expanded Program on Immunization with the goal of worldwide eradication of six illnesses, including poliomyelitis, the viral disease which causes polio (World Health Organization, 2023a). The program was introduced in Nigeria in coordination with the national government. Unfortunately, political and economic instability limited the initial progress of this effort, and less than 10% of the population was immunized in the first 5 years of the program (Renne, Reference Renne2006).
The program was reinvigorated in 1988 with the creation of the Global Polio Eradication Initiative (GPEI), a public–private partnership with five partners: The World Health Organization, Rotary International, the U.S. Centers for Disease Control and Prevention, the United Nations Children’s Fund, and the Bill & Melinda Gate’s Foundation (Partners, 2022). Still, Nigeria had mixed success in its efforts, with decreases in Polio cases in the 1990s followed by growth in the 2000s, with a peak of 1,144 cases in 2006 (Renne, Reference Renne2006; World Health Organization, 2023b). The high level of cases in Nigeria also affected the rest of the world. Between 2003 and 2013, more than 26 previously polio-free countries experienced polio outbreaks that were traced back to Nigeria (Etsano et al., Reference Etsano, Gunnala, Shuaib, Damisa, Mkanda, Ticha, Banda, Korir, Chevez, Enemaku, Corkum, Davis, Nganda, Burns, Wassilak and Vertefeuille2015). With renewed efforts, Nigeria was able to bring the number of WPV cases down to 56 by 2010 (World Health Organization, 2023b).
3.1. Introduction of satellite-based products and applications to polio vaccination campaign planning
Cases began to increase once again in 2011, and a number of factors were identified that were hindering progress, including security issues and lack of strong government support (Nasir et al., Reference Nasir, Bandyopadhyay, Montagnani, Akite, Mungu, Uche and Ismaila2016). In addition to these challenges, there was a recognition that more fundamental challenges—including inaccurate maps and lack of tracking and accountability—were also contributing to these difficulties and resulting in children being chronically missed by vaccinators. In December 2011, the National Primary Health Care Development Agency of Nigeria, along with GPEI partners and the Bill and Melinda Gates Foundation, funded a project to use satellite data to create new maps for eight Nigerian states. Key aspects of the project are summarized here, and a full technical description can be found in Barau et al. (Reference Barau, Zubairu, Mwanza and Seaman2014).
Prior to this project, the vaccination teams had relied primarily on hand-drawn maps. This was necessary because official maps did not typically include boundaries for wards, the administrative level at which polio vaccination planning occurs. Unfortunately, these hand-drawn maps were often inaccurate and incomplete. They may be missing hamlets or the homes of nomadic individuals or have existing settlements placed inaccurately relative to each other. These missing settlements are particularly problematic, because the method used to validate the level of coverage achieved—lot-quality assurance sampling methodology (LQAS)—relied on the same maps as those used by vaccination teams. This means settlements missed in the initial campaign would also be missed when conducting post-campaign evaluations (Barau et al., Reference Barau, Zubairu, Mwanza and Seaman2014). Due to this situation, the vaccination coverage levels determined through this method would represent only vaccination coverage for the known population depicted on the hand-drawn maps and visited by vaccinators, and not the true vaccination coverage for the total population.
New geospatial information system (GIS) maps were developed using recent high-resolution satellite imagery collected by DigitalGlobe (now Maxar). Researchers used manual feature extraction—clear, pre-determined definitions of various types of settlements—to identify hamlets, small settlements, and built-up areas. Field teams using GPS-enabled phones added the settlement names and locations. The draft maps were then reviewed by ward leaders before being finalized. This resulted in more accurate, standardized, and geo-referenced maps. Initial use of the maps began in limited areas in mid-2012, and by December 2013, the GIS maps were distributed for use in all eight states, increasing efficiency and adding more than 3,000 previously unmapped settlements (Barau et al., Reference Barau, Zubairu, Mwanza and Seaman2014).
In addition to identifying previously missing settlements, the satellite-based GIS maps allowed for GPS tracking of the vaccination teams during the campaigns themselves. Each team carried a smartphone that recorded a GPS location with a date and time stamp every 2 min. At the end of each day, the resulting track was uploaded to a central computer and reviewed to determine whether the teams had successfully visited all assigned settlements. Any missed settlements were added to a list to be visited on a “mop up” day at the end of the four-day vaccination campaign. Visits on that day were also tracked, and additional mop-ups were added, if necessary (Barau et al., Reference Barau, Zubairu, Mwanza and Seaman2014). In 2011, before the first satellite-based maps were created, the vaccination coverage rate in Kano state, as determined by LQAS, was typically 60% or lower. Given that a vaccination coverage rate of 80% is needed to halt transmission, this is a significant concern.Footnote 3 In 2013, after the use of satellite maps and GPS tracking had been fully implemented, the average vaccination coverage rate in Kano measured through the LQAS process was about 83%, on average, and by 2014 it rose to 89% (Wannemueler, Reference Wannemueler2012).
A second satellite data-enabled project ran in parallel with these efforts. In addition to requiring knowledge of exactly where populations are located, officials planning vaccination campaigns must have an accurate estimate of the total population. This is necessary for ensuring adequate supplies, personnel, and time. When the goal is eradication, as is the case with the polio campaigns, accurate assessment of the total population is also essential for determining whether the percentage of the population that has been vaccinated is sufficient to provide herd immunity (Weber et al., Reference Weber, Seaman, Stewart, Bird, Tatem, McKee, Bhaduri, Moehl and Reith2018).
One traditional source for these estimates is data collected in the national census. In the case of Nigeria, the most recent national census data comes from 2006. Estimates of population since 2006 typically rely on the application of constant growth rates that do not take into account differential changes in different geographic areas (Weber et al., Reference Weber, Seaman, Stewart, Bird, Tatem, McKee, Bhaduri, Moehl and Reith2018).
As an alternative, researchers developed a novel census-independent method of estimating population using semi-automated analysis of satellite data. The full technical methodology is described by Weber et al. (Reference Weber, Seaman, Stewart, Bird, Tatem, McKee, Bhaduri, Moehl and Reith2018). The project used recent high-resolution satellite imagery of two Nigerian states—Kano and Kaduna—procured from DigitalGlobe (now Maxar) and Airbus. Analysts reviewed the imagery to identify settlements and classify settlement types. They trained a machine-learning model to analyze the imagery and validated the results with fieldwork (Weber et al., Reference Weber, Seaman, Stewart, Bird, Tatem, McKee, Bhaduri, Moehl and Reith2018).
Weber et al. (Reference Weber, Seaman, Stewart, Bird, Tatem, McKee, Bhaduri, Moehl and Reith2018) project demonstrated that the census-based population estimates had significantly underestimated the total population in the study areas. For example, in the Kano metropolitan area, the satellite-based estimates were higher than the census-based extrapolations by more than one million people. Comparing satellite data from 2006 to 2014 showed that the built-up area had increased at 4.37% per year, while UN census-based estimates had assumed annual population growth of just 2.1%.
These satellite-based products allowed critical improvements in both the accuracy of estimates of population size and location (and thus the accuracy of vaccination coverage) as well as the efficacy of campaigns. Satellite maps allowed experts to identify settlements that would otherwise have been missed, and satellite data enabled more accurate estimates of overall growth and population size in key areas relevant to the polio vaccination effort. In addition, GPS tracking made possible by the new GIS maps ensured that settlements were actually visited by vaccinators during the campaigns.
3.2. Focus on Kano state
Our analysis of population estimates and vaccination coverage focuses on Kano state. Kano is the historical epicenter of polio in Nigeria and has long been a focus of GPEI efforts (World Health Organization, 2014). In early 2014, the Nigerian state of Kano was considered a key battleground in the fight for eradication of polio in Nigeria. Many campaigns had been conducted in Kano in the prior years, but those campaigns had failed to interrupt transmission of poliovirus (Weber et al., Reference Weber, Seaman, Stewart, Bird, Tatem, McKee, Bhaduri, Moehl and Reith2018). Kano was one of the eight states for which satellite-based maps were first created, and it is one of the examples that Weber et al. (Reference Weber, Seaman, Stewart, Bird, Tatem, McKee, Bhaduri, Moehl and Reith2018) highlighted in their work.
Since the population estimates are associated with Kano state, the increase in the likelihood of halting transmission that we calculate is also specific to Kano state. However, we argue that because Kano state was so central to Nigerian eradication efforts, it is reasonable to use this percentage to represent the likelihood of halting transmission of polio in Nigeria as a whole. Thus, estimates of vaccination campaign costs and health benefits are computed for all of Nigeria, not just Kano state. Essentially, we are arguing that if you can successfully halt transmission in Kano, you can halt transmission for the country as a whole.
We recognize this is not a perfect assumption. In reality, after nearly 2 years with no polio cases detected, four children in the Nigerian state of Borno were determined to have wild poliovirus, indicating that the interruption of transmission was incomplete in 2014. The appearance of the disease in Borno was widely attributed to security challenges that prevented access to children in that region, which was controlled by the violent terrorist group Boko Haram (Roberts, Reference Roberts2016). However, following this event, no further cases were detected (in Kano, Borno, or anywhere else in Nigeria), and Nigeria was officially certified as free of wild polio in 2020 (Guglielmi, Reference Guglielmi2020). Also of note, strategies such as security-escorted vaccinator visits and rapid campaigns to enable vaccination efforts in terrorist-held areas also relied on satellite-based maps and GPS tracking to ensure efficient access to the target population (Adamu et al., Reference Adamu, Archer, Braka, Damisa, Siddique, Baig, Higgins, Sume, Banda, Korir, Waziri, Gidado, Bammeke, Edukugo, Nganda, Forbi, Burns, Liu, Jorba, Asekun, Franka, Wassilak and Bolu2019). Researchers developed new satellite-based methods to distinguish between inhabited settlements and those that had been abandoned due to violence, increasing the efficiency and safety of vaccination efforts in insecure areas (Higgins et al., Reference Higgins, Adamu, Adewara, Aladeshawe, Aregay, Barau, Berens, Bolu, Dutton, Iduma, Jones, Kaplan, Meleh, Musa, wa Nganda, Seaman, Sud, Vouillamoz and Wiesen2019).
4. Data
In gathering data to conduct this analysis, we rely on a wealth of information documenting the planning and conduct of the actual vaccination campaign, including the role of satellite-based population calculations and maps. Polio vaccination campaigns had been conducted in Nigeria using traditional, non-satellite-based population estimates immediately prior to the transition to satellite-based estimates. This allowed us to gather detailed and highly relevant data on how vaccination campaigns would have been designed without satellite data.
4.1. Population estimates and vaccination coverage
As noted above, an accurate estimate of the population is a critical element to accurately determining the true vaccination coverage during a campaign. Since polio vaccination campaigns target children under 5 years old, the population estimates discussed here are for that group (Table 1).
Table 1. Definition of key variables and their values

4.1.1. True population of the under-five population of Kano state (Ptrue)
As discussed above, Weber et al. (Reference Weber, Seaman, Stewart, Bird, Tatem, McKee, Bhaduri, Moehl and Reith2018) demonstrated that researchers used satellite data to produce estimates of the population that do not rely on census estimates, and they also demonstrated the ability to use this method to determine the size of sub-populations, including children under five. The accuracy of those methods was validated by fieldwork. Importantly, the method developed by Weber et al. (Reference Weber, Seaman, Stewart, Bird, Tatem, McKee, Bhaduri, Moehl and Reith2018) makes it possible to generate prediction intervals for spatial population estimates, thus making it possible to generate a probability distribution to represent the true population of children under five in Kano State. This allows us to quantify the residual uncertainty associated with these population estimates.
In the time since the Weber et al. (Reference Weber, Seaman, Stewart, Bird, Tatem, McKee, Bhaduri, Moehl and Reith2018) published the paper, the Geo-Referenced Infrastructure and Demographic Data for Development (GRID3) organization and its partner, WorldPop, a research program at the University of Southhampton, have continued to refine and improve the data and methodology used in that case. Based on this updated data and methodology, GRID3 provided the probability distribution for the under-five population of Kano state used in the calculations undertaken in this article (WorldPop, 2019).
4.1.2. Satellite-based population estimate of Kano state (Ps)Footnote 4
The satellite-based population estimate for the under-five population of Kano state is represented by the mean under-five population value provided by the GRID3–2,678,826.
4.1.3. Census-based population estimate of Kano state in 2014 (Pc)
The Nigerian National Bureau of Statistics released a demographic statistics bulletin in 2017 that estimated the population of Kano State in 2014 as 12,241,682. For the purposes of vaccination planning in Nigeria, it is typically assumed that a uniform 20% of the population is under 5 years of old (Alegana et al., Reference Alegana, Atkinson, Pezzulo, Sorichetta, Weiss, Bird, Erbach-Schoenberg and Tatem2015). This results in an estimate for the under-five population of 2,448,336 children.
4.1.4. Threshold vaccination coverage required to halt transmission (Vth)
The target that was set for Nigeria in 2014 by the GPEI program to interrupt transmission was >80% coverage in high-risk areas as confirmed by LQAS (World Health Organization, 2013).
4.1.5. Measured vaccination coverage without satellite maps (Vmeasured-nosat)
As noted above, vaccination campaigns aim to vaccinate every eligible child, but the vaccination rate that is achieved may vary significantly from both the threshold and this goal. Therefore, it is important to take into account the actual vaccination coverage achieved. In 2011, before the first satellite-based maps were created, the vaccination coverage rate in Kano was typically 60% or lower (Wannemueler, Reference Wannemueler2012). In retrospect, we know that even this relatively low vaccination coverage rate was an overestimate, since entire settlements were being systematically missed by both vaccinators as well as evaluators carrying out the LQAS validation process, due to the absence of these settlements on hand-drawn maps used for campaign planning (Barau et al., Reference Barau, Zubairu, Mwanza and Seaman2014).
By 2014, after satellite maps and GPS tracking had been fully implemented, the vaccination rate in Kano reached 89%. It seems likely that much of the improvement in vaccination coverage can be attributed to satellite-based maps and the GPS tracking they enabled. However, to account for the possibility that other interventions, such as improved engagement with community leaders or provision of incentives, contributed to this increase, we also consider the possibility that measured vaccination coverage could have reached 89% in the absence of satellite-based maps and information. However, it is important to emphasize that this 89% coverage would still only apply to the known population as shown on hand-drawn maps and estimated by the census-based population estimate.
4.1.6. Measured vaccination coverage with satellite maps (Vmeasured-sat)
The first maps based on satellite data were completed in July 2012. These added missing settlements into the plan and enabled the first GPS-tracking of vaccination teams (Barau et al., Reference Barau, Zubairu, Mwanza and Seaman2014). The improved maps, along with the GPS tracking to ensure all settlements were visited, were expanded over the following 2 years. This change was associated with a steady increase in vaccination coverage as determined by LQAS. By 2014, Kano state had an average vaccination coverage across campaigns of 89% (Seaman, Reference Seaman2014).
4.2. Campaign Cost Savings
The socioeconomic benefits of halting transmission of polio in 2014 are directly related to the costs of maintaining the large-scale vaccination campaign efforts necessary to halt transmission in a country where polio is endemic—in this case, Nigeria. Therefore, in this section, we identify and enumerate those costs. GPEI organizes polio eradication costs into four categories: immunization activities (e.g., the vaccine campaigns themselves), surveillance and response capacity, containment and certification, and core functions and infrastructure.
The total cost of immunization activities is heavily influenced by the number and quality of vaccination campaigns (Global Polio Eradication Initiative, 2014). Each of these campaigns is complex and expensive. The goal of a polio vaccination campaign is to give two drops of oral polio vaccine to every child under 5 years old residing in the target areas over the course of the four-day campaign (Barau et al., Reference Barau, Zubairu, Mwanza and Seaman2014). To enable this, the program must purchase a sufficient number of oral polio vaccines and cover operational costs. They must also account for campaign-related social mobilization costs and communication efforts to ensure there are high levels of awareness and demand for the vaccine within the community (Global Polio Eradication Initiative, 2014).
Planning for these campaigns requires significant operational and managerial efforts to facilitate national, international, and local coordination, supervision, and performance evaluation. Carrying out the campaign requires a large number of vaccinators, engagement of local community-based educators, and technical assistance from experts. These individuals require access to adequate transportation and communication capabilities to reach inaccessible and sometimes insecure areas, as well as adequate vaccines and cold-chain storage (Nasir et al., Reference Nasir, Bandyopadhyay, Montagnani, Akite, Mungu, Uche and Ismaila2016; Vaz et al., Reference Vaz, Mkanda, Nsubuga, Ado and Etsano2016). In Nigeria, each campaign involves visiting hundreds of wards and managing thousands of vaccination teams operating during each campaign (Barau et al., Reference Barau, Zubairu, Mwanza and Seaman2014).
In addition to the campaigns themselves, funding is also required to support surveillance and emergency response. This includes a surveillance network to detect and investigate acute flaccid paralysis cases and maintain laboratories able to do this analysis. Emergency response efforts are undertaken in response to outbreaks, and thus are especially relevant in countries where polio is still endemic. Emergency response is also required when outbreaks occur in countries where polio is not endemic, but is imported from an endemic country (Global Polio Eradication Initiative, 2014). Accordingly, funds needed to support these activities will decrease when transmission of polio is halted in an endemic country like Nigeria.
Containment and certification of wild poliovirus require not only highly sensitive surveillance, but also full application of bio-containment requirements across the entire world. These efforts continue even in regions of the world certified to be polio-free. GPEI also supports countries with their core infrastructure, including technical assistance, efforts to improve the efficacy of immunization campaigns, community engagement, and research and development. In some high-priority countries, this also involves supporting efforts to improve routine immunization systems.
GPEI provides annual expenditure documents with high-level summaries of expenditures for the GPEI program as a whole. Table 2 shows total annual expenditures as well as the portion of expenditures spent directly on immunization activities. Immunization activities represent a very large proportion of overall GPEI expenditures, although spending in this area decreased notably after Nigeria halted transmission of wild poliovirus in 2014.
Table 2. GPEI annual expenditures (US$ millions)
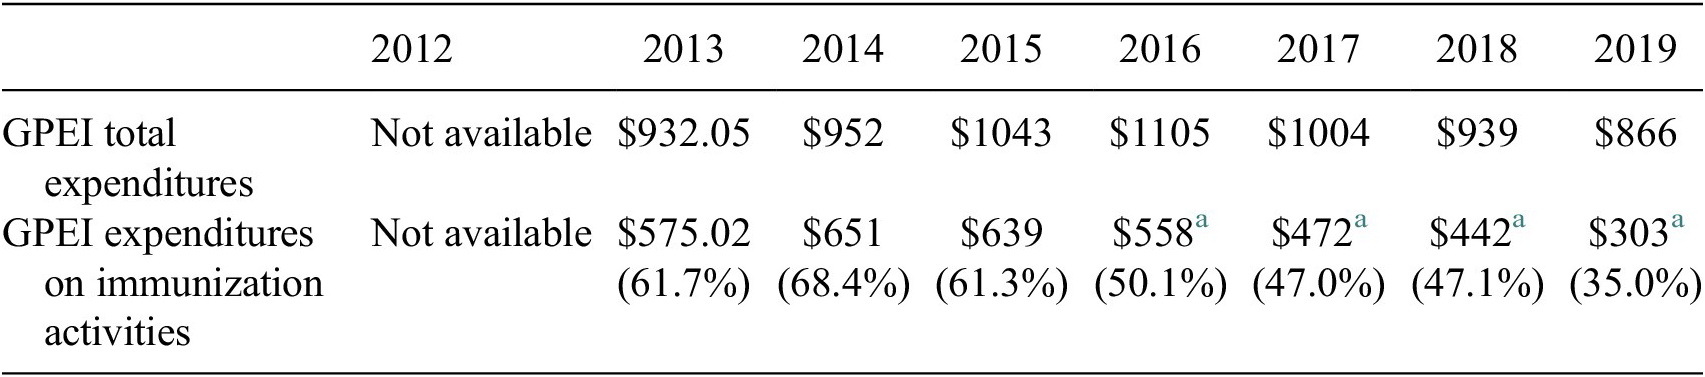
a The organization of costs in the annual expenditure report changed in 2016 compared to earlier years. This number represents the cost of “campaigns” and “other immunization activities.”
Financial Resource Requirements (FRR) reports (GPEI’s budget planning documents) from the period 2013–2018 were released approximately bi-annually from 2012 to 2014 and provide significantly greater detail, including a breakdown of costs in Nigeria. These documents show that costs associated with GPEI activities in endemic countries account for nearly half of the total costs for the program, with efforts in Nigeria being particularly costly. As of 2014, GPEI efforts in Nigeria alone were expected to account for more than a quarter of all GPEI costs from 2013 to 2018. Estimated total costs for GPEI activities in Nigeria based on these documents are shown in Table 3. As of 2017, GPEI moved to an interactive online tool to provide budget information and the categories used to break down funding areas changed (Global Polio Eradication Initiative, 2020a). Total budget estimates for Nigeria for 2017–2020 based on this tool are shown in Table 4.
Table 3. GPEI budget estimates for Nigeria 2012–2017 (US$ millions)
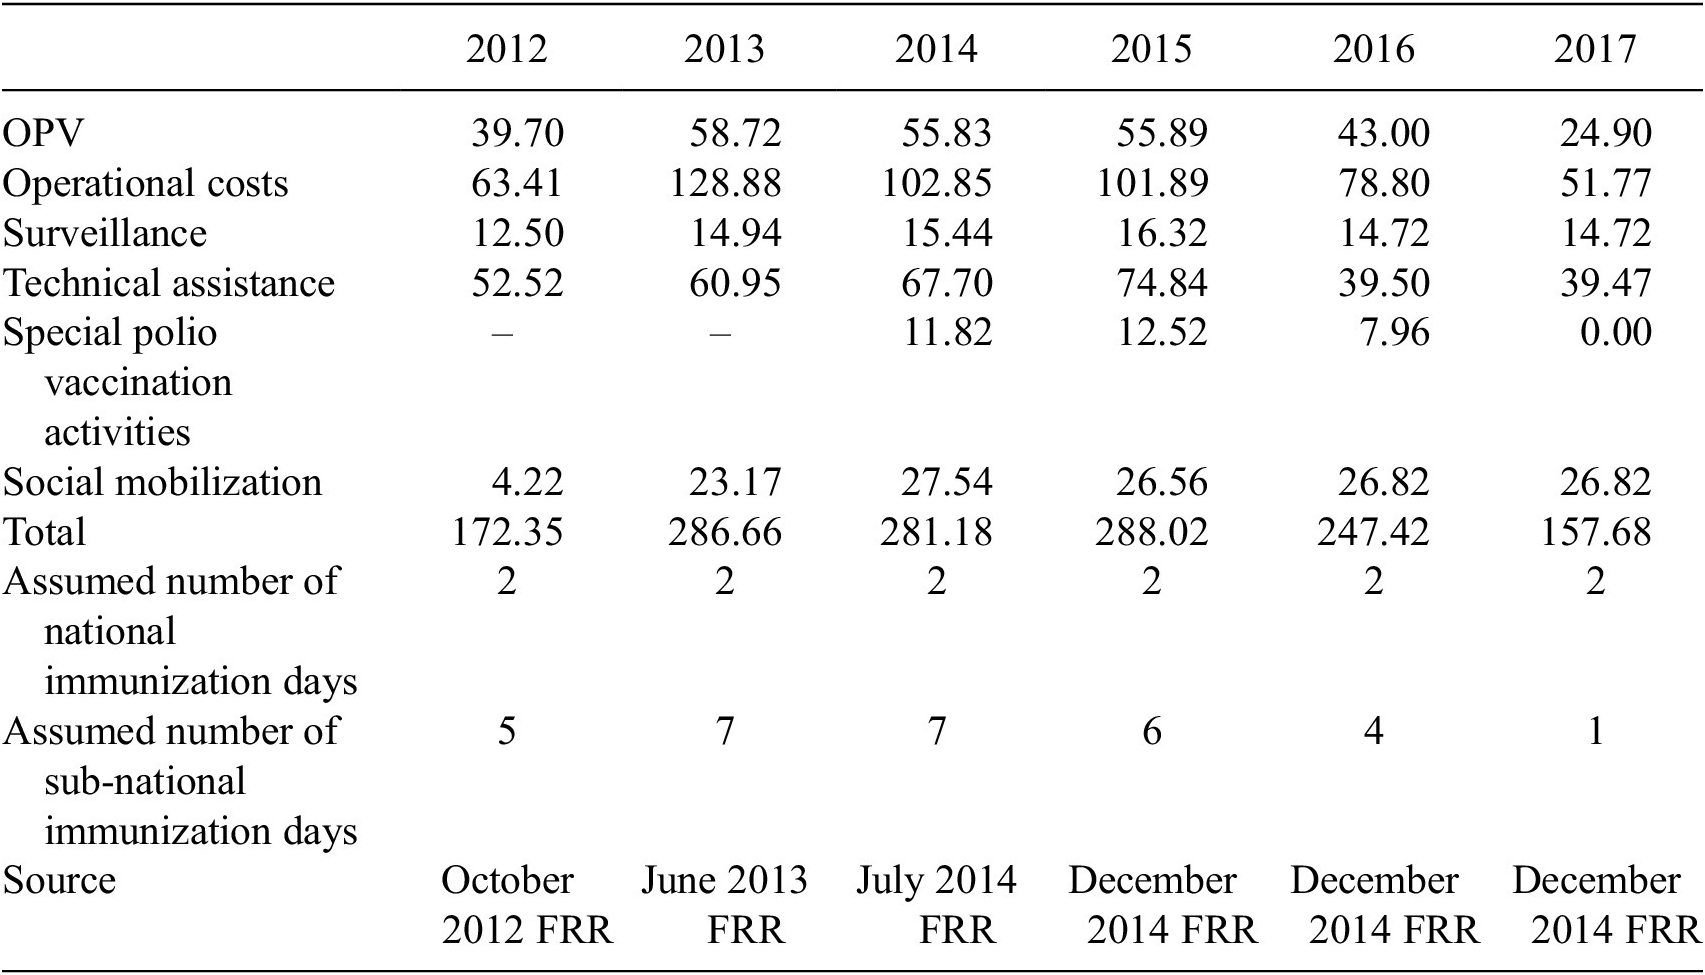
Table 4. GPEI budget estimates for Nigeria 2017–2020 (US$ millions)
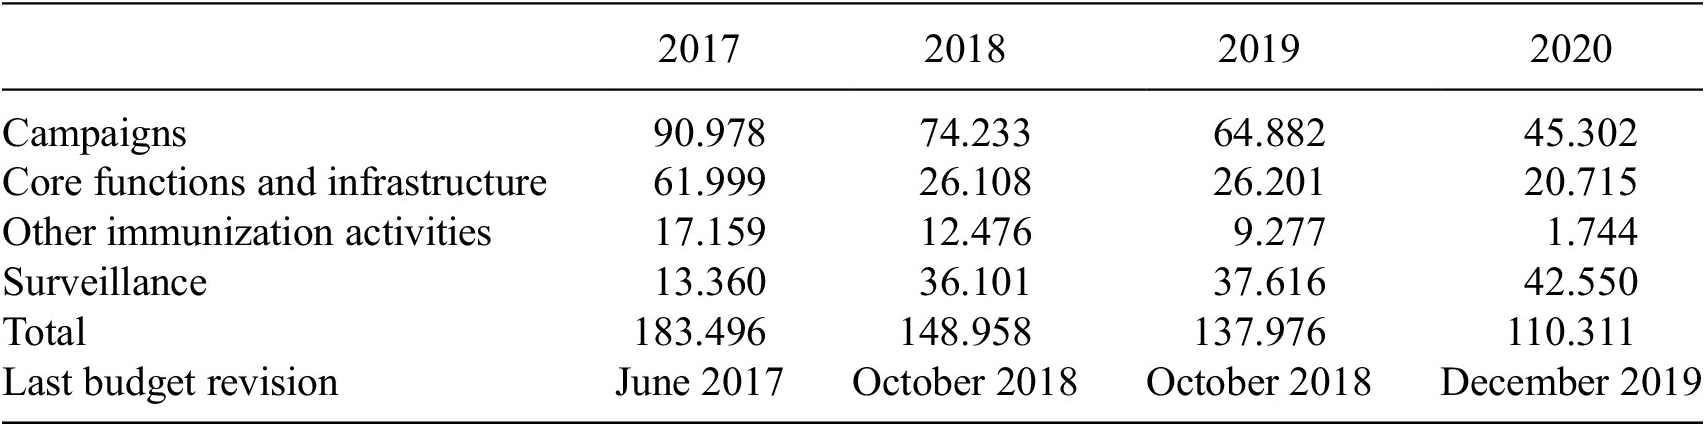
Note. These budget estimates are based on the GPEI interactive online budgeting tool (Global Polio Eradication Initiative, 2020b).
As noted above, these costs are significantly impacted by the number and extent of vaccination campaigns required, which decreases when interruption of transmission is achieved. These charts show that while costs do not go down immediately, due to the need to continue intense immunization efforts until the elimination of wild poliovirus is confirmed, costs decrease significantly within a few years. Funding needed during these “ramp down years” would remain similar regardless of the year transmission was halted. Therefore, for the purpose of this analysis, we will use 2014 and 2020 as representative years.
If transmission of wild poliovirus had not been achieved in 2014, then GPEI could have expected to face an additional year with costs of approximately $281.18 million in place of an additional year with low-cost, post-certification costs similar to those faced in 2020, of approximately $110.331 million. Therefore, the cost of not halting transmission in 2014 is estimated at $170.85 million.
4.3. Improved health
Perhaps the most salient benefit of halting transmission of polio is the decrease in the number of children that become ill with the disease. We look at both wild polio cases in Nigeria as well as instances of outbreak polio—cases outside Nigeria caused by ongoing polio in Nigeria (Table 5).Footnote 5 Based on this data, we make rough estimates of the number of polio cases that may have occurred if satellite-based maps and population estimates had not been used. We also translate this reduction of disease into socioeconomic costs using widely-accepted values from the global health literature.
Table 5. Polio cases in Nigeria 2011–2020
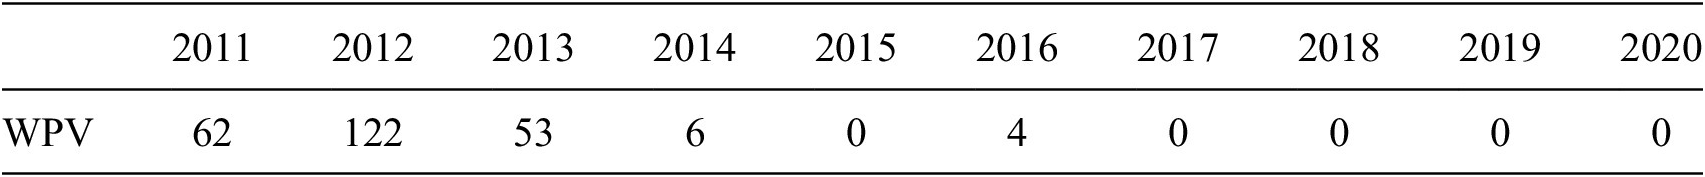
Source: Progress Toward Poliomyelitis Eradication—Nigeria, January 2014–July 2015.
4.3.1. Wild polio cases
Although polio is a highly contagious disease, with a high risk of serious complications, cases typically decrease significantly in the years prior to interrupting transmission due to the ubiquity of vaccination campaigns. WPV cases in Nigeria steadily decreased from 122 in 2012 to just six in 2014 (five of which were in Kano state) (U.S. Centers for Disease Control, 2015). The decrease in the number of infections is likely related to the increase in vaccination coverage, as discussed above, which was influenced significantly by the introduction and expansion of the satellite-based maps and GPS-tracking that began in mid-2012 and were fully implemented in 2014. Therefore, we will consider a range from six cases to 122 cases to represent the likely number of additional cases that would have occurred in the absence of the satellite-based maps and population estimates.
To translate this into a dollar value, we rely on estimates developed by Tebbens et al. (Reference Tebbens, Pallansch, Cochi, Wassilak and Thompson2015). These researchers estimate the socioeconomic costs per paralytic polio case at approximately $27,000 in a lower middle-income country like Nigeria. This estimate takes into account an estimated 14 disability-adjusted life-years per paralytic polio case combined with a willingness to pay based on the average annual per-capita gross national income of this country group. This total aims to approximate costs associated with lost wages and suffering in the absence of direct estimates. This estimate suggests a socioeconomic cost of between $162,000 and $3,294,000 associated with these cases (Tebbens et al., Reference Tebbens, Pallansch, Cochi, Wassilak and Thompson2015).
4.3.2. Polio outbreak
Wild polio infections can occur in non-endemic countries due to importation of the virus from endemic countries—a phenomenon referred to as outbreak. In 2013 and 2014, WPV imported from Nigeria caused outbreaks in Somalia and Cameroon, resulting in a combined 108 cases in these countries (Global Polio Eradication Initiative, 2015). Following the initial halt of transmission of WPV in Nigeria in 2014, no further WPV outbreaks have been linked to the country (World Health Organization, 2019). The number of cases associated with WPV outbreaks is unpredictable, since it depends significantly on the immunization levels in other countries, however, based on the experience in 2013–2014, we will use a rough estimate of 50 cases to represent the likely number of additional cases that would have occurred in the absence of the satellite-based maps and population estimates. The socioeconomic cost associated with these cases would be approximately $1,350,000 (Tebbens et al., Reference Tebbens, Pallansch, Cochi, Wassilak and Thompson2015).
In addition, when outbreaks occur, rapid large-scale responses are required to address them, including special vaccination campaigns and enhanced surveillance, which, as noted above, typically cost millions of dollars to plan and implement (Global Polio Eradication Effort, 2013). We do not include an estimate of these costs in our analysis due to wide variation possible, so the estimates associated with outbreak likely underestimate true costs.
4.4. Cost of generating satellite-based estimates
Finally, we account for the costs of generating satellite-based estimates. Gates Foundation officials estimated the top-line number for this activity at approximately $5.75 million. This estimate includes not only the cost of the satellite data itself (about $1.5 million), but also the effort required to analyze the data and create the data products, as well as validation activities on the ground in Nigeria and training and capacity-building activities to enable local actors to use the products (Bill and Melinda Gates Foundation, 2021). While some additional funds have been spent to maintain, update, and improve these capabilities, the maps themselves as well as the approach developed can be, and has been, leveraged and applied in additional situations and products for significantly lower cost. The conclusion section identifies some of the broader applications that have come from this work.
5. Methodology: Value of Information
The goal of this article is to determine the socioeconomic benefit associated with the use of satellite-based products and applications during the polio eradication campaign in Nigeria. We use a value-of-information approach, estimating the difference in the magnitude of socioeconomic benefits associated with a scenario in which satellite-based information is used compared to a counterfactual scenario in which it is not. Specifically, this project measures the socioeconomic benefit related to the use of satellite-based estimates of population for a polio vaccination campaign in Nigeria, compared to the counter-factual case of reliance on non-satellite-based population estimates. The magnitude of these benefits depends on the difference in the likelihood of halting polio transmission in each scenario.
5.1. Calculating likelihood of halting transmission
Transmission of a disease is halted when sufficient vaccination coverage—the number of people vaccinated divided by the total population eligible—is achieved. This is the threshold vaccination coverage (V th) required. In practice, programs aim to achieve full coverage—vaccinating every eligible child. However, for a variety of reasons—for example, children that are not home, not feeling well, or otherwise unavailable when vaccinators visit—the actual vaccination rate is lower than the ideal. The vaccination coverage achieved by a campaign is determined through a statistical sampling method undertaken by a validation team after the campaign has been completed, and coverage levels measured by these teams can differ across vaccination campaigns over time (World Health Organization, 2013). To account for this, we include the vaccination coverage rate measured both before satellite-based maps were introduced V measured-nosat and after satellite-based maps were introduced, V measured-sat.
As noted previously, because the validation process relies on the same maps and estimates as the vaccination campaign itself, the vaccination coverage estimated using this method only applies to the known (or estimated) population, not the true population. Therefore, the number of people vaccinated as part of the campaign can be calculated with the following straightforward formula:
 $$ \left(\mathrm{Number}\ \mathrm{of}\ \mathrm{People}\ \mathrm{Vaccinated}\right)=\left(\mathrm{Measured}\ \mathrm{Vaccination}\ \mathrm{Coverage}\right)\ast \left(\mathrm{Population}\ \mathrm{Estimate}\right) $$
This formula results in different estimates for the number of people vaccinated as part of the campaign depending on the estimate of the population. If the census-based population estimate (P c) is used, then the number of people vaccinated would be P c*V measured-nosat. If the satellite-based population estimate (P s) is used, then the number of people vaccinated would be P s*V measured-sat.
To determine how likely either of these efforts would be to halt the transmission of polio, we need to know how they compare to the true population (P true) multiplied by the threshold vaccination coverage required to halt transmission (V th). This can be determined by examining where the satellite and non-satellite cases fall along the probability distribution of the true number of people that needed to be vaccinated in order to halt transmission of polio in Nigeria (P true*V th). This is represented in Figure 1.
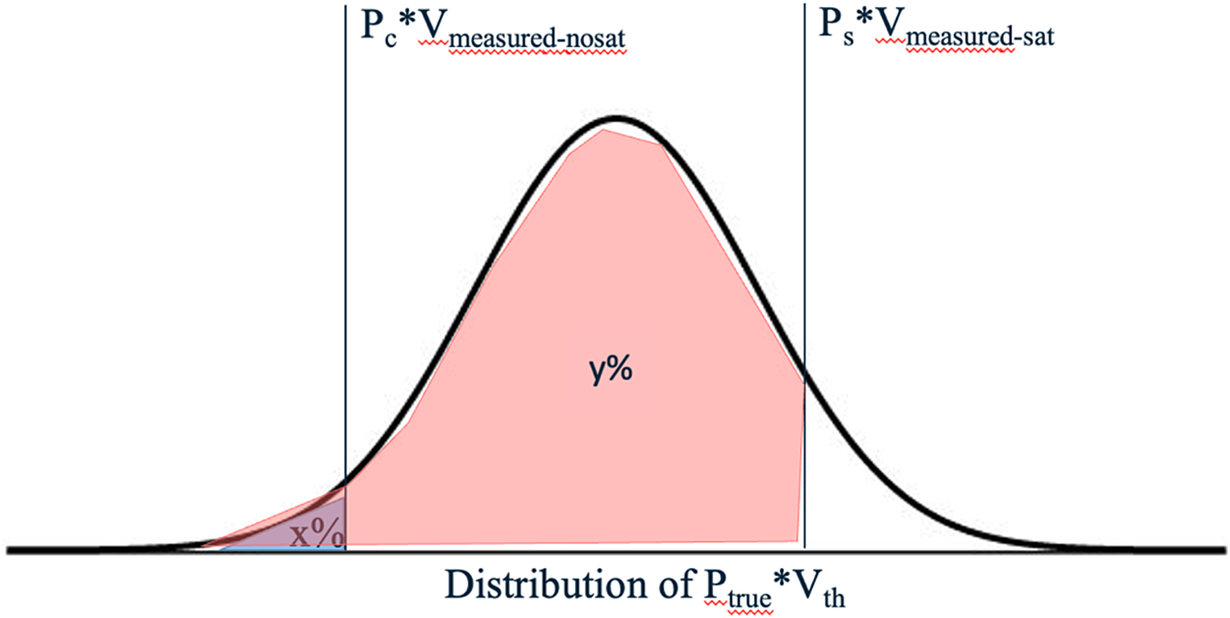
Figure 1. Using the population probability distribution to determine likelihood of eradicating disease.
Figure 1 shows the number of people that would have been vaccinated under a census-based estimate (P c) and a measured vaccination coverage rate associated with a no-satellite data scenario (V measured-nosat). The area under the curve to the left of P c*V measured-nosat, x%, represents the likelihood that the true population was sufficiently small that disease spread would have been interrupted even if a census-based estimate had been used and a no-satellite vaccination coverage rate was achieved.
Figure 1 also shows the number of people that would have been vaccinated if a satellite-based estimate (P s) was used and the measured vaccination coverage rate aligned with that seen in the satellite data scenario (V measured-sat). The area under the curve to the left of P s*V measured-sat, y%, represents the likelihood that disease spread would have been interrupted under the scenario in which satellite data was used to plan and carry out the campaign. While we know in reality, the spread of polio was halted under the scenario in which satellite data was used, this allows us to acknowledge that this result was not guaranteed. Residual uncertainty in the satellite-based estimates of population could have meant that even under this scenario, the true population could have been even larger than estimated, such that the vaccination threshold still would not have been met.
Once we have these two estimates, we can determine the increase in the likelihood of interrupting transmission of polio by using satellite-based maps and population estimates rather than hand-drawn maps and census-based estimates as simply y%–x%. We can then multiply this estimate of the percentage increase in the likelihood of halting transmission of polio associated with the use of satellite data compared to census data to determine the proportion by the socioeconomic benefits associated with halting transmission of polio that can be attributed to satellite data, giving an expected value of the use of satellite data in this case.
5.2. Calculation of net socioeconomic benefits
The socioeconomic benefits fall into two categories. The first is cost-savings to the health system. Intensive vaccination and surveillance efforts are expensive in terms of human effort and materials, and if these can be completed in a shorter period of time, significant savings are possible. The second outcome is better health for individuals within the population. If disease transmission is halted earlier, fewer people get infected. In the case of polio, this means fewer children are paralyzed. The exact values for these variables are discussed in the data section above.
The socioeconomic benefits of using satellite-based population estimates (or costs of using traditional census-based estimates) would continue to grow with each additional year that transmission continues. In reality, program officials would likely adapt their approach and adopt new methods for planning, so we calculate a conservative estimate of benefits based on just 1 year of additional disease transmission.
Therefore, the expected value of socioeconomic benefits associated with the use of satellite data in this case is calculated as the cost savings and health impacts associated with 1 year of continued transmission, adjusted to account for the possibility that transmission would have been interrupted in 2015, even using traditional methods (our counterfactual).
We also take into account the costs associated with the development of the satellite-based maps and estimates of population. Thus the net socioeconomic benefit of satellite data in the Nigeria polio eradication effort is given by the following formula:
 $$ {\displaystyle \begin{array}{c}\left(\mathrm{Net}\ \mathrm{socioeconomic}\ \mathrm{b}\mathrm{e}\mathrm{nefits}\right)=\left(y\%-x\%\right) \ast \left(\mathrm{total}\ \mathrm{economic}\ \mathrm{b}\mathrm{e}\mathrm{nefits}\right)\\ {}\hskip26.7em -\left(\mathrm{cost}\ \mathrm{of}\ \mathrm{generating}\ \mathrm{satellit}\mathrm{e}\hbox{-} \mathrm{b}\mathrm{ased}\ \mathrm{products}\right)\end{array}} $$
6. Analysis
Bringing all of this data together and following the methodology laid out above, we now calculate the total socioeconomic benefits associated with the use of satellite data to support the polio eradication effort in Nigeria.
6.1. Probability of halting transmission
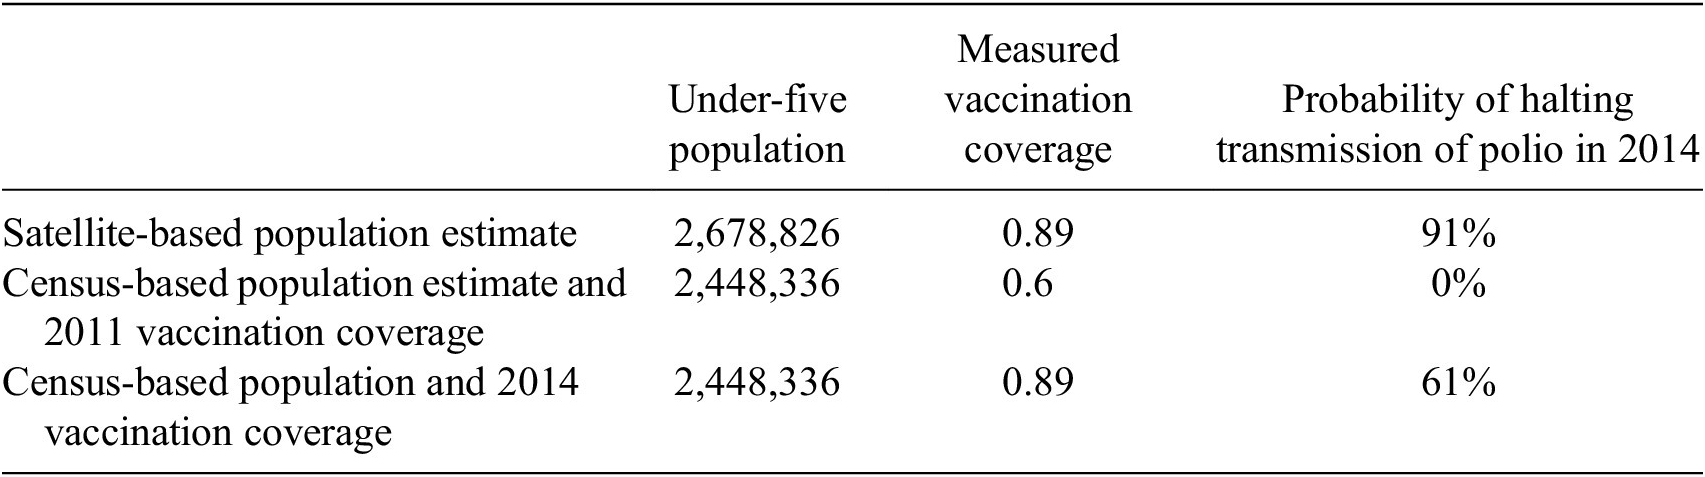
Using the probability distribution of the under-five population of Kano state provided by GRID3, we examine the probability of halting transmission of polio (i.e., achieving 80% vaccination coverage or more) under various scenarios. Using the mean satellite population estimate and the measured vaccination coverage achieved in 2014 of 89%, the probability of halting transmission is 91%—this percentage corresponds to y% in Figure 1. Using either the census-based population estimate or the estimate based on hand-drawn maps, if the measured vaccination coverage was 60%, the distribution suggested there was zero chance of halting transmission. This is not surprising, as both of these population estimates likely underestimate the true population and the vaccination coverage rate is lower than that needed to halt transmission. If we assume that even without the satellite-based maps, vaccine campaigns would have achieved 89% coverage, then the probability of halting transmission with census-based estimates would have been 61%—this percentage corresponds to x% in Figure 1. Overall, this suggests that the satellite-based maps and population estimates increased the likelihood of halting transmission in the range of 30% to 91%, a range generated by comparing the difference between satellite-based population estimates and any of the other potential counterfactuals (Table 6).Footnote 6
Table 6. Probability of halting transmission under different scenarios
6.2. Socioeconomic benefits
The estimated benefits of halting transmission of polio in 2014 associated with vaccine campaign and other programmatic cost savings were determined to be $170,850,000. The socioeconomic benefits associated with the decrease in wild poliovirus cases resulting from halting transmission in 2014 were estimated to fall in the range of $162,000 to $3,294,000, and those associated with the decrease in outbreak polio were $1,350,000. Added together, this suggests a total socioeconomic benefit of between $172,362,000 and $175,494,000.
Cost savings related to campaigns are significantly higher than the benefits from reduced health impacts. As noted above, this is due to the fact that there are typically very few Polio cases in the years immediately preceding a halt in transmission. Expending large sums to continue vaccination campaigns when only a handful of cases occur each year may seem counterintuitive. However, other research shows that the long-term benefits of Polio eradication make this expenditure worthwhile. While efforts to control polio would be less expensive than eradication in the first few years, the cumulative costs would quickly overtake those of eradication (Global Polio Eradication Initiative, 2013a).
6.3. Total socioeconomic value of using satellite data for polio eradication in Nigeria
For this analysis, we want to take into account the fact that the use of satellite maps was not associated with certainty in halting transmission and that there was a possibility that the transmission of wild poliovirus would have been halted in 2014 even if satellite data had not been used. Accordingly, the value attributed to the use of satellite data is between 30% and 91% of these values, resulting in an expected value for these benefits between $51.7 million and $159.7 million. Lastly, we factor in the cost of generating and using the satellite-based maps of $5.75 million. Considering all of these factors, we estimate that the net socioeconomic benefit associated with the use of satellite data to assist in halting the transmission of polio in Nigeria in 2014 is between $46.0 million and $153.9 million.
6.4. Robustness of results: map-based population estimate
We also undertake a second approach to calculating the difference between the satellite-based population estimates and census-based population estimates, due to the specific decision-making processes involved in the polio vaccination processes in Nigeria. Specifically, although census-based estimates may be used for high-level planning, for the planning of individual campaigns—determining how many doses of vaccine to purchase and how many vaccination teams to employ—the GPEI program often uses estimates based on experience from previous years, specifically, the number of children that were reported to have been encountered by vaccination teams in the previous year adjusted to assume some growth. Over time, it appears that these estimates became significantly inflated, so that the population estimates used for planning were significantly larger than the true population. For example, in January 2014, the tally sheet summary stated that 4,270,792 children under five were vaccinated as part of that month’s campaign in Kano state (SIPDs, 2014). Eventually, due to a rigorous supervised enumeration completed by March 2014, combined with the satellite-based estimates, the tally-sheet estimates decreased (Seaman, Reference Seamann.d.). The tally-sheet for the December 2014 campaign suggests that 2,570,295 children under five were vaccinated during that effort (GPEI Nigeria TallySheet Data Summary by State, 2014).
Paradoxically, this means that while the satellite-based maps and population estimates resulted in new settlements being discovered and more individuals being vaccinated, as well as significant increases in total population estimates compared to census-based estimates, they also resulted in a reduction of the population estimates used most directly in vaccination campaign planning (Seaman, Reference Seaman2021a).Footnote 7 To account for this situation—that an artificially inflated over-estimate of population was used for campaign planning while at the same time that the population being served during the campaigns was lower than the true population (because whole settlements were not included in planning maps and thus not being visited)—we test one additional method for estimating the total population included in polio vaccination campaigns prior to the creation of the satellite-data maps. This method takes into account an estimate of the proportion of the total population that was present in the missing settlements.Footnote 8 Researchers estimated that approximately 5% of all settlements were chronically missed before the satellite-based maps and GPS-tracking systems were implemented (Seaman, Reference Seaman2021b). This would suggest a total population for Kano State of 13,038,041 and a total for the under-5 population of 2,325,919.Footnote 9 If we use the assumption that the 89% coverage rate would have been achieved even without the use of satellite data and maps, then the likelihood of halting transmission in this scenario (x% in Figure 1) is 30%. This use of satellite data provides a 61% increase in the likelihood of halting transmission compared to this scenario, and the net economic benefit is at least $105.1 million. This falls within the range produced by our original estimate.
7. Findings and Discussion
Based on the information and analysis above, we find that the use of satellite data in the 2014 polio vaccination campaign in Nigeria resulted in net socioeconomic benefits of between $46.0 million and $153.9 million. This contribution is impressive, and yet these estimates likely under-estimate the total benefits of using satellite data, both qualitatively and quantitatively. On the quantitative side, it is worth reiterating that the benefits calculated here represent just 1 year of socioeconomic benefits. As noted above, our methodology assumes that even without satellite data, national planners would have adjusted their approach and halted transmission of polio just 1 year later. However, given the many reports regarding the large impact of the use of satellite-based maps and population estimates, as well as the trends in vaccination coverage and cases associated with the introduction of these methods, it seems likely efforts to halt transmission would have taken significantly more time. Some experts even voiced concerns that a failure to eradicate polio in Nigeria in this timeframe could have led to the abandonment of the eradication effort overall (Global Polio Eradication Initiative, 2013b). This would suggest a true socioeconomic benefit associated with the use of satellite data many times the estimate provided here.
It is important to note that while our methodology relies on differences in the total population estimate, in reality, a critical benefit of the use of satellite-based products and applications came from improved accuracy in determining the geographic location of settlements and the ability to identify and include settlements that had been systematically missed in the past. When threshold vaccination coverage levels are set, planners assume homogeneity and randomness—all individuals within the population are equally likely to be vaccinated and failure to vaccinate is essentially random (e.g., the family wasn’t home because they were visiting relatives at the time of a particular campaign or the child happened to be sick that day). If some individuals are being systematically missed—because their settlement is never visited due to a lack of awareness among vaccinators that it exists—then this assumption does not hold. Under these conditions, it would be nearly impossible to halt transmission of the disease. The missed settlements would function as ongoing reservoirs of disease that could continue to re-infect surrounding areas.
This effect again suggests that the benefits of using satellite data are underestimated by this methodological approach. Even in the event that the true population was sufficiently small that the threshold vaccination coverage was met even with lower estimates of population (such as those based on census data), it is unlikely that the effort would actually have halted transmission due to these missed settlements (e.g., rather than x%, the likelihood of halting transmission under these conditions would be essentially zero). The importance of geographic distribution and avoiding systematic errors also suggests that maps based on satellite data can provide significant benefits even in cases where the total population is being overestimated by traditional methods.
With respect to qualitative issues, it is worth noting that although our totals include monetary estimates accounting for the value of avoiding between 56 and 172 cases of polio, the benefits of these avoided cases—and the decrease in human strife associated with the possible paralysis or death of the affected children—goes far deeper than the monetary estimate used for quantification purposes.
Another important, but difficult-to-quantify benefit is the role of satellite data in helping to address not only inaccuracies, but also inequities. Notably, the populations that are missing from the traditional census and discovered through satellite images are typically poorer and more vulnerable than those captured by the census. The same forces that drive these individuals to the margin of society also systematically exclude them from official records like the census and the social services that census status dictates. There is value in literally “putting on the map” these traditionally marginalized populations.
Our analysis also does not factor in the long-term benefits associated with capacity building within the local population. As part of the initial effort to create GIS maps in 2011, thousands of Nigerian health workers were trained to read and work with GIS-based maps. This has allowed them to recognize the potential applicability and value of this tool in other areas, including routine immunization activities, logistics support, broader health efforts, and non-health-related projects with a geographic component (Barau et al., Reference Barau, Zubairu, Mwanza and Seaman2014). In January 2021, the Nigerian government took over management and maintenance of a national database originally developed in coordination with these efforts (GRID3, 2021).
Completing a campaign more quickly can also help to avoid vaccine hesitancy. With frequent campaigns, some children may be vaccinated many times, which can lead to confusion or even suspicion among the families involved, particularly given the lack of access to other, seemingly more immediate healthcare needs (Jegede, Reference Jegede2007). Efficient campaigns that result in clear results in a timely manner can help to improve community trust in vaccines more generally.
The experiences in the two remaining countries in which polio remains endemic as of 2023—Afghanistan and Pakistan—seem to reinforce this understanding. Neither of these countries has made extensive use of satellite-based mapping, in part due to local government sensitivity to potential security issues. However, both face unique challenges that limit the ability to directly compare them to the Nigerian case. Even in Nigeria, we recognize that the satellite-based innovations were not the only interventions made, nor the only ones needed. Satellite data-related efforts coincided with high-level political support for polio vaccination efforts, significant funding and logistical support from the international community, broad support among local community leaders, a significant increase in human resources, and innovative approaches to reaching children in insecure areas.
The socioeconomic benefits calculated here account only for the benefits of the use of satellite data in the particular case of halting transmission of polio in Nigeria. However, one of the hallmarks of satellite data (and of value-added products generated using that data) is that the use of the data for one purpose does not reduce the value of that data for other purposes. In fact, not only the maps and estimates themselves, but also the methodology used in the Nigeria case in 2014 has already led to significant benefits in other cases. As noted above, researchers built on this work to create maps that helped vaccinators to reach children in terrorist-held areas in Borno, ensuring that the 2014 benefits associated with halting transmission were not lost due to security challenges (Higgins et al., Reference Higgins, Adamu, Adewara, Aladeshawe, Aregay, Barau, Berens, Bolu, Dutton, Iduma, Jones, Kaplan, Meleh, Musa, wa Nganda, Seaman, Sud, Vouillamoz and Wiesen2019). Satellite maps and population estimates originally developed for polio-related efforts have also been used to support vaccination campaigns related to measles and yellow fever (Oteri et al., Reference Oteri, Idi Hussaini, Bawa, Ibizugbe, Lambo, Mogekwu, Wiwa, Seaman, Kolbe-Booysen, Braka, Nsubuga and Shuaib2021; Seaman, Reference Seaman2021a).
Perhaps most illustrative of the broad benefits arising from this work is the 2018 creation of GRID3, which was formed as a direct result of the experiences using satellite-based maps and population estimates in Nigeria. The organization aims to work with countries to apply these techniques to support a wide array of humanitarian decision making (Center for International Earth Science Information Network (CEISIN), 2020; GRID3, 2023). In 2021, GRID3 was active in 10 countries in Africa, including Nigeria, and was engaged in projects that included supporting vaccination and other health efforts, helping to examine where new schools are most needed to improve access to education, and supporting sustainable development overall (GRID3, 2020a). GRID3 also worked closely with governments in Africa to use their satellite-based resources and capabilities to monitor and address COVID-19, including helping to develop vaccination plans (GRID3, 2020b; 2020c).
Clearly, satellite data has immense current and potential value for the global health sector as a whole. This is also true in other sectors in which satellite data has not traditionally been used, particularly when accurate population estimation or geographic distribution is a key input. Weber et al. note that more than one-third of the indicators established to measure progress on the United Nations (UN) Sustainable Development Goals (SDGs) are defined in terms of total population or subpopulation (Weber et al., Reference Weber, Seaman, Stewart, Bird, Tatem, McKee, Bhaduri, Moehl and Reith2018). More accurate estimates of population across these metrics could have a substantial effect on our ability to understand and address a wide range of critical sustainable development issues.
8. Conclusions
This article used a value-of-information approach to estimate the net socioeconomic value associated with the use of satellite data in efforts to halt transmission of polio in Nigeria. Satellite data enabled the creation of more accurate maps and resulted in the identification of thousands of settlements that had previously been systematically missed by vaccination teams. These satellite-based maps also enabled GPS tracking of vaccination teams that made it possible for officials to ensure that all areas were visited during the campaigns, further decreasing the number of children missed. Population estimates enabled by satellite data proved more accurate than traditional census-based estimates, ensuring that planners had an accurate understanding of the total number of children that needed to be vaccinated. The implementation of these satellite data-enabled interventions was associated with increased vaccination coverage and decreased incidence of wild poliovirus. These trends, along with expert evaluations, suggest that satellite data played a critical role in the ability of Nigeria to halt the transmission of wild poliovirus in 2014.
The net socioeconomic benefits of these activities were estimated using a counterfactual approach that compared the impact of decisions made based on satellite data to the alternative of decision-making based on vaccination campaign planning methods not informed by satellite data. We calculated the likelihood that transmission of wild poliovirus would have been halted in 2014 under each of these conditions. These probabilities were then applied to estimates of the programmatic cost savings resulting from the decrease in human effort and materials associated with halting transmission 1 year sooner than otherwise, as well as the benefits associated with the decrease in wild poliovirus cases. This analysis suggested that the interventions enabled by satellite-data resulted in net socioeconomic benefits of between $46.0 million and $153.9 million.
The monetary benefits listed here are only part of the story. We also acknowledge and describe the difficult-to-quantify benefits associated with improvements in human health, increased attention to marginalized communities, and support for capacity building within the local community. It is also important to acknowledge that both the satellite-data products and the methodology associated with this project have found broad applications that continue to generate further socioeconomic benefits. New applications continue to be developed and many more show potential, suggesting there is much more value that can and will be generated in this area.
Further research on the value of satellite data is needed, particularly in the area of global public health. This article represents just one example where satellite data led to significant socioeconomic benefits, but to better understand the true value of this data, we need to increase the number of these types of studies and analyses. There are many other instances in which satellite data has been used to guide decision-making, but the socioeconomic benefit associated with these activities has yet to be measured. For example, satellite data has been used to inform vaccination efforts related to measles, yellow fever, and COVID-19, as well as broader public health initiatives, such as determining the best location for medical clinics in rural areas. Further research should seek to identify and systematically determine the value of these other uses of satellite data.
We hope that awareness of these benefits will encourage further collaboration between experts in Earth observation, satellite data analysis, and global health, prompting greater uptake of these methods within the global health and international development sectors that fuel productive research and advancements in health-related satellite product development. We believe these developments can and will translate into global socioeconomic benefits, reduction of inequities, and tangible improvements in the lives of people around the world.
Data availability statement
The data that support the findings in this article were gathered from a wide array of sources, most of which are references here and publicly available. A subset of the data was made directly available from officials at the Bill & Melinda Gates Foundation and/or the GRID3 organization, but is not publicly available online. Data are available from the authors with the permission of the relevant organization.
Acknowledgments
We would like to thank officials at the Bill & Melinda Gates Foundation and at the GRID3 organization for providing their time, information, and assistance in developing this work. This article was presented at the Data for Policy Conference 2021 and submitted to Zenodo (Borowitz et al., Reference Borowitz, Zhou and Azelton2021).
Author contribution
M.B. contributed equally to conceptualization and methodology, and was the lead on data curation, formal analysis, funding acquisition, investigation, project administration, supervision, validation, visualization, and writing or the original draft as well as review and editing. J.Z. contributed equally to conceptualization and methodology and supported forma analysis, and writing of the original draft as well as review and editing. K.A. supported the funding acquisition effort, writing of the original draft, and review and editing. I.-Y.N. supported writing of the original draft as well as review and editing.
Funding statement
This research was supported in part by the National Aeronautics and Space Administration cooperative agreement number NNX17AD26A with Resources for the Future to estimate the value of information obtained from satellite-based remote sensing.
Competing interest
The authors of this article declare none.


 Open access
Comments
No Comments have been published for this article.