


 . This is half the value typically obtained by other workers in laboratory tests. The results are compared with other data and the reasons for the disagreement discussed.
 . C’est la moitié de ce qui est généralement obtenu dans les tests de laboratoire. Les résultats sont comparés avec d’autres données et les causes du désaccord discutées.
 . Dieser Wert ist nur halb so gross wie der, der von anderen Forschern in Labortests ermittelt wurde. Die Ergebnisse werden mit Daten früherer Arbeiten verglichen und Gründe für den Mangel an Übereinstimmung werden diskutiert.
Nomenclature
Introduction
Increasing offshore oil exploration in Arctic areas requires knowledge of the forces exerted on large structures by floating ice. In a more exotic area, Reference PoirierPoirier (1982) has suggested that knowledge of the fracture properties of ice is necessary to understand the tectonics of the moons of the outer solar system. One approach to these problems is to use engineering fracture mechanics to study the brittle fracture of ice. Reference SmithSmith (1976) predicted the depths of isolated and multiple crevasses in this way, and also (Reference Smith and TaplinSmith, 1978) used this approach to analyse the flexure cracking of floating ice shelves.
Fracture mechanics assesses the resistance of a material to brittle fracture by a parameter known as the fracture toughness. Methods of fracture-toughness testing high-strength metallic materials are now well defined in British Standards (British Standards Institution, 1977). The specimens used for testing metals have been used for testing both sea ice and laboratory-made fresh-water ice. Other methods such as indenters (Reference Goodman and TaborGoodman and Tabor, 1978) and a pressurized interface crack (Reference Andrews and LockingtonAndrews and Lockington, 1983) have also been used in the laboratory. Reference Andrews, Andrews, McGregor, Miller and MillerAndrews and others (1984) used modified standard specimens for testing ice cut from the surface of Roslin Gletscher (Stauning Alper, north-east Greenland). However, none of these designs is suitable for testing ice samples obtained from within a glacier by coring.
This paper presents an alternative specimen, a pre-cracked ring made from a cylindrical core. The 1982 Sheffield University NE Greenland Expedition used the specimen to measure the fracture toughness of the ice of the Bersærkerbræ. This is a valley glacier in the Stauning Alper, north-east Greenland, lat. 72°10’N., long. 24°30’W. The lightweight apparatus used in the field is described. Although laboratory trials had been successful, the field tests were only partly so, showing a mean apparent fracture toughness of 58 ![]() . This is half the value typically obtained in laboratory and field tests. The results are compared with other data and reasons for the disagreement are discussed.
. This is half the value typically obtained in laboratory and field tests. The results are compared with other data and reasons for the disagreement are discussed.
Specimen Design
The concepts of linear elastic fracture mechanics are not discussed here. Reference KnottKnott (1973) and Reference Lawn and WilshawLawn and Wilshaw (1975) give good introductions, and Reference Miller and MillerMiller (1984) has discussed the application of various fracture-mechanics parameters to ice. The standard specimens for testing metals are given in British Standards (British Standards Institution, 1977), together with the procedure for interpreting the tests to obtain valid results. These specimens are shown in Figure 1.

Fig. 1. The standard fracture-toughness test pieces for metals, drawn with the same crack lengths.
The production of these specimens by a lightly equipped expedition is extremely difficult. Reference Andrews, Andrews, McGregor, Miller and MillerAndrews and others (1984) used modified single edge notch (SEN) bend specimens to test ice cut from surface hummocks on Roslin Gletscher. They were unable to test compact tension (CT) specimens, as it was impossible to make the holes for the loading pins. To test material from below the surface, specimens must be made from cores. The core diameter required for the geometries in Figure 1, especially the SEN specimen, is too great for field use, and accurate manufacture is difficult.
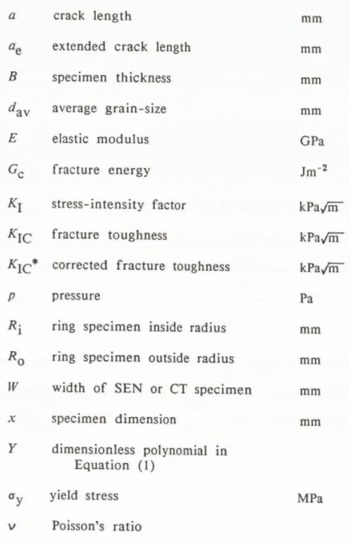
A new geometry, taking advantage of the cylindrical core, was designed. The requirements were that it would be simple to make, required only a short length of undamaged core and would be self aligning in the apparatus. The final choice was a pressurized ring with a radial crack. This crack can be either external or internal; see the inset in Figure 2. In both cases, the pressure is applied using a pressurized rubber bladder. This obviates the need for seals on the ends of the specimen, and retains the fluid when the specimen fails. It is necessary to ensure that the bladder material is flexible at the test temperature. The method exploits the low fracture toughness of ice, as the fracture pressure was around 700 kPa. A similar test for metals would involve pressures of the order of 500 MPa.

Fig. 2. Stress-intensity factors for the pressurized radially cracked ring specimens. The geometries are shown inset.
Externally cracked specimen
Reference Rooke and CartwrightRooke and Cartwright (1976, p. 240) present graphs of stress-intensity factors for various wall thicknesses of the ring. For the particular case R i/R 0 = 0.5, where R i is the inner radius and R 0 the outer, the stress-intensity factor is given by:

where ![]() KI is the mode 1 stress-intensity factor, p the internal pressure, and a the crack length. This equation was fitted by the present author to Rooke and Cartwright’s graphical data; the overall errors are estimated at less than 3% over the range 0 < a/(R
0 − R
i) < 0.7.
KI is the mode 1 stress-intensity factor, p the internal pressure, and a the crack length. This equation was fitted by the present author to Rooke and Cartwright’s graphical data; the overall errors are estimated at less than 3% over the range 0 < a/(R
0 − R
i) < 0.7.
Internally cracked specimen
The common case, where the pressure acts on both the bore and the crack faces, is also given by Reference Rooke and CartwrightRooke and Cartwright (1976, p. 247). However, if the pressurizing fluid is contained in a flexible bladder, the pressure acts only on the bore and not on the crack faces. Using results presented by Reference GrandtGrandt (1978) and the Lame equations for stresses in a pressurized cylinder (see for example Reference DugdaleDugdale, 1968, p. 94), the stress-intensity factor for this case was derived as:

Over the range 0 < a/(R 0 − R i) < 0.65 the errors are estimated as less than 4%. It is emphasized that Equations (1) and (2) are only valid for the specific diameter ratio R i /R0 = 0.5. Equations (1) and (2) are plotted in Figure 2.
Laboratory trials
Laboratory trials were carried out using apparatus similar to the field apparatus described in the next section. Discs of ice were produced by directionally freezing chilled tap-water in moulds. A small hand corer was then used to form a ring of outside diameter 79 mm, inside diameter 40 mm and average thickness 29 mm. The notch was cut with a hacksaw and the tip was sharpened by drawing a fine wire across the root. The specimen was placed over the bladder and the pressure increased until fracture occurred. The fracture toughness was then calculated using Equation (1) or (2) as appropriate.
Nineteen tests were carried out at a temperature of −12°C. The overall mean fracture toughness was 120 ![]() , with a standard error of the mean of 120
, with a standard error of the mean of 120 ![]() . Internally cracked specimens showed a higher apparent fracture toughness than externally cracked. This was attributed to a systematic error in the tests. The rig was cooled for too long before the batch of internally cracked specimens was tested, causing the bladder to stiffen and raise the fracture pressure.
. Internally cracked specimens showed a higher apparent fracture toughness than externally cracked. This was attributed to a systematic error in the tests. The rig was cooled for too long before the batch of internally cracked specimens was tested, causing the bladder to stiffen and raise the fracture pressure.
As the mean value was in good agreement with the data readily available when the apparatus was designed in 1981, it was decided that the design was suitable for use in Greenland the following summer.
Field Apparatus
The apparatus used on the Bersærkerbræ is shown in a block diagram in Figure 3 for full details see Reference Andrews and AndrewsAndrews (1983). The maximum design pressure of the rig was 1.4 MPa [200 p.s.i.]. The specimen, notched and measured, was placed over the rubber bladder. Two cups, one moveable, restrained the expansion of the sections of the bladder outside the specimen. The moveable cup slid on two rods and was clamped in place during the test. A simple hand-operated hydraulic pump provided the pressure. The total mass of the apparatus and jigs for specimen manufacture was 6.3 kg.

Fig. 3. Schematic diagram of the field-test apparatus.
Results
Test site and material
The tests were carried out in July–August 1982, at a site 100 m from the true left lateral moraine of the Bersærkerbræ, as shown in Figure 4. There was no snow cover at the site. The ice tested had originated in Dunottar Gletscher, and had undergone substantial deformation while flowing into the main Bersærkerbræ. The ice was heavily foliated, these foliations being typically 2–4 cm wide, oriented vertically, and lying parallel to the glacier flow. In the bubbly layers many of the bubbles were elongated parallel to the flow, these bubbles being around 2 mm long and 0.5 mm in diameter.

Fig. 4. Location of the test site and the samples used for grain-size measurement on the Bersærkerbræ.
The grain-size at the test site and nine other points shown in Figure 4 was measured using a simple polariscope. For each grain-size sample, the total area was measured from photographs, the grains counted and an average grain-size d av calculated as:
where A is the sample area and n the number of grains. The mean value for all 10 sites was 9.6 mm, with a standard deviation of 3.2 mm. There was no significant variation in grain-size with position on the glacier. There was also no variation in grain-size with depth below the surface, down to 1.5 m. A similar grain-size measurement for the laboratory-made ice used for the trials described above gave d av = 0.91 mm.
Fracture-toughness results
It proved very difficult to produce usable glacier ice specimens, as the majority of the cores shattered while cutting the central hole. This operation had not given any problems during the laboratory trials. All specimens were inspected for internal flaws before testing. The air temperature was typically 4° C; the bladder remained flexible but specimen melting was not significant.
The outside diameter of all rings as tested was 78 mm, the inside 40 mm. This gives a ratio R i/R 0 = 0.51, which is sufficiently close to the value of 0.50 for which Equations (1) and (2) are valid. All specimens were externally cracked. Specimens were made from cores obtained at varying depths below the glacier surface down to a maximum of 2 m.
Table I presents the results of the 20 successful tests. The stress-intensity factor was calculated using Equation (1). The mean fracture toughness was 58 ![]() , with a standard deviation of 17
, with a standard deviation of 17 ![]() . There was no trend in fracture toughness with specimen thickness, crack length, or depth of sample. In all tests the time to fracture was approximately 10 s, giving a mean stress-intensity rate of the order of 6
. There was no trend in fracture toughness with specimen thickness, crack length, or depth of sample. In all tests the time to fracture was approximately 10 s, giving a mean stress-intensity rate of the order of 6 ![]() s−1.
s−1.
Table 1. Fracture-Toughness Test Results for the Ice of the Bersærkerbræ July-August 1982

Reference Urabe and YoshitakeUrabe and Yoshitake (1981) applied a correction to their sea-ice results to account for “flaws” due to brine cells. They extended the measured crack length by one sub-grain-size. If the extended crack length is a e, then for the externally cracked ring specimen the corrected fracture toughness, K IC* is given by:

Here Y is the dimensionless polynomial forming the right-hand side of Equations (1). For glacier ice, there is no equivalent to the sub-grain-size. To allow for grain-boundary flaws, the measured notch lengths were increased by half d av and the corrected fracture toughness calculated. These values are shown in Table I. Figure 5 shows the variation of K IC and K IC* with the depth below the glacier surface. There is some variation of K IC* with depth, with a possible maximum at around 700 mm, but less variation of k IC. Five of these corrected values involve an extended crack length ae greater than the valid range of Equations (1); these have still been included in Figure 5.

Fig. 5. Variation of fracture toughness and corrected (using Equations (4)) fracture toughness with the depth of specimen below the glacier surface.
Discussion
Validity of the results
The British Standard test method restricts the minimum specimen dimensions for a “valid” result. This ensures that the extent of crack-tip plasticity is small compared to the specimen dimensions. Adapted to this specimen, the requirements are:

where x is any of the crack length a, the thickness B, or the remaining uncracked ligament [(R
0 − R
i) − a], and σy is the tensile yield stress. This was estimated from the data of Reference Hawkes and MellorHawkes and Mellor (1972), who presented uniaxial strength data over eight decades of strain-rate. Over a range of strain-rates between 10−5 s−1 and 10−1 s−l, the tensile fracture stress was approximately constant at 2 MPa. Using this, the minimum valid dimension x would be 2 mm when K
IC = 58 ![]() and the results reported here are valid. However, it should be noted that Equations (5) is empirically based on the results of Reference Brown and SrawleyBrown and Srawley (1966) for maraging steels and an aluminium alloy. The same criterion does not necessarily apply to ice, and may be unduly restrictive.
and the results reported here are valid. However, it should be noted that Equations (5) is empirically based on the results of Reference Brown and SrawleyBrown and Srawley (1966) for maraging steels and an aluminium alloy. The same criterion does not necessarily apply to ice, and may be unduly restrictive.
An alternative method of assessing crack-tip plasticity considers the fracture energy G c. In plane strain this is related to the fracture toughness by:

Here E is the elastic modulus and v Poisson’s ratio; the values quoted by Reference Goodman and TaborGoodman and Tabor (1978) are 8.72 GPa and 0.31, respectively. If there are no dissipative processes at the crack tip, G c is twice the surface tension, i.e. the energy of the newly created surfaces. In practice, G c is greater; the difference can be used to assess the fracture mechanisms (Reference Lawn and WilshawLawn and Wilshaw, 1975, p. 73–90, 101–12).
Using K
IC = 58 ![]() as the fracture toughness of glacier ice, G
c = 0.4 J m−2; if a value typical of laboratory tests, 120
as the fracture toughness of glacier ice, G
c = 0.4 J m−2; if a value typical of laboratory tests, 120 ![]() , is used, then G
c = 1.5 J m−2. The surface energy of ice in contact with water vapour is 0.11 J m−2 (Reference Ketcham and HobbsKetcham and Hobbs, 1969). If the fracture were ideally brittle, G
C would be twice this value. For both ices, the fracture and surface energies are within an order of magnitude of each other. It is therefore unlikely that there is any significant plasticity at the crack tip. In comparison, for a typical high-strength steel with K
IC = 50
, is used, then G
c = 1.5 J m−2. The surface energy of ice in contact with water vapour is 0.11 J m−2 (Reference Ketcham and HobbsKetcham and Hobbs, 1969). If the fracture were ideally brittle, G
C would be twice this value. For both ices, the fracture and surface energies are within an order of magnitude of each other. It is therefore unlikely that there is any significant plasticity at the crack tip. In comparison, for a typical high-strength steel with K
IC = 50 ![]() (Reference KnottKnott, 1973) and E = 210 GPa, v = 0.27, the fracture energy is 11 kJ m−2. Lawn and Wilshaw quote a computed surface-energy term for α-iron (the main component of steel) of 10 J M−2. For steel, the fracture energy is three orders of magnitude greater than the surface energy.
(Reference KnottKnott, 1973) and E = 210 GPa, v = 0.27, the fracture energy is 11 kJ m−2. Lawn and Wilshaw quote a computed surface-energy term for α-iron (the main component of steel) of 10 J M−2. For steel, the fracture energy is three orders of magnitude greater than the surface energy.
In conclusion, from considering both the validity criterion. Equations (5), and values of fracture energy, the present results were not affected by crack-tip plasticity.
Comparison with other results
Table II summarizes other fracture-toughness data on laboratory-made fresh-water ice and glacier ice. Where available, the grain-size and crack length are quoted. Unless stated otherwise, the tests were carried out at stress-intensity rates in the range 1–10 ![]() s −1, and temperatures in the range −5°C to −1 °C.
s −1, and temperatures in the range −5°C to −1 °C.
Table II. Summary of Fracture-Toughness Data for Fresh-Water and Glacier Ice

The five SEN bend test results for laboratory fresh-water ice are in reasonable agreement, with a mean value of 108 ![]() . The wide scatter of Reference GoldGold’s (1963) results is due to the multiple irregularly spaced cracks induced by the thermal shock. This has been discussed in greater detail by Reference Andrews, Andrews, McGregor, Miller and MillerAndrews and others (1984). Reference Goodman and TaborGoodman and Tabor’s (1978) indentation results used a crack within a single grain, and so are not strictly comparable with tests on polycrystalline material. The tests of surface ice on Roslin Gletscher (Reference Andrews, Andrews, McGregor, Miller and MillerAndrews and others, 1984) agree with the laboratory results.
. The wide scatter of Reference GoldGold’s (1963) results is due to the multiple irregularly spaced cracks induced by the thermal shock. This has been discussed in greater detail by Reference Andrews, Andrews, McGregor, Miller and MillerAndrews and others (1984). Reference Goodman and TaborGoodman and Tabor’s (1978) indentation results used a crack within a single grain, and so are not strictly comparable with tests on polycrystalline material. The tests of surface ice on Roslin Gletscher (Reference Andrews, Andrews, McGregor, Miller and MillerAndrews and others, 1984) agree with the laboratory results.
However, the present data are significantly below these results, with one exception. This, the “bubbly” ice of Reference Andrews and LockingtonAndrews and Lockington (1983), will be discussed in the next section. It is also noticeable that the present results have a grain-size comparable to the crack length, while the other tests generally had a crack several grains in length. This will be discussed below.
The effect of air bubbles
One explanation for the low fracture toughness of the present results is the presence of air bubbles in the glacier ice. The results of Reference Andrews and LockingtonAndrews and Lockington (1983) partly support this. They presented results of tests at −5° C showing the variation of fracture toughness with the thickness of an air-bubble-free layer in the specimen. When the ice was completely clear, the fracture toughness was comparable to conventional SEN bend tests. (The value in Table II has been converted from a fracture-energy value in the reference.) Extrapolating these data to a completely “bubbly” specimen, this author estimated the fracture toughness of “bubbly” ice as 50 ![]() , close to the value reported here. However, this agreement may be fortuitous; a detailed knowledge of the density, orientation, and size distributions of the bubbles in the two ices is needed.
, close to the value reported here. However, this agreement may be fortuitous; a detailed knowledge of the density, orientation, and size distributions of the bubbles in the two ices is needed.
If a
e is obtained by extending the crack by the length of an air bubble, 2 mm, Equations (4) can be used to assess the effect of air bubbles. The correction at a = 10 mm is an increase of 21%, giving a mean fracture toughness of 70 ![]() . This value is still less than that obtained from most laboratory tests. It is thus unlikely that the air bubbles alone were the cause of the low fracture-toughness results.
. This value is still less than that obtained from most laboratory tests. It is thus unlikely that the air bubbles alone were the cause of the low fracture-toughness results.
The effect of grain-size
The theory of linear elastic fracture mechanics assumes an isotropic elastic continuum. Real materials consist of anisotropic grains but, provided these are randomly oriented and small compared with the dimensions considered, the continuum assumption is valid. Reference Pook, Smith and SmithPook and Smith (1979) suggested that the intense crack-tip stress field, shown schematically in Figure 6, should be at least one grain in extent. This field itself should have a size less than one-tenth of the crack length. Thus for the linear theory to apply, the grains should be less than one-tenth of the crack length in size.

Fig. 6. Schematic representation of a crack and the crack-tip stress field in a polycrystalline solid.
The large grain-size of ice makes this condition difficult to fulfill. This is shown in Figure 7. Here, Gold’s results have been plotted as an average of the values in Table II. Reference Goodman and TrydeGoodman’s (1980) results are not shown, as the stress-intensity rate was two orders of magnitude greater than in the other tests. Reference Goodman and TaborGoodman and Tabor’s (1978) tests are not plotted, as grain-size information is not available. Grain-size data is not available for the tests of Reference Andrews, Andrews, McGregor, Miller and MillerAndrews and others (1984) on Roslin Gletscher; a size of 9 mm, comparable to the Bersærkerbræ ice, has been assumed.

Fig. 7. The effect of the ratio (grain-size/crack length) on reported fracture-toughness values for laboratory-made fresh-water ice and glacier ice.
Figure 7 shows that the present results have been influenced by the large ratio of grain-size to crack length. Where the grain-size is less than 0.6 (crack length), the fracture toughness is unaffected by the ratio of grain-size to crack length. The present results are at the largest ratio of any of the data, and have the lowest fracture toughness. The ring wall contained too few grains to give a true continuum response, and hence the results are not valid fracture-toughness measurements. The laboratory trial results, with a smaller ratio of grain-size to crack size, were valid.
For the present results, the small number of grains in the ring wall invalidated the underlying assumptions of the theory. If the specimens were sufficiently large, true grain-size effects might have been observed. Reference Urabe and YoshitakeUrabe and Yoshitake (1981) showed such an effect for sea ice, after correction using Equations (4). In their case, the continuum theory was still valid, and the correction accounted for flaws.
In conclusion, the glacier-ice results were invalidated by the large grain-size of the ice relative to the specimen size. Undetected flaws induced in manufacture may also have affected the results. The design of specimens for fracture-toughness testing glacier ice will have to take both of these problems into account. Ideally, the specimen dimensions should be at least ten times the likely grain-size, but this may well be impractical for cored specimens. The method of producing the specimen from the core will also require care to ensure that flaws are not introduced at this stage.
Conclusions
-
(1) A pressurized cracked-ring specimen for fracture-toughness testing of cored ice samples has been developed, and shown to give valid results for laboratory-made fresh-water ice.
-
(2) Tests using this specimen on the Bersækerbræ gave an apparent fracture toughness of 60
 , about half the toughness of laboratory-made fresh-water ice.
 -
(3) The large grain-size of the glacier ice relative to the specimen invalidated the assumptions of the elastic theory.
-
(4) When fracture-toughness testing natural ice the specimen must be large enough to form an isotropic continuum.
Acknowledgements
Eann Patterson and John Thompson assisted with the field tests, and John Allen designed part of the apparatus. The Sheffield University NE Greenland Expedition 1982 received financial support from the Gilchrist Educational Trust, the Mount Everest Foundation, the Royal Geographical Society, the Scott Polar Research Institute, and the University of Sheffield. Assistance in kind was given by many individuals and organizations in Britain, Iceland, and Greenland. The author received support from a Sheffield University Travelling Fellowship and assistance with the construction of the test rig from the Royal Society. Dr I.C. Howard kindly commented on the manuscript; responsibility for errors remains the author’s alone. I would also like to thank Professor K.J. Miller for his advice and encouragement throughout the project.


