


Introduction
In this paper, we describe a detailed fast-ice mass-balance study in an Arctic fjord, based on ice observations and in situ measurements from 2003 to 2005. Sea ice in the polar regions responds to environmental changes, so sea-ice studies are important in the context of climate research and investigation of climate variability. Since the evolution of level sea ice depends on air and water temperatures, precipitation, winds and currents, systematic changes in fast-ice extent and thickness would reflect changes in the controlling parameters. In return, sea ice affects the climate, due to its role in affecting the solar radiative forcing and heat exchange at the atmosphere–ocean interface, and due to its contribution to the freshwater balance in the oceans. With the snow and sea-ice surface being highly reflective for solar radiation (compared with an ice-free water surface), the presence of sea ice is crucial for the surface energy balance. The nature of drifting sea ice, the harsh environment and the remoteness make it complex and expensive to do thorough fieldwork-based (usually ship-borne) research on it. Fast-ice studies, on the other hand, are an affordable way to study the evolution of level ice; they can be done from coastal research bases over a long period. The evolution of level sea ice is a key process for sea-ice evolution, and this in combination with dynamical processes (e.g. ice rafting and ridging) results in the momentary picture when looking at the ice situation at a given time.
Detailed fast-ice monitoring was done over several decades in Arctic Canada and USA (e.g. Reference BilelloBilello, 1961, Reference Bilello1980; Reference Brown and CoteBrown and Cote, 1992; Reference MellingMelling, 2002; and currently at Barrow, Alaska: http://www.gi.alaska.edu/snowice/sea-lake-ice/Barrow_observatory.html) and Siberia (e.g. Reference PolyakovPolyakov and others, 2002). Fast ice in Kongsfjorden, Svalbard, before the 1990s was described along with biological studies (Reference Lydersen and GjertzLydersen and Gjertz, 1986; Reference MehlumMehlum, 1991; Reference Parker and MehlumParker and Mehlum, 1991; Reference Smith and LydersenSmith and Lydersen, 1991). However, these references deal mainly with the ice extent and not with its thickness. Snow and ice thickness, physical ice properties and the development of superimposed ice in Kongsfjorden have been investigated more intensively since 1997 (Reference Gerland, Winther, Ørbæk and IvanovGerland and others, 1999; Reference SvendsenSvendsen and others, 2002; Reference Nicolaus, Haas and BareissNicolaus and others, 2003), and first data examples from the Kongsfjorden sea-ice monitoring work were shown in Reference Gerland, Haas, Nicolaus, Winther and WienckeGerland and others (2004) and Reference Gerland and HallGerland and Hall (2006).
The main objectives of this study are (1) to establish a long-term monitoring for quantifying the fast-ice mass balance in Kongsfjorden, (2) to generate a baseline for typical fast-ice evolution scenarios at Kongsfjorden, and (3) to identify possible links between fast-ice mass-balance data and climate index parameters.
Research Area
Kongsfjorden (regarding the physical environment, see Reference SvendsenSvendsen and others, 2002) is located at about 79˚N, 12˚E on the west coast of Spitsbergen (Fig. 1a). The fjord hydrography is highly influenced by the inflow of relatively warm Atlantic water, originating from the West Spitsbergen Current (Reference HauganHaugan, 1999; Reference Cottier, Tverberg, Inall, Svendsen, Nilsen and GriffithsCottier and others, 2005), a branch of the North Atlantic Current, which brings Atlantic water to the Arctic. Characteristic landmarks at Kongsfjorden are: Brandalpynten, a cape just west of Ny-Ålesund; Blomstrand-halvøya, the largest island in Kongsfjorden, north of Ny-Ålesund at the northern shore of the fjord; the archipelago Lovénøyane in the inner fjord, with Storholmen the largest and westernmost island; Dyrevika, the bay in the northern inner fjord; and several glaciers terminating in the fjord, among them Kongsvegen in the southeast (Fig. 1a). More general information on Kongsfjorden and issues related to sea ice are given in the publications listed in the Introduction.
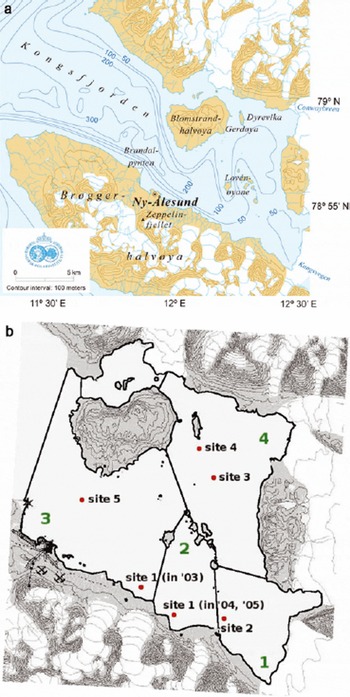
Fig. 1. Maps of Kongsfjorden: (a) sea-floor topography; and (b) inner part of the fjord with sectors 1–4 (labelled with green numbers) and monitoring sites (see text).
The permanent presence of staff at the research base of the Norwegian Polar Institute, Sverdrupstasjonen, and daily visits to the observatory on the mountain Zeppelinfjellet (474ma.s.l., south of Ny-Ålesund) enable regular in situ thickness measurements and ice observations (weather and visibility permitting). The Ny-Ålesund airstrip, with biweekly access and an extensive infrastructure, allows for short and long, small and large field campaigns.
Methodology
Sea-ice mass-balance monitoring as presented here involves (1) regular snow- and ice-thickness measurements, and (2) observations and quantification of ice extent. Only the combination of both types of observations results in quantitative sea-ice mass-balance data, and only with both datasets are we able to characterize the ice situation, for example in terms of stability against destruction by waves or after being affected by mild spells in winter.
Here, we detail the applied measurement and observation methods including data processing, resulting in fast-ice and drift-ice extent time series and ice-mass time series.
Ice thickness
Ice thickness and freeboard were measured conventionally from drillholes using a Kovacs thickness-gauge tape measure. The snow thickness was measured with a metal stake. The monitoring usually consisted of observations at four to five sites in inner Kongsfjorden (Table 1; Fig. 1b). Drillings were made approximately every 2 weeks as long as it was possible to access the sites. At each site on each occasion, three holes were drilled in the corners of a triangle with 10 m side length to account for variability at the site (see also Reference Gerland and HallGerland and Hall, 2006). The data from the three holes were then averaged.
Table 1. Monitoring sites, with position and number of measurements per site and year

Ice extent
Ice-extent data were derived from ice maps and photography. The maps were drawn by hand visually assessing the ice edge, and photographs were taken from Zeppelinfjellet. Additionally, we took into account occasional pictures taken from aircraft. In maps and from photographs, we classified the ice as fast ice and ‘other ice’, usually either pack ice broken off the fast ice, or ice advected from other areas (Krossfjorden and areas outside Krossfjorden/Kongsfjorden). Photographs were rectified using landmarks (e.g. capes, islands) to include additional information about the ice edges on them in ice maps.
Processing
In order to account for locally different ice formation conditions, we divided the observation area into four sectors (Fig. 1b). Sector 1 (18.2km2) is in the innermost southern part of the fjord, sector 2 (13.7 km2) is south of the Lovénøyane, sector 3 (48.8km2) is in the western inner part (between Ny-Ålesund and the Lovénøyane) and sector 4 (39.3km2) is in the innermost northern part. In the west, the north–south-oriented line passing through Brandalpynten just northwest of Ny-Ålesund marked the outer end of the research area; in the centre the Lovénøyane are a natural border between sectors. The other end-points of borderlines are prominent small capes on the southern shore. As the area north of Blomstrandhalvøya is not visible from Zeppelinfjellet, it is excluded from extent and mass calculations. Ice extent in each sector was calculated using the fast-ice extent dataset. We combined those sector extent data with thicknesses from drillings to calculate the ice mass for each sector. Furthermore, the ice mass at a given time in the entire research area was calculated using a bulk ice density of 925 kgm–3. Snow and drift ice were not considered here.
Results
Fast-ice extent, 2003–05
Since, in this study, fast-ice extent observations are based on visual observations, no data exist for the dark period (polar night). The routine for regular fast-ice observations was first established in April 2003. However, supplementary information on the ice extent near Ny-Ålesund could be obtained for March 2003 from images taken by the webcam at Zeppelinfjellet (http://www.nilu.no/niluweb/services/zeppe-lin/). Since this webcam only covers parts of one of the sectors (sector 3) in this study, it was not used for periods when the regular monitoring was in place.
2003
Webcam imaging from Zeppelinfjellet indicates complete fast-ice coverage of the observation area in March (since it is unlikely that inner parts are ice-free while the area near Ny-Ålesund is completely ice-covered). Regular observations started as late as April 2003, when the ice edge was positioned at the longitude of Storholmen, with more ice in the north and less ice in the south (see Fig. 2a). By mid-May, the edge appeared as a pair of U-shaped bays north and south of the Storholmen. Further on into mid-June, most changes occurred in the southern innermost fjord (sector 1), where the ice edge retreated substantially, while changes are only minor in the area north of the Lovénøyane. The ice stayed longest in the inner northern part, Dyrevika (sector 4). It was still landfast, but becoming wet, porous and unstable, and finally melted completely in early July.
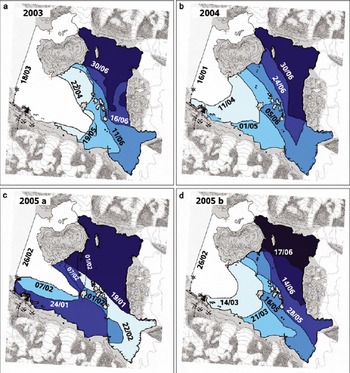
Fig. 2. Maps of ice extent for 2003 (a), 2004 (b) and 2005 (c,d). Dates (day/month) are drawn next to the corresponding fast-ice edges.
2004
Observations started in January 2004, at which time the entire observation area was ice-covered (see Fig. 2b). In April 2004, the ice edge was located near Ny-Ålesund, slightly U-shaped, with the land-ice edge connection functioning as fixing points. The same shape was also visible in May 2004, when the easternmost extent of the ice edge was at Storholmen. The role of Storholmen as a fixing point for fast ice becomes very clear when revisiting the ice situation in early June, when it represented the westernmost extent of the ice. By the second half of June, all fast ice in the southern part of the fjord was gone, but substantial amounts of fast ice survived in the northeastern parts of the fjord. This ice, however, was clearly affected by melting and more and more transformed into porous, unstable ice with a surface having been wet or deteriorated ice. The fjord first became fast-ice-free in July 2004. In order to further illustrate the changes from 2004, photographs taken from Zeppelinfjellet for different stages are shown in Figure 3. To cover the ice edge in the images, photographs from 18 and 29 March and 13 April 2004 were taken with the lens pointing towards outer Kongsfjorden (north-northwesterly direction), while the photographs from 19 May and 18 June 2004 were taken viewing the inner fjord (easterly direction).
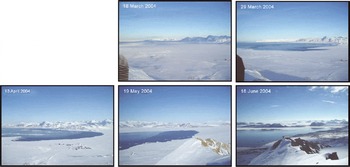
Fig. 3. Photograph series illustrating the sea-ice development in Kongsfjorden in winter and spring 2004 taken from Zeppelinfjellet. The camera was pointed towards the ice edge for the respective images, i.e. towards the outer fjord (north-northwesterly direction) for 18 and 29 March and 13 April, and towards the inner fjord (easterly direction) for 19 May and 18 June.
2005
In 2005 (Fig. 2c and d), the Kongsfjorden fast ice developed relatively late in winter, and the decay started early. The late timing enabled visual observations of the ice formation. In mid-January (Fig. 2c), only the inner northern part was covered with fast ice. By the beginning of February, fast ice had also expanded over the southern inner part off Kongsvegen, with the ice edge at the longitude of Storholmen. After recurring retreat and advance of the ice edge, fast ice extended over the entire observation area by the end of February. As early as mid-March (Fig. 2d) the ice edge moved eastwards again, reaching Storholmen in the second half of March. Remarkably, the inner southern part of the fjord became fast-ice free in May. By mid-June, only Dyrevika contained fast ice.
The complete observation area for ice extent (Fig. 1b) is 120 km2. This maximum was reached in all three years of observations (Fig. 4). The decay of fjord ice in 2003 stopped up at a level of about 70 km2 (late May/early June), before it continued further on in June. Similar decay scenarios can be seen in the 2004 and 2005 data but with intermediate stagnation levels at about 80 km2. As seen in the ice maps, the ice decay is strongly influenced by the Lovénøyane, and the plateau in the ice-extent vs time data series (Fig. 4) reflects this. These time series also show that ice once disconnected from shore (becoming pack ice, ranged in Fig. 4 in ‘other ice’) can stay for several weeks in the fjord (e.g. April 2005). In 2004, the entire observation area was covered with fast ice into late March. In 2005 too, the entire observation area was fast-ice covered for some time in March, but the ice decay went significantly faster in 2005 than in 2004. The final phases of the ice decay in 2003 and 2004 were similar.

Fig. 4. Ice extent vs time for 2003 (a), 2004 (b) and 2005 (c). Dates are dd/mm/yy.
Ice thickness, 2003–05
Snow- and ice-thickness data were obtained at four monitoring sites in inner Kongsfjorden (Table 1; Fig. 1b). In 2003, data could be collected only during two field campaigns in April and June. In 2004, measurements were extended for a brief period by adding a fifth site.
2003
Data are available only for two short (1 week) periods, one in late April, the other in early June. Repetitive measurements were carried out at four sites (Fig. 1). In the southern inner part of the fjord, ice thicknesses increased from 0.66 m to 0.70 m (site 1) and from 0.75 m to 0.83 m (site 2), with snow thicknesses decreasing from 0.13m to 0.03m (site 1) and 0.16m to 0.04m (site 2). In the northern inner part of the fjord, the ice thickness increased from 0.55m to 0.60m (site 3) and from 0.61 m to 0.70m (site 4), with corresponding snow-depth changes from 0.15 m to 0.04 m (site 3) and 0.19m to 0.04m (site 4). At site 4, the formation of superimposed ice at the surface could be followed during one week in early June, when most of the snow cover turned into ice.
2004
New sites were established at almost identical positions as for 2003 (see Table 1; Fig. 1b). For a short period (three observations), another site was established in the central part of the fjord. The thickness data monitoring started as early as January, and the last measurement was done in June. In January, the ice was already 0.50–0.56m thick, with a snow layer of 0.07–0.14m (Fig. 5a). As one would expect, snow and ice thickness exhibit an anticorrelation, with thickest ice occurring where snow depth is small. Ice thicknesses increased to the second half of March, when they reached 0.80–0.89 m. A final thickness increase could be observed in April, due to superimposed ice formation (Reference Gerland and HallGerland and Hall, 2006). The southern innermost location (site 2) exhibited the maximum thickness, with 1.03 m in early May. At site 5, in the central part of the fjord, ice formed later than in the inner part and was therefore thinner. Snow thickness vs time for the different sites is less in phase than ice thickness, probably due to local meteorological differences and connected snow and ice properties. Interestingly, the thickest ice was observed in sector 1, which is more exposed to wind, and snow is consequently more compact.

2005
In 2005, the ice was first accessible in late February, and the measurements had to be concluded by the end of April. In late February, the ice at the southern shore of Kongsfjorden was not thicker than 0.20 m, with no snow covering the ice. Substantial snow came first in April. The lack of snow resulted in relatively high ice-growth rates (Fig. 5b). Thickness data from March show thicker ice in the north (sites 3 and 4) than in the south (sites 1 and 2), indicating that ice developed first in the northern inner fjord parts. The maximum ice thicknesses that could be measured were not more than 0.63 m at sites 3 and 4 in mid-April.
Fast-ice mass
Fast-ice masses (Fig. 6) for the different sectors result in maximum totals of 8.52×10¹⁰ kg. In sector 3, ice thicknesses were only measured over a short period, so ice-mass data are only available for that period. However, the data for this sector indicate that the thinner ice in the central fjord also contributes significantly to the total ice mass, since it covers relatively large areas. The ice mass continuously increases over the season both in 2004 (Fig. 6a) and 2005 (Fig. 6b). Changes are stronger in the early parts of the seasons, due to faster vertical ice growth connected to lower temperatures, thinner ice and less snow. Probably, ice mass vs time would look less smooth if more data were available for sector 3. Most fast changes occur there during spring, as shown when discussing the ice maps (Fig. 2a–c). However, the calculation of ice masses makes it possible to quantify freshwater contributions, and unifies ice extent and thickness in a single parameter, which might be more suitable for interannual comparisons and for climate change studies.

Fig. 6. Time series of fast-ice mass in Kongsfjorden, derived from ice-thickness and ice-extent observations, for 2004 (a) and 2005 (b). Dates are dd/mm/yy.
Discussion
Factors affecting ice evolution and interannual variability
The temporal evolution of fast ice in the seasons 2003–05 clearly showed that, besides physical parameters, the coastline and islands in Kongsfjorden are crucial for the fast-ice extent. The fast-ice edge rarely extends further west than Brandalpynten, from where the fjord becomes wider in the westerly direction. In all years, the island Storfjorden kept the ice edge relatively constant over several weeks in spring. When moving on with the intention to link fast-ice evolution and climate variability, the characteristics in the setting of Kongsfjorden that are constant and climate-independent within reasonable timescales (coastline, islands, sea-floor topography) must be considered, as they bias the datasets.
Among the environmental and physical parameters that strongly influence the fast ice are air and sea-water temperature, solar radiation, wind speed and direction, and waves (swell). Cold air and water are an absolute necessity to produce sea ice. Solar radiation contributes later in the season to the heating of the snow and ice, and wind affects both the snow layer and ice. Waves are destructive for fragile (thin or old) ice. However, often it is a combination of parameters that results in ice formation or decay. Air-temperature daily means for Ny-Ålesund for the three years of investigation (Fig. 7) indicate that the 2005 season was milder than both 2003 and 2004. In 2003 and 2004, there was a cold period prior to March, with temperatures reaching –20˚C and colder, while in 2005 the cold period occurred later in the year and was of shorter duration. Ice thicknesses for the three seasons show a corresponding pattern, with thicker ice in 2003 and 2004 and thinner ice in 2005. Looking further back, area-averaged maximum ice thicknesses measured in Kongsfjorden during various process studies from 1997 to 2002 (and from the monitoring since 2003) exhibit a significant interannual variation, with a mean of 0.71 m; maximum snow thicknesses vary less strongly between years (Reference Gerland and HallGerland and Hall, 2006).

Fig. 7. Daily means of air temperature at Ny-Å lesund from the beginning of September 2002 to the end of August 2005. Dates are dd/mm/yy.
The second part of the fast-ice season’s ice-extent decay
looks similar for 2003 and 2004, but 2005 is very different, with an earlier ice-free fjord. Although in both 2004 and 2005 the fjord observation area was completely ice-covered for a period, in 2004 the ice consisted from the beginning of the observations entirely of fast ice. In 2005 this is the case for only a few weeks in late February to early March. Land observations of surface albedo and atmospheric and meteorological parameters from Ny-Ålesund from 1981 to 1997 (Reference Ørbæk, Hisdal and SvaasandØrbæk and others, 1999; Reference Winther, Godtliebsen, Gerland and IsachsenWinther and others, 2002) indicate a variability of melt onset within a month (early to late June). The sea-ice situation is more complex: The ice season is dependent on shorter periods or events. For a long fast-ice season, certain conditions are necessary early in the season, so that the ice situation in spring gives information on the preceding winter conditions. In that context, the sea ice is interesting for climate studies since it includes marine signals, something the terrestrial observations only marginally do.
Salt and fresh water
The dataset provides the opportunity to estimate the salt enrichment of surface water layers due to freezing processes, and the amount of fresh water that entrains into the fjord once the ice melts. At the transition May/June, a bulk ice salinity of fast ice can roughly be estimated to be 4 ppt, when only considering ‘primary’ formed sea ice (Reference Gerland, Haas, Nicolaus, Winther and WienckeGerland and others, 2004). Freeboard measurements (Reference Gerland and HallGerland and Hall, 2006), continuous snow-pit studies and oxygen isotope analysis from melted samples (T. Martma, unpublished data) showed that in addition to freezing at the ice underside, secondary ice-formation processes at the surface also contribute to the total ice thickness, adding ice with low or no salt content (Reference Gerland, Winther, Ørbæk and IvanovGerland and others, 1999, Reference Gerland, Haas, Nicolaus, Winther and Wiencke2004; Reference Nicolaus, Haas and BareissNicolaus and others, 2003; Gerland and Hall, 2006). Including this superimposed ice, the bulk salinity can become about 3–3.5 ppt, so a rough guess suggests that the salinity of the ice is only about 10% of the sea water it formed of (assuming a sea-water salinity of 33 ppt), and the calculated ice masses can be seen more or less completely as freshwater supply. Regarding the observation area, this would become for 2004 about 45×106m3 of fresh water. As the water in the fjord was enriched with salt during ice formation, the formation of sea ice results in a seasonal variation in surface water salinities. The magnitude of the freshwater input from melted sea ice in spring is of the same order of magnitude as glacier run-off during summer from Kongsvegen, one of the major glaciers terminating in Kongsfjorden (personal communication from J. Kohler, 2006). For the sea ice a portion may leave the fjord as drifting ice prior to melting, and this ice contributes to the water masses outside Kongsfjorden.
Conclusions
The three years with detailed fast-ice mass-balance observations, 2003–05, were very different, confirming earlier observed interannual variability in Kongsfjorden fast-ice thickness between 1997 and 2005 (Reference Gerland and HallGerland and Hall, 2006). However, the fixed geographical setting (coastline, islands) leads to a similar ice extent in spring (early May) for all years investigated. The protection by the Lovénøyane preserves the fast ice and thus makes it suitable for monitoring studies into spring.
The limited period of 3 years of monitoring is insufficient for thorough conclusions about the complete potential of Kongsfjorden fast-ice monitoring as a climate change identification tool. So far we can state and show that, as one would expect, Kongsfjorden fast ice is responding to changes in environmental conditions. In addition, the first years of monitoring give a baseline of current fast-ice scenarios at western Spitsbergen. With every new season added to the monitoring, the understanding of the ice formation and decay and the potential of the monitoring will increase.
This study is ongoing, and a major aim is to identify and quantify connections between the fast-ice evolution in Kongsfjorden and climate variability, in particular changes in water temperatures, ocean currents, air temperature, pressure, winds, precipitation and extreme weather events, while following fast-ice evolution scenarios over a longer (decadal) timescale. Changes in fast-ice properties, especially when combined with fast-ice results from other locations, may provide a relatively inexpensive way to monitor changes in the oceans and the atmosphere.
Kongsfjorden sea-ice monitoring is not only used for climate change research, it also contributes to past, ongoing and future process studies in many disciplines conducted in the international research bases at Ny-Ålesund. In the context of the International Polar Year (IPY) 2007–08, Kongsfjorden sea-ice monitoring will also contribute to international collaboration, where extensive fast-ice monitoring initiatives with site intercomparisons are planned both for the Arctic and Antarctic (The State of the Arctic Sea Ice Cover, Cluster No. 95; Antarctic Fast Ice Network ‘AFIN’ with Antarctic Sea Ice in the IPY, Cluster No. 141).
Postscript on 2006 Sea-Ice Season
At the time of writing, the 2006 sea-ice season at Kongsfjorden has just ended, being the season with the least and thinnest ice in the fjord observed in the last decade. Data are not completely processed and analyzed yet, so the year 2006 cannot be included in this paper. However, the extreme character of the 2006 scenario deserves mention, and here we summarize the most relevant facts in the context of this paper: In 2006, no drilling-based monitoring of ice thickness comparable with the measurements described in this paper was possible due to inaccessibility of the ice. The fjord was completely sea-ice-free by 10 May 2006. Thickest (drifting) ice with known origin as fast ice in the easternmost part of the fjord was found in a sheltered bay (Raudvika, north of Kronebreen) in early May with 0.40m thickness. Other sea ice was found south of Gerdøya, being on average 0.27 m thick. This recent season was accompanied by unusually high air temperatures during winter and spring on Svalbard.
Acknowledgements
We are grateful to the station personnel of the Sverdrup station in Ny-Ålesund, especially to the optical engineers C.-P. Nilsen and A. Bäcklund, for conducting fast-ice thickness measurements and ice observations on Kongsfjorden. The air-temperature data from Ny-Ålesund are collected by the Norwegian Polar Institute for the Meteorological Institute of Norway (met.no). We thank the reviewer D. K. Perovich and the associate editor A. Worby for constructive criticism. This study is funded by the Norwegian Polar Institute, and the writing of the manuscript was supported by an ACIA 2 (Arctic Climate Impact Assessment) project (2005), ‘Processing and archiving of long-term monitoring data of fast-ice thickness and ice distribution in Kongsfjorden’.


