


1 Introduction
As of 2022, the COVID-19 pandemic still poses a catastrophic threat to the world. Aside from potentially causing millions of deaths and severe illness, the pandemic is placing the global economy in peril. While there are a few existing studies on the effect of the COVID-19 pandemic on preferences, this study differs from the existing literature by attempting to identify the effect of prevalence rate of COVID-19 and expected income drop due to COVID-19.Footnote 1
The current research compares a wide range of preferences, including trust and trustworthiness, risk aversion, and patience (temporal discounting) before and after the onset of the COVID-19 outbreak in China. To this end, we compare the choices of subjects in two sets of incentivized online experiments using (mainly cross-sectional, but some longitudinal) samples drawn from residents across provinces in mainland China. The experiments were conducted before (Study 1, 2019/9–2019/12) and after (Study 2, early 2020/3) the COVID-19 outbreak. We measured trust and trustworthiness using a simplified trust game (Berg, et al., Reference Berg, Dickhaut and McCabe1995). In addition, we assessed the subjects’ risk attitudes and time preferences. We also collected a range of demographic information on factors such as gender, income, occupation, and location, which enable us to investigate whether the effects differ across groups with different socioeconomic status.
We first report the preferences elicited in study 1 and study 2. Then, we report within-subject analysis using a sub-sample of subjects who participated in both Study 1 and Study 2. To attempt to identify the effect of the COVID-19 outbreak on preferences, in Study 2, we use the variation in prevalence rate of COVID-19 across provinces, and we investigate its relationship with the preferences, and the effect of expected income drop due to COVID-19. Since the infection of COVID-19 can be viewed as random, the variation of prevalence rate and expected income change will allow us to identify the possible effects of COVID-19 on the preferences.
Trust and Trustworthiness. In the current study, we test two competing hypotheses on trust and trustworthiness. First, the COVID-19 can be viewed as a collective threat and the threat may enhance co-operation (Boyd & Richerson, Reference Boyd and Richerson2009; Brewer, Reference Brewer2004), and as such may enhance people’s trust and trustworthiness. We may consider the prevalence rate as a proxy of the magnitude of the threat. Accordingly, we hypothesize that subjects in provinces with higher prevalence rate would be more likely to be trusting and trustworthy. Second, the COVID-19 pandemic will induce a negative income shock whereby most people will expect their future income to decline, which may evoke more self-protective than prosocial behaviors, and hence leading to lower trust and trustworthiness. Thus, it is possible that subjects expecting a negative income shock (i.e., those expecting a lower income level or a drop in income) would be less likely to be trusting and trustworthy.Footnote 2 Note that trust and trustworthiness are two distinct types of social preference that differ from other measures of social preference such as altruism (which can be measured via a dictator game where the dictator decides the allocation of a fixed amount of money between himself/herself and the receiver); trusting another person involves risk that the trustee may take all profit and not reciprocate any. By contrast, trustworthiness measures the reciprocity tendency if one plays the role of the trustee.
Some studies have found that collective threats enhance in-group cohesion and cooperation, presumably because these behaviors can help groups to weather adversity and enhance their survival (Boyd & Richerson, Reference Boyd and Richerson2009; Brewer, Reference Brewer2004; for a review, see Cheon & Hong, Reference Cheon, Hong, Chiao, Li, Seligman and Turner2015). Consistently, a longitudinal study (Chan et al., Reference Chan, Wang, Zuo, Chiu, Liu, Yiu and Hong2021) has found that increases in national identification during COVID-19 outbreak in China brought about greater compliance to disease preventive behaviors. As such, we expect that the pandemic as a collective threat induces more pro-social behavior by enhancing in-group cohesion and cooperation in China. Therefore, this stream of research suggests that the participants in this study will display greater trust and trustworthiness after the onset of the COVID-19 pandemic in comparison to before. We use prevalence rate as a proxy on the magnitude of the collective threat. We hypothesize that the higher is the prevalence rate, the more likely subjects will be trusting and trustworthy.
In an experiment conducted in rural Thailand, Cassar et al. (Reference Cassar, Andrew and Carl2017) found that there were high levels of trust and trustworthiness after the 2004 tsunami.Footnote 3 They used satellite imagery to identify the tsunami-affected villages and then recruited participants based on their responses to questions about whether they or their household had suffered financial damage due to the tsunami, and whether any of their family members were injured or killed in the tsunami. However, they did not have data on the participants’ attitudes before the tsunami.
As noted, there could be an opposing influence as well. The COVID-19 pandemic will likely induce a negative income shock. In study 2, we measure people’s belief on the effect of COVID-19 on their income. We hypothesize that people who expect their future income to decline will be less prosocial, and hence less trusting and trustworthy.Footnote 4
In short, if the outbreak induces in-group cohesion, and this effect is higher than the effect of negative income shock, then we may observe more trust and trustworthiness.
Risk Aversion. Previous studies have shown that natural disasters led to increase in risk aversion. For example, Cameron and Sahah (2015) found that villagers who have experienced earthquakes or floods are more risk averse than those who have not had such an experience. Consistently, Cassar et al. (Reference Cassar, Andrew and Carl2017) also found high individual risk aversion among the victims after the 2004 tsunami. In an experiment conducted in Latin America, Van Den Berg et al. (Reference Van d, Marrit and Kees2009) found that experiencing natural shocks makes people more risk averse in both the short run and long run. Likewise, the COVID-19 pandemic may lead to an increase in risk aversion. The COVID-19 pandemic has clearly generated fear, and studies (e.g., Lerner & Keltner, Reference Lerner and Keltner2001) have shown that fear induces people to be more risk averse. Raghunathan and Pham (Reference Raghunathan and Pham1999) showed that anxious individuals were more likely to favor low-risk/low-reward options in gambles.
Alternatively, the COVID-19 outbreak may have induced people to become more risk taking. Bchir and Willinger (Reference Bchir and Willinger2013) found that in areas exposed to the risk of lahar flows, poor people were more risk seeking and more impatient than were those in unexposed areas. However, this effect was absent among high income individuals. Moreover, research has shown that bad moods can lead to more risk-taking behavior (Leith & Baumeister. Reference Leith and Baumeister1996). Given that the pandemic could depress people’s mood, people may become more risk seeking after the onset of the pandemic. Hanaoka et al. (Reference Hanaoka, Shigeoka and Watanabe2018) found that after the 2011 Great East Japan Earthquake, the subjects were more risk seeking. However, their survey did not cover social preferences and time preferences. In another study, Eckel et al. (Reference Eckel, Mahmoud and Rick2009) found that in a sample taken shortly after the event, female evacuees from Hurricane Katrina were more risk seeking, but the participants were mildly more risk averse a year later. In sum, the research on the effects of catastrophic events on risk aversion is inconclusive and seem hard to explain as they might be confounded with other variables such as government’s subsidies and aids.
In the current study, we argued that there are two possible aggravating effects of COVID-19 on risk aversion. First, the expected negative income shock (expecting a drop in income or a lower income level) may induce higher degree of risk aversion as these people need to prepare for the income drop. Thus, subjects with more pessimistic income expectations could be more risk averse. Second, the pandemic could induce fear, and focus on bad outcomes that may occur, and hence leading to more risk aversion. We may view the prevalence rate as a proxy for the fear. Thus, we hypothesize that subjects in provinces with higher prevalence rate will be more risk averse.
Temporal Discounting. Research suggests that negative affect, such as emotional distress and fear, can lead people to indulge their immediate impulses (Tice, et al., Reference Tice, Bratslavsky and Baumeister2001), while positive affect reduced people’s discount rates (Ifcher & Zarghamee, Reference Ifcher and Zarghamee2011). In a survey of Sri Lankan wage workers, Callen (Reference Callen2015) found that exposure to the Indian Ocean Earthquake tsunami increased the respondents’ patience, which was measured using consumption choice decisions. The author attributed the change to a change in preference, rather than to changes in the economic environment. Cassar et al. (Reference Cassar, Andrew and Carl2017) found that the subjects were less patient after the tsunami. Overall, the existing research on the effects of catastrophic events on patience is inconclusive and seem hard to explain.
In our view, the pandemic could induce two opposing tendencies on individuals’ time preference (Frederick et al. Reference Frederick, Loewenstein and O’donoghue2002), which refers to the preference for present utility over future utility. First, the COVID-19 outbreak may induce emotional distress and fear, and hence leading to lower patience (i.e., higher discount rate). Thus, subjects in provinces with higher prevalence rate could have higher discount rates. Second, the expected income drop due to COVID-19 may make people less impulsive (as they need to save more for the future) and more self-controlled (Ameriks et al., Reference Ameriks, Caplin, Leahy and Tyler2007; as they delay gratification of a smaller award sooner for a larger award later), hence leading to lower discount rate. Thus, subjects with an expected income drop or a lower expected income level could have lower discount rates.
Related literature on Effect of COVID-19 on Preferences. There is by now a small literature on the effect COVID-19 on preferences. A study closely related to our study is that of Hellman et al. (Reference Hellmann, Dorrough and Glöckner2021), which used dictator games to investigate prosocial behavior in Germany during the COVID-19 pandemic. They found that prosocial behavior increased when vulnerability of others to virus increased. This result suggests that trust and trustworthiness will likely be positively correlated with prevalence rate, which is consistent with our expectations.
In addition, three other studies have investigated effect of the outbreak on preferences using Chinese subjects, namely Bu et al. (Reference Bu, Hanspal, Liao and Liu2020), Lohmann et al. (Reference Lohmann, Gsottbauer, You and Kontoleon2020), and Shachat et al. (Reference Shachat, Walker and Wei2021). Shachat et al. (Reference Shachat, Walker and Wei2021) compared the pro-social behavior and risk taking of Wuhan university students before and after the outbreak. They used a trust game to measure trust and trustworthiness and found a decrease in trust post lockdown, while there was no significant effect on trustworthiness. By contrast, Lohmann et al. (Reference Lohmann, Gsottbauer, You and Kontoleon2020) conducted survey experiments on students of Renmin University in China before and after the outbreak and found no significant difference in trust. Both Shachat et al. and Lohmann et al. used random pairing of subjects from the same university, who share the same social identity and were aware of it; the degree of trust and trustworthiness among Wuhan university students (in-group members) might be higher than among strangers (out-group members). Bu et al. (Reference Bu, Hanspal, Liao and Liu2020) conducted a survey with graduate students at the Wuhan University of Science and Technology before and after the outbreak. They found that planned risk-taking (which refers to whether the subject plans to take more or less risk in the coming year compared to the last year) decreased. Shachat et al. (Reference Shachat, Walker and Wei2021) found lesser risk aversion after the outbreak. Lohmann et al. (Reference Lohmann, Gsottbauer, You and Kontoleon2020) found no significant effect. In short, the findings from these studies were mixed and inconclusive. The current study attempts to examine the issue using a sample beyond college students.
For studies conducted in other countries, there is mixed evidence on the effect of the COVID-19 pandemic on risk taking and time preference. Angrisani et al. (Reference Angrisani, Cipriani, Guarino, Kendall and Ortiz de Zarate2020) found no significant effect of the pandemic on risk taking and time preference with university students and professional traders in London. Drichoutis and Nayga (Reference Drichoutis and Nayga2021) found no significant effect on risk and time preference with undergraduates in Greece, while Harrison et al. (2020) found higher risk aversion but stable time preference with US undergraduate students. Glöckner et al. (Reference Glöckner, Dorrough, Wingen and Dohle2020) investigated perception of COVID-19 inflection risk during the early and later outbreak of COVID-19 in Germany. They found that risk perception change over time (inversed U-shape) with the development of the outbreak.
The current study differs from the above literature on the effect of COVID-19 on social preferences. First, regarding trust and trustworthiness, we are not aware of other studies except ours, Lohmann et al. (Reference Lohmann, Gsottbauer, You and Kontoleon2020), and Shachat et al. (2021) that used the trust game.Footnote 5 In comparison with Lohmann et al. (Reference Shachat, Walker and Wei2020), and Shachat et al. (Reference Shachat, Walker and Wei2021), our design has the advantage that subjects do not belong to the same school. Second, we measured the subjects’ expectations about the change in their own income, which allows us to test whether the differences observed in preferences were associated with perceived changes in income. To the best of our knowledge, this is the first study to examine the effects of a shock on people’s preferences that takes their expectations about income into account. Third, we investigate the correlations between disease prevalence with social preferences. Fourth, we include within-subject analysis with 54 subjects who participated in both study 1 and study 2. Although the size of this subsample is small, the results can be compared with those found in the large cross-sectional samples. Finally, our study includes subjects residing in different provinces in China, and is thus unlikely to be driven by location-specific factors.
The main findings can be summarized as follows. Taking together the results of the analyses, we found that after the COVID-19 outbreak, the subjects were more trustworthy than before the outbreak. There were mixed results on trusting in the comparison of study 1 and 2, and in the within-subject analysis. We found that trust and trustworthiness were positively correlated with the prevalence rate, a result consistent with the contention that collective threats enhance in-group cohesion and cooperation (Boyd & Richerson, Reference Boyd and Richerson2009; Chan et al., Reference Chan, Wang, Zuo, Chiu, Liu, Yiu and Hong2021; Brewer, Reference Brewer2004; Cheon & Hong, Reference Cheon, Hong, Chiao, Li, Seligman and Turner2015). We only found a significant negative correlation between trust and expected income drop (in 5 years), but no significant correlations between trust or trustworthiness and rank of expected income change (i.e., the expected income change relative to other subjects such that the lower the rank, the more pessimistic the expected income change).
We found that the subjects were more risk averse after the outbreak. In study 2, we found a positive correlation between degree of risk aversion and prevalence rate, possibly because fear make people more risk averse, although we did not measure participants’ fear directly. Further, as predicted, subjects with more pessimistic income expectation showed lower valuation in the risky lottery task, and were thus more risk averse.
The subjects had higher average discount rates after the outbreak, possibly because emotional distress reduces people’s self-control (Tice et al., Reference Tice, Bratslavsky and Baumeister2001) although we did not measure participants’ self-control directly. We also found a positive correlation between average discount rate and rank of expected income change. These results support our hypothesis that prevalence rate and expected income decline are two important channels affecting time preference.
The rest of this report is organized as follows. Section 2 reports the experimental design, and Section 3 reports the experimental results. Section 4 concludes.
2 Experimental Design
We conducted two online experiments across the 31 provinces in mainland China, one (Study 1) before the COVID-19 outbreak (2019/9–2019/12), and another (Study 2) after the COVID-19 outbreak (early 2020/3).
We used an online platform, and the subjects completed the survey experiments on their mobile phones. In addition, we collected a rich set of demographic information on the subjects including their gender, income, education, occupation, subjective socioeconomic status, location, and religiosity, with 696 (study 1) and 1176 (study 2) subjects participating in the experiment before the Covid-19 and after Covid-19, respectively.
Since subjects in Study 1 were between age 18–25, in the comparison of preferences between study 1 and 2, we used the sub-sample in study 2 with the same age range, which led to the sample size of 344 in study 2.Footnote 6,Footnote 7 The measures we are interested in are elicited in the same way in both studies. We take advantage of the fact that the preferences of interest are elicited using the same design in both studies to investigate the effect of the Covid-19 outbreak on preferences. To explore the potential mechanism underlying the effects of COVID-19 outbreak on the preferences, we investigate the relationship between the preferences elicited with prevalence rate of COVID-19 infection and expected income drop using the full sample of Study 2.
In both studies, the subjects received a participation fee of RMB 10, plus the payoff from one randomly drawn choice game (for 10% of participants).Footnote 8 The subjects were informed that their choices will remain anonymous and strictly confidential. The actual experimental instructions and measures can be found in the supplementary materials.
2.1 Trust and Trustworthiness
We used the simplified trust game (Berg et al., Reference Berg, Dickhaut and McCabe1995; Cox, Reference Cox2004; Sapienza et al., Reference Sapienza, Toldra-Simats and Zingales2013) to measure trust and trustworthiness (reciprocity). The game involves two players, Player A and Player B. Player A chooses either option 1 or 2, as shown in Figure 1. If she chooses 1, she will receive RMB 20 and Player B will receive nothing. If she chooses 2 (i.e., trusting), the payoff for both players will be determined by the choice of Player B, who can choose either 3 or 4. If Player B chooses 3 (i.e., trustworthy), both players will receive RMB 20. If Player B chooses 4 (i.e., not trustworthy), Player B will receive RMB 40 while Player A will receive nothing. In the study, the subjects first played as Player A with an anonymous participant as Player B, and then they played as Player B with another anonymous participant as Player A, and their choices were implemented according to the role drawn. Subjects first played the role of A, without knowing that they will be asked to play the role of B at that point. Note that in our design, player A will not gain additional monetary payoff by trusting. Hence, it is a measure of “pure” trust. In this design, a subject who is trusting is not taking a risk in order to get a higher payoff for himself/herself.
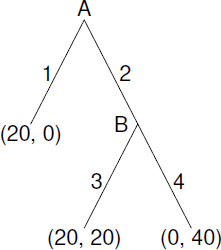
Figure 1: Simplified trust game.
2.2 Risk Attitudes
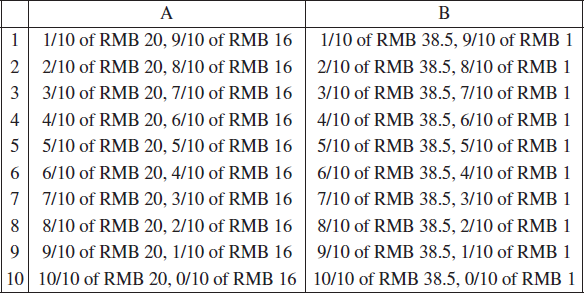
We used the design of Reference Holt and LauryHolt and Laury (2002) to elicit the subject’s degree of risk aversion. The subjects indicated their choice between options A and B in each of the following pairs of options. Then, we estimate the degree of risk aversion by assuming a constant relative risk aversion utility function. For the subjects who switched more than once in their choices, we use the last switch point to determine the degree of risk aversion.
2.3 Temporal Discounting (Impatience)
In both studies, we used two sets of choice tasks to elicit the subjects’ time preference. In the first set (for eliciting Discount Rate 1), the subjects chose between receiving RMB x (ranging from RMB 10 to RMB 35) today or a higher amount (RMB 40) in one month. In the second set (for eliciting Discount Rate 2), the subjects chose between receiving RMB x (ranging from RMB 10 to RMB 35) in six months or a higher amount (RMB 40) in seven months, as shown below. We then estimate the implied Discount Rate 1 and Discount Rate 2 from the choices in the respective sets. We also calculate present bias by computing the difference between discount Rate 1 and discount Rate 2.

2.4 Expected Income Change
In Study 2, we elicited subjects’ beliefs on the effect of COVID-19 outbreak on their income in 2020, and in 5 years’ time. Subjects indicated the effect in percentage terms by inputting their expected percentage change in income, with a “-” sign if they expected income to drop. Participants’ responses were coded in two ways. First, we calculated subjects’ rank of expected income change by computing a ranking of the expected income change relative to other participants. Ranking avoids the problem of outliers (which were extensive). The lower the rank, the more pessimistic the expected income change. Second, we computed expected income drop by creating a dummy code that equals 1 if the subject believes their income to drop and 0 if otherwise. As such, the rank of expected income change is a continuous variable, whereas the expected income drop is a categorical variable. Rank of expected income change and expected income drop were in opposite direction.
2.5 Prevalence Rate
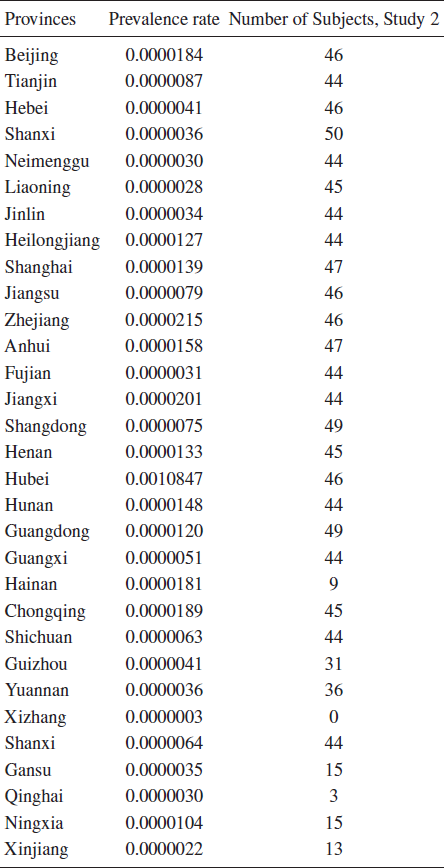
We use the prevalence rate (as of Feb. 23, 2020) of COVID-19 at the provincial level for our analysis. Appendix A shows the prevalence rate and number of participants in each province.
3 Experimental Results
We first report the comparison of preferences in Studies 1 and 2 in section 3.1. Then, we report the within-subject analysis in Section 3.2. In Section 3.3, we report the effects of prevalence rate and the effects of expected income change on the preferences.
3.1 Comparison of Study 1 and Study 2
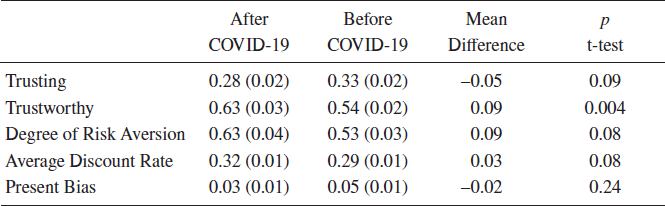
Table 1 reports a summary of the elicited preferences before and after the COVID-19 outbreak based on the sub-sample of subjects age between 18-25.
Table 1: Summary Statistics. Trusting refers to the proportion of trusting subjects in the simplified trust game. Trustworthy refers to the proportion of trustworthy subjects in the simplified trust game. Standard error in parentheses.
3.1.1 Trust and Trustworthiness
Before the COVID-19 outbreak, 33% of the subjects were trusting, but the percentage decreased to 28% after the outbreak. The difference is not significant with a p of 0.09 (larger than the conventional p<.05 criterion) under the two-sample test of proportions; see Table 1.
Regarding trustworthiness, we found that the subjects were more trustworthy after the outbreak. In particular, 63% of the subjects were trustworthy after the outbreak, which was significantly higher than the 54% observed before the outbreak. The difference is significant with a p of 0.004 under the two-sample test of proportions, see Table 1.
3.1.2 Risk Aversion
Before the outbreak, the average degree of risk aversion was 0.53 which was lower than the average degree of risk aversion (0.63) after the onset of the outbreak (p=0.08, two-sample t-test). Before the outbreak, the proportion of risk averse subjects was 58%, but it increased to 66% after the outbreak.Footnote 9 The difference is significant (p=0.02, two-sample test of proportions). Subjects appeared to be more risk averse after the onset of the outbreak.
3.1.3 Time Preference
The subjects appeared to be less patient after the outbreak. For the rest of the analysis, we take the average of the two discount rates, which has the correlation coefficient equals 0.58 (p=0.00). We found that the average discount rate was 0.32 after onset of the outbreak which is almost significantly higher than 0.29 before the outbreak (p=0.08, two-sample t-test). The average degree of present bias before the outbreak was 0.05, which is significantly different from zero (p=0.00). The average degree of present bias after the outbreak was 0.03, which is also significantly different from zero p=0.04). There is no significant difference on degree of present bias before and after the onset of the outbreak (p =0.24, two-sample t-test).
3.1.4 Comparison of Full Sample of Study 1 and 2
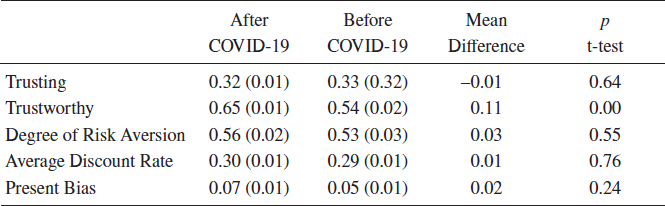
Table 2 reports the comparison of means of the preferences using full samples of Study 1 (n=696) and Study 2 (n=1176). We found that subjects were significantly more trustworthy after the onset of the COVID-19 outbreak, while there were no significant differences for trusting, degree of risk aversion, and average discount rate.
Table 2: Summary Statistics (Full Sample of Study 1 and Study 2). Trusting refers to the proportion of trusting subjects in the simplified trust game. Trustworthy refers to the proportion of trustworthy subjects in the simplified trust game. Standard error in parentheses.
Result 1: Subjects are more trustworthy after the COVID-19 onset.
3.2 Within-subject Analysis
In our study, 54 subjects participated in both Study 1 and Study 2. Despite the small sample size, we can conduct a within-subject analysis of the preferences of the same people before and after the outbreak.
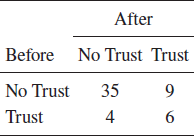
Regarding trust, 10 subjects were trusting before the outbreak, while 15 subjects were trusting after the outbreak (Table 3). The difference is not significant (p=0.17).
Table 3: Number of Trusting Subjects Before and After the Outbreak
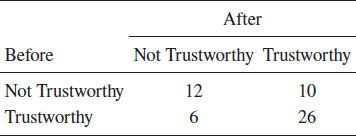
Before the outbreak, 32 out of 54 subjects were trustworthy, while 36 out of 54 subjects were trustworthy after the onset of the outbreak (Table 4). We found that 10 out of 22 subjects switched from being not trustworthy before the outbreak to being trustworthy after the outbreak, which was significantly higher than the proportion (6 out of 32) of subjects who switched from being trustworthy before the outbreak to not trustworthy after the outbreak (p=0.03 for the difference in proportions).
Table 4: Number of Trustworthy Subjects Before and After the Outbreak
Regarding risk aversion, the average degree of risk aversion before the outbreak was 0.33, which is not significantly different from 0.36 after the outbreak.
There was no significant difference between the average discount rate before (0.29) the outbreak and after (0.23) the onset of the outbreak (p=0.10, paired t-test). There was no significant difference between the average degree of present bias before (–0.004) and after (0.002) the outbreak either (p=0.88, paired t-test)
Given the small sample size, the results of the within-subject analysis should be interpreted with caution. If anything, this small subsample of participants seems to become more trustworthy after the onset of COVID-19, which is consistent with that found in the cross-sectional samples. There were no other obvious social preference changes.
3.3 Associations between Preferences and Prevalence Rate and Expected Income Change
Previous sections focused on comparing the change in social preferences before and after the onset of the pandemic. In this section, we tested our hypotheses regarding how disease prevalence and expected income change were associated with individuals’ social preferences. To this end, we conducted cross-sectional analysis of the full sample of study 2 (1176 subjects).
3.3.1 Trust and Trustworthiness
Table 5 reports the correlations between elicited preferences, prevalence rate of the provinces, and four different measures of expected income change.Footnote 10 We find no significant correlations between prevalence rate and trust and trustworthiness, with ps of 0.16, and 0.36 under point biserial correlation, respectively, for the full sample, ignoring the fact that provinces differ in both prevalence rate and number of subjects. However, we find that after adjusting standard errors in the province level in the regression in Table 6, there are significant correlations between trust and trustworthiness with prevalence rate. More specifically, Column 1 of Table 6 reports the univariate probit regression on the marginal effect of prevalence rate on trust where standard errors are clustered at province level. The coefficient on prevalence rate is significantly positive with a p equal to 0.00, indicating that higher prevalence rate was associated with more trusting. Column 2 of the same table reports the probit regression on the marginal effect of prevalence rate on trustworthiness. Likewise, the coefficient on prevalence rate is significantly positive with a p equal to 0.00, suggesting that higher prevalence rate was associated with higher trustworthiness. These results support the hypothesis that collective threat enhances cooperation (Boyd & Richerson, Reference Boyd and Richerson2009; Brewer, Reference Brewer2004). Since the prevalence rates are at the provincial level and the social preferences are at the individual level, we have also conducted a sensitivity analysis using mixed-effects linear regression and the results (available upon request) are consistent with those reported in Table 6.
Table 5: Correlations between prevalence rate, expected income change, and preferences for the sample collected in Study 2.
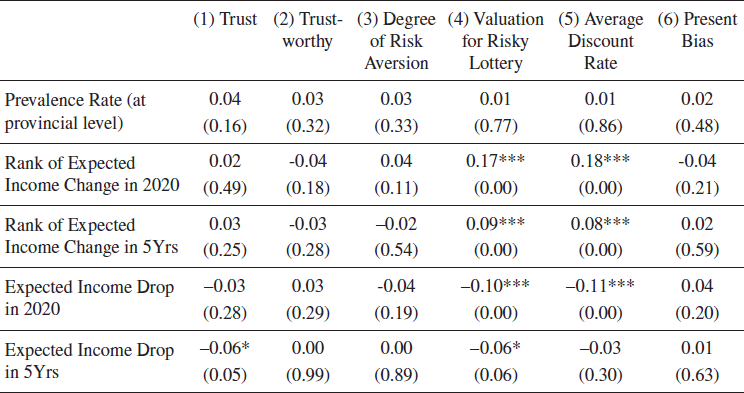
Notes: The correlations with trust and trustworthy are based on point biserial correlation, while the others are based on Pearson’s correlation. ps in parentheses. *, **, and *** denote significance at the 10%, 5%, and 1% levels, respectively.
Table 6: Effects of the prevalence rate on preferences for the sample collected in Study 2.
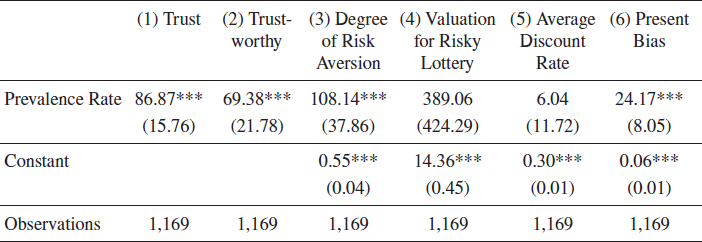
Notes: Column 1 reports the marginal effect estimates of probit regressions in which the dependent variable is trust. Column 2 reports the marginal effect estimates of a probit regression in which the dependent variable is trustworthiness. Column 3 reports the OLS regressions in which the dependent variable is degree of risk aversion. Column 4 reports the OLS regression in which the dependent variable is valuation for risky lottery. Column 5 reports the OLS regression in which the dependent variable is average discount rate. Column 6 reports the OLS regression in which the dependent variable is degree of present bias. Standard error in parentheses. *, **, and *** denote significance at the 10%, 5%, and 1% levels, respectively.
The correlations between trusting and rank of expected income change in 2020 and in 5 years are both positive but not significant. There is a negative correlation between expected income drop in 5 Years (a dummy that equals 1 if the subject believes that the outbreak will have a negative effect on her income in the coming 5 years, and 0 otherwise) and trusting, with p=0.05.Footnote 11
Column 2 of Table 5 shows that there is no significant correlation between trustworthiness and rank of expected income change or expected income drop in 2020 or in 5 years. This result suggests that the expected income change does not have a significant effect in trustworthiness.
Result 2: Trust and trustworthiness are positively correlated with prevalence rate of COVID-19 infection. There is no significant correlation between trustworthiness and expected income change.
3.3.2 Risk Aversion
Column 3 of Table 5 reports the correlation between degree of risk aversion and prevalence rate. There is no significant correlation. However, the regression result on Column 3 of Table 6 shows that there is a significantly positive correlation when standard errors are clustered at the provincial level.Footnote 12 This result was consistent with the speculation that the pandemic induced fear, leading to more risk aversion, despite our failure to measure fear directly.
In Study 2, we also elicited subject’s valuation for a risky gamble which has 50% chance of receiving RMB 30, zero otherwise. In this design, a higher valuation means lower degree of risk aversion. Column 4 of Table 5 shows significant positive correlations between valuation for the risky lottery and rank of expected income change, and a significant negative correlation with expected income drop in 2020, implying that the subjects with more pessimistic income expectation was more risk averse. This supports our hypothesis on the effect of expected income drop on risk aversion.
Result 3: Subjects are more risk averse when the prevalence rate is higher. Subjects with more pessimistic income expectation are more risk averse.
3.3.3 Time Preference
There are significant positive correlations between rank of expected income change in 2020 and in 5 years with the average discount rate. There is a significant negative correlation between expected income drop in 2020 and the average discount rate. In short, the more pessimistic the participants’ expected income changes due to COVID-19, the less impulsive they showed in terms of lower discount rate.Footnote 13 We do not observe significant correlations between prevalence rate and the expected income changes.
We measure degree of present bias by computing the difference between discount rate 1 and discount rate 2. Column 6 of Table 6 shows that there is a significant positive correlation between degree of present bias and prevalence rate. This result is consistent with the contention that emotional distress can make people more impulsive (Tice et al., Reference Tice, Bratslavsky and Baumeister2001) although we did not measure emotional distress directly. We do not find significant correlations between degree of present bias and expected income changes.
Result 4: Subjects with more pessimistic expectation on income change have lower discount rate. Subjects in provinces with higher prevalence rate have higher degree of present bias.
4 Conclusion
The outbreak of COVID-19 has had unprecedented impacts on countries around the world. This study compares people’s social preferences, risk attitudes, and patience before and after the onset of the COVID-19 pandemic. We conducted online experiments with subjects across 31 provinces in mainland China before and after the outbreak. A unique feature of our experiment is that we collect the subjects’ expectations about how the outbreak will affect their income, which permits us to investigate whether the differences in the preferences are correlated with the subjects’ expectations about the expected income change due to COVID-19. Another feature is that we investigate the associations between preferences and prevalence rate of COVID-19 infection.
We find that after the onset of the COVID-19 outbreak, the subjects are more trustworthy in comparison to before the outbreak. There are mixed results on trusting in the comparison of Study 1 and 2, and in the within-subject analysis. We identify two channels affecting trust and trustworthiness. We show that trust and trustworthiness are positively correlated with the prevalence rate. The increase in trust and trustworthiness with prevalence rate is consistent with the hypothesis that collective threats enhance in-group cohesion and cooperation (Boyd & Richerson, Reference Boyd and Richerson2009; Chan et al., Reference Chan, Wang, Zuo, Chiu, Liu, Yiu and Hong2021; Brewer, Reference Brewer2004; Cheon & Hong, Reference Cheon, Hong, Chiao, Li, Seligman and Turner2015).
We find that the subjects are more risk averse after the outbreak. In study 2, there is a positive correlation between degree of risk aversion and prevalence rate, supporting the contention that fear induces people to be more risk averse. We also find that subjects with more pessimistic expected income tend to have lower valuation for risky lottery, consistent with the speculation that more pessimistic income expectation is associated with higher risk aversion.
Subjects had higher average discount rate after the outbreak, supporting the speculation that emotional distress can make people more impulsive (Tice et al., Reference Tice, Bratslavsky and Baumeister2001) although we did not measure emotional distress directly. There is also a significant positive correlation between average discount rate and rank of expected income change. That is, the more pessimistic the subjects expect their income change, the more patient they were. Taken together, these results support our hypothesis that prevalence rate and expected income are two important channels affecting time preference.
Our study raises some interesting questions that warrant further research. Study 2 was conducted in March 2020 during the peak of the coronavirus outbreak in China; other countries were also experiencing surges in coronavirus cases at that time. An interesting question for future research is whether the preferences return to their pre-shock levels when everything returns to normal. Our analysis suggests this is likely, as the preferences are sensitive to the expectation of an income change, and thus the preferences may revert to their earlier state when the economy is back to normal (unless people’s outlook for the post-COVID economy remains pessimistic). Another interesting question is whether the changes in preferences induce changes in behavior, such as consumption and saving. Li and Huang (Reference Li and Huang2020) show that ambiguity averse subjects are more likely to reduce their consumption and save more due to the COVID-19 outbreak. Moreover, Gallagher (Reference Gallagher2014) finds that insurance take-up spikes the year after a flood and then steadily declines to baseline, which suggests a possible path for the impact of COVID-19. However, given the huge differences in the impacts of flooding and COVID-19, it is unclear whether this will be the case. Thus, future research may examine whether the COVID-19 shock has long-term impacts on preferences and real-life decisions such as to consume or save.
Appendix A. Prevalence Rate by Province
Appendix B. Social Distancing
We also investigate the correlations between social contact with the subjects’ preferences. We use two large mobility datasets (Huang et al., Reference Huang, Wang, Cai, Yao, Chan, Tam, Hong, Ruktanonchai, Carioli, Floyd, Ruktanonchai, Yang, Li, Tatem and Lai2021) drawn from anonymized mobile phone records.
In the absence of effective vaccines, social distancing interventions, such as stay-at-home decrees and school closures, have proven to be critical for delaying and containing the COVID-19 pandemic (Ferguson et al., Reference Ferguson, Laydon, Nedjati Gilani, Imai, Ainslie, Baguelin, Bhatia, Boonyasiri, Cucunuba Perez, Cuomo-Dannenburg, Dighe, Dorigatti, Fu, Gaythorpe, Green, Hamlet, Hinsley, Okell, Van Elsland, Thompson, Verity, Volz, Wang, Wang, Walker, Winskill, Whittaker, Donnelly, Riley and Ghani2020; Tian et al., Reference Tian, Liu, Li, Wu, Chen, Kraemer, Li, Cai, Xu, Yang, Wang, Yang, Cui, Song, Zheng, Wang, Bjornstad, Yang, Grenfell, Pybus and Dye2020). These measures aim to maintain physical distance between people, thereby reducing the number of times people come into close contact with each other (Zhang et al., Reference Zhang, Litvinova, Liang, Wang, Wang, Zhao, Wu, Merler, Viboud, Vespignani, Ajelli and Yu2020; Huang et al., Reference Huang, Wang, Cai, Yao, Chan, Tam, Hong, Ruktanonchai, Carioli, Floyd, Ruktanonchai, Yang, Li, Tatem and Lai2021). However, reducing social interactions can cause psychological problems. Brooks et al. (Reference Brooks, Webster, Smith, Wessely, Greenberg and Rubin2020) provide a comprehensive review of the research on the psychological outcomes resulting from quarantine, an extreme form of social distancing, during outbreaks of SARS, H1N1 flu, Ebola, and other infectious diseases since the early 2000s. Nevertheless, there is limited research on the effect of social contact resulting from social distancing regulations on social behavior and attitudes, which is a significant social issue.
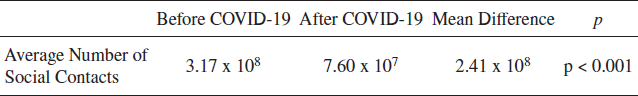
The numbers of social contact before and after the outbreak of COVID-19 are obtained from two large mobility datasets derived from anonymized mobile phone records: one consists of the daily average over a regular week in all provinces in China before COVID-19 and the other consists of the daily average after the outbreak of COVID-19, see Table S1. The national average number of social contacts, in natural logarithmic form, after the outbreak (during the lockdown period) is 16.81, which is significantly lower than the 18.48 contacts before the outbreak, with a p of 0.00. We then check whether our variables of interest are correlated with the change in number of social contacts before and after the outbreak. We find that the preferences are not correlated with the change in number of social contacts. This may be due to the fact people can still connect with others using alternative methods of communication, such as social media.
Table S1. Average number of social contacts.


 Open access