


Social media is a major platform that people use to consume, share, and discuss information about scientific innovations and controversies (Brossard & Scheufele, Reference Brossard and Scheufele2013). Around one in five U.S. adults use Twitter, and 42% of those use it to discuss politics (Hughes & Wojcik, Reference Hughes and Wojcik2019). Twitter has become a popular research site in recent years for studying issues at the intersection of the (life) sciences, politics, and policymaking. Many interesting problems have been investigated using Twitter data. For example, scholars have examined Twitter discourses on contentious science topics such as genetic modification technology (Singh et al., Reference Singh, Bansal, Bode, Budak, Chi, Kawintiranon, Padden, Vanarsdall, Vraga and Wang2020; Wang & Guo, Reference Wang and Guo2018) and the Zika virus (Wirz et al., Reference Wirz, Xenos, Brossard, Scheufele, Chung and Massarani2018).
Beyond providing a lens into public discourse, Twitter data allow researchers to investigate how such discourse is affected by political ideology, the rural-urban divide, and education levels across regions in the United States (Wirz et al., Reference Wirz, Howell, Brossard, Xenos and Scheufele2021). Twitter has also been used to study public health issues such as allergies, obesity, and insomnia; to track illness and risk behavior (Paul & Dredze, Reference Paul and Dredze2011); to monitor public perceptions of the H1NA pandemic (Chew & Eysenbach, Reference Chew and Eysenbach2010); and to communicate public health information (Vance et al., Reference Vance, Howe and Dellavalle2009). In addition, Twitter has emerged as a battleground for politicians to promote agendas on science controversies and blame other political entities for public health issues. Scholars have shown that Twitter is an active platform that nongovernmental organizations and politicians use to shape public perceptions about climate change (Fownes et al., Reference Fownes, Yu and Margolin2018). During the COVID-19 pandemic, scholars found that the “China virus” stigma was perpetuated through Twitter (Budhwani & Sun, Reference Budhwani and Sun2020). These important scholarly works demonstrate the promise of using Twitter data for biopolitical research.
For biopolitical research, Twitter data are attractive because they are particularly multilevel and multifaceted. The most common data type is tweet content. Plain tweet text provides researchers with rich information, such as the distribution of sentiments and topics (Cody et al., Reference Cody, Reagan, Mitchell, Dodds and Danforth2015; Haunschild et al., Reference Haunschild, Leydesdorff, Bornmann, Hellsten and Marx2019; Walter et al., Reference Walter, Ophir and Jamieson2020), personality traits or other individual characteristics (Whittingham et al., Reference Whittingham, Boecker and Grygorczyk2020), and information-sharing behaviors (Singh et al., Reference Singh, Bansal, Bode, Budak, Chi, Kawintiranon, Padden, Vanarsdall, Vraga and Wang2020). URLs (uniform resource locators) and mentions/retweets embedded in tweets are also essential to a variety of research questions, such as which external articles or websites people prefer to share, how people connect virtually (Ke et al., Reference Ke, Ahn and Sugimoto2017), and how false news spreads on social media (Vosoughi et al., Reference Vosoughi, Roy and Aral2018). Analyzing Twitter images and videos might require different computational skills than analyzing plain tweets. Still, it could provide additional information for researchers, some critical for understanding how media biases are manifest in visual portrayals of politicians (Peng, Reference Peng2018). A relatively small number of biopolitical studies have focused on visualization cues on Twitter, opening yet another promising avenue for future exploration (Peng, Reference Peng2018).
This article explicates how researchers can get started using Twitter for research by discussing (1) the main ways to access and collect Twitter data, (2) the financial costs and skill sets needed, and (3) data quality issues. It also includes an empirical demonstration to assess data quality from different tools that researchers can use to collect Twitter data. Finally, this article alerts researchers to recent developments in Twitter’s move to API version 2 (V2), which includes a dedicated Academic Research track. Overall, this article demonstrates the utility of Twitter data as a resource for research but also notes important considerations about Twitter as research data.
Tools, costs, and skill sets
This section first introduces two major ways for researchers to get started with Twitter data collection. These methods can satisfy most research needs. such as estimating the prevalence, temporal trajectory, or geographic distribution of content features (e.g., topics or sentiments). We then review the financial resources and skill sets needed when using these data collection methods. We end this section by introducing Twitter full-archive access, which is crucial to answering certain research questions but can be inaccessible to some researchers.
Tools: Major ways to access Twitter data
Twitter’s standard APIs. Twitter’s standard application programming interfaces (APIs) are the most common entry points to Twitter data. Twitter provides a series of publicly available APIs that offer free but restricted access to data. The Streaming API and the Search API are two of them. Drawing from Twitter’s official guideFootnote 1 and other research (Driscoll & Walker, Reference Driscoll and Walker2014; Kim et al., Reference Kim, Nordgren and Emery2020), we summarize the main features of and differences between these two APIs for research.
The Streaming API is designed to return tweets in a real-time stream. Two options are currently available: filtered stream and sampled stream. The filtered stream enables researchers to screen millions of new tweets in any given second and extract only those matching a specific set of filter rules (e.g., up to 400 key words, 5,000 user identities [IDs], and 25 locations). By default, the filtered stream returns 1% of tweets per hour. If the researcher wants to use the filtered Streaming API to collect all tweets with the hashtag #TwitterAPI, for example, and there are fewer matched tweets than the allowed cap, the researcher will obtain all tweets containing that hashtag; otherwise, the researcher will receive a sample of the #TwitterAPI tweets.
In comparison, the sampled stream is designed to return a likely random selection of all newly posted tweets (Pfeffer et al., Reference Pfeffer, Mayer and Morstatter2018) in real time that are free from filtering constraints. Researchers who have specific topics to collect are better served using the filtered stream. When researchers do not have a specific research topic in mind and are interested in taking the temperature of all conversations occurring on Twitter for general monitoring purposes, the sampled stream is a better tool to use.
The Search API is another popular entry point for accessing Twitter data. It was designed to return historical tweets collected by matching rules defined by users. The standard Search API enables researchers to access at no cost a sample of tweets published in the past seven days. For researchers who only need the past seven days of Twitter data or who are willing to collect tweets every seven days to trace historical data, the standard Search API may be a good choice. If the research project needs historical tweets posted over a longer period and/or beyond the free-tier sampling rate, one would need to use paid premium plans of Twitter’s Search API. As discussed later, two premium-level Search API products allow backtracking of tweets for a longer period (e.g., past 30 days) or tracing historical data back as far as 2006.
Third-party platforms. Researchers interested in other more user-friendly but costly access points can use third-party platforms. The market for social media data vendors has been growing rapidly, offering an alternative way for researchers to access social media data, including Twitter (see Figure 1). Examples such as Salesforce Social Studio, Crimson Hexagon, and Synthesio differ considerably in their pricing structure, data access type and cap, dashboard and interface, availability of historic search, and data output. A typical Twitter data output from these third-party platforms (see Figure 2) consists of several data fields, such as time stamp, tweet URLs, publisher names and handles, tweet content, location, language, and even a basic sentiment score calculated by the platform.

Figure 1. Example of a dashboard layout of a third-party platform.

Figure 2. Example of data output from a third-party platform (not limited to the selected columns).
Note: other third-party platforms might give a different output.
Compared with Twitter’s APIs, these third-party platforms provide a user-friendly dashboard to organize search term setup, data filtering and download, and summary reports, hence requiring a less steep learning curve, especially for those unfamiliar with the API language. Some of these platforms also provide access to other popular social media sites, including public accounts on Facebook, Instagram, and YouTube, as well as online news websites and discussion forums. Typically, researchers can filter on language, time period, location, and source, although the availability of such parameters varies from platform to platform. Importantly, it is rare for third-party platforms to offer unlimited access. Some may place a cap on the maximum return of mentions per query without limiting the total daily queries allowed to run (e.g., 50,000 mentions per search), others may impose a monthly cap (e.g., three million), and still others may restrict how far back in time researchers can search (e.g., one to three years). These varying restrictions impact data quality and should be scrutinized before subscribing.
Shared tweet IDs. Using tweet IDs shared by other researchers is another way to collect Twitter data besides using APIs or purchasing third-party services. Researchers sometimes share metadata in the spirit of open science (Dienlin et al., Reference Dienlin, Johannes, Bowman, Masur, Engesser, Kümpel, Lukito, Bier, Zhang, Johnson, Huskey, Schneider, Breuer, Parry, Vermeulen, Fisher, Banks, Weber, Ellis and de Vreese2021) or for other purposes. One of the data sets used in the empirical analysis here (Jiang et al., Reference Jiang, Chen, Yan, Lerman and Ferrara2020) was collected using this method. Publicly released Twitter data sets that comply with Twitter’s terms of service can be found at specialized websites such as DocNow Catalog (Reference Catalogn.d.). Using tweet IDs, one can relatively easily “rehydrate” back into full tweets using tools such as rehydratoR (Coakley & Steinert-Threlkeld, Reference Coakley and Steinert-Threlkeldn.d.) or packages such as rtweet (Kearney et al., Reference Kearney, Heiss and Briatten.d.).
Financial costs
Twitter’s standard APIs. Standard APIs under version 1.1 (V1.1) allow researchers to collect a small sample of tweets and associated metadata for free. They are good choices for pilot-testing initial research ideas. Researchers can search tweets for the past seven days with desired filtering and sampling and interact with the Twitter platform at no cost. If a researcher is primarily interested in gathering a random sample of topic-matched or general Twitter discourses, the standard APIs are probably sufficient as long as the researcher has the skills to set up the API connection to cover the required time period. However, researchers who need longer historical coverage or higher sampling density beyond the free standard APIs will need to switch to a premium subscription, which allows researchers to collect full-archive tweet data with a current monthly cap of 1.25 million. The current pricing for premium Search Twitter APIs ranges from $149 to $2,499 per month, depending on the types of features and the level of access needed (see Table 1).
Table 1. Financial costs of different data collection circumstances.

Third-party access. Based on our own research on several popular third-party platforms on the market, the subscription costs of third-party platforms vary considerably, ranging from $7,000 to $50,000 for an annual contract based on quotes received in 2019. It is important to compare multiple platforms and closely examine data availability and cost structure, including, but not limited to, how the maximum cap is placed, whether the number of topics is restricted, historical data access, coverage of social media sources, user access authorization, and data output. For example, some platforms might not be able to provide a tweet’s original ID, making it hard for researchers to further extract profile information and other metadata about a matched tweet. Or a platform might claim that overall data access is unlimited but still impose a daily cap on the total number of mentions allowed to output. Some platforms charge by the number of topics to be examined, offering access to three years of historical data and allowing separate dashboards for different users on the same research team. Other platforms charge by a monthly maximum, going back to when Twitter was founded and requiring team members to share the same dashboard. Most platforms cover data from the big four social media websites (Facebook, Twitter, Instagram, and YouTube) plus some online news websites. Some also cover foreign social media sites such as China’s Weibo. It is useful to request a demonstration from a sales representative, download a sample data output, and examine whether all the required information is available.
Skill sets
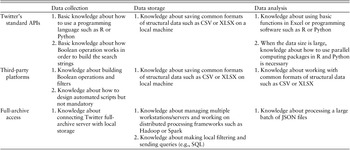
Twitter’s standard APIs. As indicated in Table 2, several technical skills are necessary for using the standard APIs for data collection, storage, and analysis. To collect tweets through standard APIs, researchers need some basic knowledge about a data science programming language such as R or Python. That fundamental knowledge will allow researchers to employ several useful open-source packages available in R or Python to access Twitter’s APIs, such as twitteR (Gentry, Reference Gentryn.d.), python-twitter (Python-Twitter Developers, n.d.), and tweepy (Roesslein, Reference Roessleinn.d.). There are many useful online tutorials that teach researchers how to use these tools, though it can take a few weeks of intensive study to grasp these off-the-shelf packages without diving into the technical details of these programming languages. Additionally, researchers need to understand Boolean operation, which is necessary to build search queries. Once the search query is developed and activated to start data collection, researchers also must be able to debug their code to address error messages. For instance, errors such as a broken connection or reaching an API quota might occur. Researchers need to understand these messages or patiently access the resources available to understand them in order to write code to fix the errors. Pilot tests are often an effective way to identify where and when the codes might break.
Table 2. Skill sets required for using various Twitter tools.

Regarding data storage and data analysis, researchers can often process up to several million tweets on a single updated laptop as long as the analytical strategy allows processing tweets sequentially in batches. Researchers can store their raw tweets spread across several files based on day or hour. While the data can be slowly analyzed in this basic form, to analyze these files more quickly, researchers can use “embarrassingly parallel”Footnote 2 programming in R or Python to examine each file separately if the job of each file is independent of the others (i.e., the result of one file does not need to be finished in order to serve as the input to the next file).
Third-party access. Third-party platforms with well-organized query structures and interactive interfaces can relieve researchers from massive programming work but still require some basic technical skills. Resources for researchers regarding platform functionality are generally available through reviewing official instruction manuals, watching video tutorials, and consulting technical support teams.
Researchers should be aware of platform policies and limits while designing a project. Policies refers to the platform-imposed rules that specify ways to extract matched tweets, available Boolean operations to support query construction, and format and size to standardize data export. It is common for platforms to implement their own policies to keep services consistent across customers. Common caps include data rates, data volume per request, request cap for a period, and request length. All of these can affect data quality as well as researchers’ time and computational resources requirements. It is worth noting that automation scripts (e.g., Selenium) can reduce time and resource burdens.
Specialized access: Full-archive access and researcher access
While many research questions can be addressed using conventional access points through Twitter APIs, third-party platforms, and shared tweet IDs, certain research questions require full-archive access. For example, projects aiming to analyze message diffusion structure and dynamics typically need to reconstruct the complete diffusion chains for tweets of interest such as fake news (Vosoughi et al., Reference Vosoughi, Roy and Aral2018) and health messages (Meng et al., Reference Meng, Peng, Tan, Liu, Cheng and Bae2018). In these situations, only the complete collection of tweets matched with filtering criteria can offer the granularity, resolution, and time stamps necessary to accurately infer who retweeted whom and when along the diffusion chain. Relatedly, research projects involving networks, such as the follower-followee network or the network formed by quoting, replying, or retweeting, are better served by obtaining full-archive access, because random samples of tweets remain prone to systematic biases in recovering key network-level attributes (González-Bailón et al., Reference González-Bailón, Wang, Rivero, Borge-Holthoefer and Moreno2014; Lee et al., Reference Lee, Kim and Jeong2006). For these reasons, we briefly introduce methods for access, financial cost, and skill sets relevant to the full-archive access to Twitter data.
Twitter’s enterprise-level APIs enable users to access its full archive dating back to the first tweet in March 2006. Compared with the standard version, enterprise APIs remove a lot of usage restrictions, but they are financially costly for individual researchers and graduate students. In addition, users must request enterprise-level access from and negotiate related terms with Twitter. One of the enterprise packages is the full-archive Search API. According to Twitter, this API provides complete and instant access to the full corpus of Twitter data. It is query-based access to the tweet archive with minute granularity. Using this approach, users define the filter rules, and tweets matching those queries become available from the Search API about 30 seconds after being published.
Often, these data are accessed via Twitter’s PowerTrack APIs, commonly known as the Firehose endpoints. PowerTrack API, which also provides access to the full Twitter archive, is the enterprise-level package based on the standard filtered Streaming API. Full-archive access, previously operated by data providers such as Gnip and now available directly from Twitter, offers 100% data coverage and allows complex search filters to match tweets. By applying the PowerTrack filtering language (e.g., geo-location and key words), users can filter the real-time stream of tweets. Decahose is another enterprise-level API based on the sampled Streaming API. It delivers a 10% random sample of the real-time Twitter Firehose. Table 3 summarizes two major types of Twitter APIs, Search APIs and Streaming APIs, and their three subscription levels: standard, premium, and enterprise.
Table 3. Twitter’s standard, premium, and enterprise levels of Search and Streaming APIs.

Around mid-2020, Twitter made available to invited institutions and research groups the streaming endpoint as part of its PowerTrack API, to provide free Firehose access to COVID-19-related tweets. In October 2020, Twitter tested the new Academic Research product track in a private beta program and publicly launched it in January 2021. In particular, Twitter released a new version of its APIs (V2) that is built on new functionalities, making it easier to collect and analyze the public conversation and simpler to scale up or down without changing APIs, as well as making it friendlier to academic researchers.Footnote 3 Previously, full-archive data were inaccessible to most researchers.
Enterprise APIs, such as Firehose via the Historical PowerTrack API, offer the highest level of access and reliability. Twitter currently does not have a fixed pricing structure. Accessing this type of APIs needs to be negotiated directly with Twitter, and users are charged on a case-by-case basis by assessing the nature and volume of requested data.
Given the large volume of data output from Firehose access, multiple workstations/servers can considerably enhance efficiency in handling data storage and processing. For example, in the analysis below of the COVID-19 Firehose corpus, a mere week’s volume in June easily reached more than 30 million tweets, and we had to find dedicated servers to store the entire corpus covering the second half of 2020, with the size measured in terabytes. This volume of data can overwhelm the most powerful laptops on the market. Raw tweets usually come in JSON files, which are better reorganized using distributed processing frameworks such as Hadoop or Spark to enable more efficient storage, filtering, and retrieval (e.g., via SQL).
Analytically, while analytical strategies such as dictionary-based scaling can be carried out in batches, almost independently of each other, other approaches such as topic modeling might require more advanced distributed processing to update parameter estimates globally across the entire corpus. Also, one needs to pay attention to whether the preferred analytical strategy is scalable and friendly to distributed processing. For example, although structural topic modeling is a preferred method to examine the linkage between metadata and topic structures (Roberts et al., Reference Roberts, Stewart and Tingley2019), it is typically less scalable and slower to run than the latent Dirichlet allocation algorithms adapted to distributed processing on large-scale data sets.
To bypass the technical complexities of setting up the distributed data storage and analytical infrastructure (e.g., Hadoop, distributed processing), one feasible option is to seek collaboration with computer and data scientists. We should caution that not all such interdisciplinary collaborations bear out. It is critically important to understand and resolve disciplinary differences such as incentives, research goals (e.g., explanatory theory building versus prediction improvement), publication processes (e.g., slower journal papers versus faster conference proceedings), and authorship norms. Our experiences suggest that grand challenges of common interest to multiple disciplines, such as the COVID-19 crisis, and opportunities for grant applications might create strong enough incentives to initiate and sustain such collaborations.
Ethical and legal issues are high-priority concerns
For researchers who use or plan to use Twitter data, several ethical and legal issues are worth considering. The first ethical challenge is whether and how to obtain informed consent from Twitter users whose information may be collected. As argued by Lomborg and Bechmann (Reference Lomborg and Bechmann2014), collecting informed consent is unrealistic for large-scale quantitative research since there is no direct contact between researchers and research participants; however, consent may be viable in small-sample qualitative studies using APIs (Lomborg & Bechmann, Reference Lomborg and Bechmann2014). Another ethical and legal challenge is how to analyze tweets related to sensitive topics such as people’s health status, sexual orientation, and religion. In terms of legal compliance, researchers should keep in mind that sharing the raw data set is prohibited under Twitter’s current developer policy.Footnote 4 Permittable workarounds include sharing tweet IDs or simply reporting the key words and retrieval time frame to allow other researchers to replicate data collection. Fiesler and Proferes (Reference Fiesler and Proferes2018), Norval and Henderson (Reference Norval and Henderson2020), and Webb et al. (Reference Webb, Jirotka, Stahl, Housley, Edwards, Williams, Procter, Rana and Burnap2017) provide detailed discussions of ethical concerns with using Twitter data.
Data quality
In this section, we highlight three major issues that researchers need to keep in mind when evaluating the quality of Twitter data. We then present empirical evidence of the representativeness of standard API and third-party platform samples of Twitter full-archive data, the ground truth.
The pros and cons of Twitter as organic data
Twitter data differ in nature from the data that researchers collect from traditional quantitative methods such as surveys or experiments. Survey data are researcher controlled and designed, whereas social media data can be viewed as more organic (Groves, Reference Groves2011). We highlight several nuances (i.e., advantages coexist with challenges) about data quality that researchers should consider due to this organic nature. The first nuance is data quality versus data newness. Data quality is more likely ensured in surveys and experiments, as researchers have more control of which participants to recruit and what questions to ask. Nevertheless, the emergent nature of social media discussions may offer researchers opportunities to identify new, previously unidentified perspectives and frames (Klašnja et al., Reference Klašnja, Barberá, Beauchamp, Nagler, Tucker, Atkeson and Alvarez2017, p. 17). “Newness” is a strength of social media data and is especially useful for studying emerging life sciences issues where the right questions to ask are elusive. However, data newness comes with a data quality challenge that requires researchers to develop methods to indirectly evaluate user characteristics such as user identity and motivations (Chen & Tomblin, Reference Chen and Tomblinin press).
The second nuance is control and cost. Researchers have more control of the data generation process in survey and experiments. Yet, it is costly to collect survey data, especially if a large sample of panel data is needed. For using Twitter to collect social media data, researchers cannot control sample composition, but they can assess sample representativeness of targeted populations through the limited profile information provided by the users. If researchers have domain knowledge about social media platform users, then social media is potentially much cheaper for collecting large and time-series data sets. Researchers also need to be aware that the data generation from social media can suffer problems such as algorithmic bias, polarization, and segregation (Baeza-Yates, Reference Baeza-Yates2018; Colleoni et al., Reference Colleoni, Rozza and Arvidsson2014; Lawrence et al., Reference Lawrence, Sides and Farrell2010). In fact, social media companies regularly conduct A/B testing (i.e., a simple controlled experiment with two variants) to understand their users. Yet, researchers know little about what A/B testing these companies are doing and how it may confound research results (Freiling et al., Reference Freiling, Krause, Scheufele and Chenin press). For instance, suppose the platform is experimenting with misinformation correction messages and the treatment is effective at changing users’ opinions. If the researcher collects data on users’ opinions during the experimental time frame, he or she might reach biased conclusions because the researcher does not know about this misinformation correction intervention.
Finally, there is also a theoretical consideration of whether the 1% random sample from the Streaming API is indeed random. As Twitter points out,Footnote 5 its standard API (V1.1) focuses on relevance and not completeness. Research also suggests that the universality of the 1% ceiling with millisecond filtering is unclear, and therefore there is no assurance of a random sample (Kim et al., Reference Kim, Hansen, Murphy, Richards, Duke and Allen2013; Pfeffer et al., Reference Pfeffer, Mayer and Morstatter2018). We provide more details on how we can assess the randomness later.
Bot intervention
Bot accounts are prevalent and evolving (Cresci, Reference Cresci2020). Bots account for 37.2% (Imperva, Reference Roberts2020) of all internet traffic. Existing literature shows that at least 39 countries, including the United States, the United Kingdom, Canada, Russia, and China, have reported cases of political manipulation involving social bots during political events (e.g., elections) or in normal times (Bastos & Mercea, Reference Bastos and Mercea2019; Bolsover & Howard, Reference Bolsover and Howard2019; Cresci, Reference Cresci2020; Luceri et al., Reference Luceri, Badawy, Deb and Ferrara2019; Stukal et al., Reference Stukal, Sanovich, Bonneau and Tucker2017).
It is necessary to assess whether bots warrant concern about the reliability and representativeness of social media data, as bots and humans have become increasingly difficult to distinguish from each other. The answer depends upon the nature of the research question. For example, when the interest is the discursive strategies of legitimate users such as political elites, bot detection might not be necessary, since politicians are seldom willing to hand over their social media accounts to algorithms. However, when the goal is to depict online discourses or topical trends in public opinion, naively treating social media data as exclusively human traces without considering the existence of bots may lead to misjudgment (Duan et al., Reference Duan, Li, Josephine, Yang, Chen, Shah and Yangn.d.).
Methods have been developed for detecting social bots. One off-the-shelf bot detection tool is Botometer (Observatory on Social Media, Reference Social Median.d.), a machine learning-based system which evaluates the activity of a Twitter account and generates a bot-like score (Davis et al., Reference Davis, Varol, Ferrara, Flammini and Menczer2016). Besides the machine learning approach, other approaches are graph-based (Hurtado et al., Reference Hurtado, Ray and Marculescu2019), crowdsourcing-based (Wang et al., Reference Wang, Mohanlal, Wilson, Wang, Metzger, Zheng and Zhao2012), and anomaly-based (Echeverria & Zhou, Reference Echeverria and Zhou2017; Orabi et al., Reference Orabi, Mouheb, Al Aghbari and Kamel2020).
Sample representativeness
For big data research, the “bigness” of data size can never guarantee representativeness of the target population, a critical challenge facing scholars who use social media data. Despite its popularity as a source of accessible digital trace data, Twitter attracted a mere 22% of Americans as self-reported ever users in 2019 (Perrin & Anderson, Reference Perrin and Anderson2019). Even for Facebook, the most popular social networking site to date, still around 30% of Americans had never used its service as of 2019 (Perrin & Anderson, Reference Perrin and Anderson2019). The sample representativeness of the general population of Twitter data is still debated, but it appears to be highly contingent on the research question. For certain topics, research has shown that Twitter is a credible source to reproduce real-world outcomes such as protest and violence (Muchlinski et al., Reference Muchlinski, Yang, Birch, Macdonald and Ounis2021; Sobolev et al., Reference Sobolev, Chen, Joo and Steinert-Threlkeld2020; Steinert-Threlkeld, Reference Steinert-Threlkeld2018; Zhang & Pan, Reference Zhang and Pan2019). However, for other research questions, such as studying public opinion across the United States, we align with other scholars who express caution about extrapolating Twitter users’ opinions to other Americans, such as about people’s happiness level (Jensen, Reference Jensen2017). Twitter users are younger and are more likely to be Democrats compared with the general public, and 10% of users created 80% tweets (Wojcik & Hughes, Reference Wojcik and Hughes2019). As Barberá & Rivero (Reference Barberá and Rivero2015) suggested, Twitter provides researchers with the opportunity to study public opinion, yet the validity of generalizations needs to be assessed along with the biases within political discussions on Twitter.
Other sources of data bias
Two additional sources of potential biases may further threaten the quality of obtainable big social media data: (1) the quality of search terms for data retrieval and (2) the black box of APIs and third-party platforms especially their sampling logic. There have been extensive discussions about search term development and evaluation (Kim et al., Reference Kim, Huang and Emery2016; King et al., Reference King, Lam and Roberts2017), but little is known about the sampling quality of APIs and third-party platforms, which is our focus in the empirical assessment.
Researchers relying upon APIs and third-party platforms rarely have the opportunity to verify how sampling is handled on the back end. For example, according to Twitter documentation, compared with the latest API (V2), its free-access standard API (V1.1) is less likely to return true randomly sampled data, because it is designed to improve relevance for consumer-use cases. Although this potential deviation from true random sampling has been corrected in API (V2), such biases might have permeated numerous third-party platforms that rely upon Twitter’s APIs.
To evaluate the extent to which such biases in sampling of full-access data might exist in Twitter’s standard API (1% data coverage) and third-party platforms, we next use the same list of search terms related to COVID-19 to compare the distributions of one specific type of content attribute—moral appeals—in three collections of COVID-19 tweets for a two-week period of data (July 1–July14, 2020, Coordinated Universal Time): Twitter’s standard API (1% coverage), a third-party platform that claims to provide 10% random sampling, and Twitter’s full-archive access (the ground truth).
Third-party platform and Twitter API representativeness of full-archive data
Over the past decade, interest has grown in applying moral foundations theory (MFT) (Graham et al., Reference Graham, Haidt, Koleva, Motyl, Iyer, Wojcik and Ditto2013; Haidt, Reference Haidt2012) to investigate the roles of moral appeals and moral values in political ideology, public opinion, and individuals’ processing of information related to controversial medical and scientific issues (Clifford & Jerit, Reference Clifford and Jerit2013; Skitka & Morgan, Reference Skitka and Morgan2014; Wolsko et al., Reference Wolsko, Ariceaga and Seiden2016; Yang et al., Reference Yang, Maloney, Tan and Cappella2018). MFT has become a useful theoretical framework for scholars studying politics and life science communication. In this analysis, we use the most recent extended Moral Foundations Dictionary (Hopp et al., Reference Hopp, Fisher, Cornell, Huskey and Weber2020) to measure each tweet’s mentioning of the five types of moral appeals (care, fairness, loyalty, authority, and sanctity). We focus on relevance scoring and do not distinguish moral virtues (e.g., a tweet praising mask-wearing as caring for others) from vices (e.g., a tweet condemning violation of social distancing that harms others). Since many social science questions concern extracting theoretical constructs similar to moral appeals from social media data, this empirical assessment is intended to provide insights into the prevalence (or the lack of) of potential sampling biases likely to generalize to other research contexts.
If Twitter’s standard API and third-party platforms indeed return random samples of matched tweets under identical screening criteria (e.g., language, time period, and key words), we should expect to see similar distributions of any content feature—including moral appeals—across the three data sets. Figure 3 presents the density plots comparing the three data sources, stratified by moral appeal type. Similar to previous studies (Hopp et al., Reference Hopp, Fisher, Cornell, Huskey and Weber2020), the empirical distributions largely resemble a normal distribution. The overall shape, central tendency, and spread of these distributions appear comparable from visual inspection, which is consistent with similar estimated means and standard deviations across the three data sets, per moral appeal category (see Table 4 for details on basic descriptive statistics).

Figure 3. Comparisons of score distributions of five moral appeals.
Table 4. Comparison of five basic statistics across three data sources.

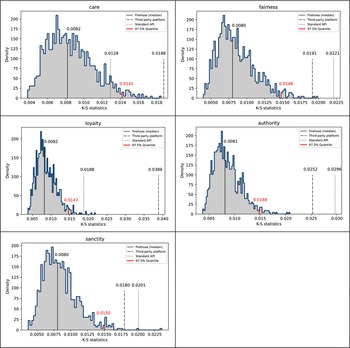
Further, we perform a series of Kolmogorov-Smirnov (K-S) tests to further investigate the statistical comparability across the three data sources. In the two-sample case, the K-S test statistic is an indicator of the maximum distance between the empirical cumulative distribution functions of two samples (Massey, Reference Massey1951). In our study, two steps were taken: first, we repeatedly sampled 10,000 tweets without replacement from the full-archive Firehose 1,000 times, and then we calculated the K-S statistics between each sample against the entire Firehose corpus to derive an empirical distribution of the K-S test statistics under the null hypothesis, respectively for each moral appeal category. Next, for each moral appeal type, we estimated the K-S statistics comparing the entire third-party corpus and also the entire standard API corpus with the Firehose, respectively (see the two dashed vertical lines in Figure 4).

Figure 4. K-S statistics distribution comparison.
As Figure 4 indicates, for most moral appeal categories, the two observed K-S test statistics lay beyond the 97.5% quantile cut-off points (two-tailed tests) in the empirical K-S distributions under the null, suggesting statistically significant discrepancies in the shape of most moral appeal distributions between the Firehose and the other two data sets. This pattern casts doubt on the assumption that the other two corpora could be treated as random samples from the Firehose. With that said, we should note that K-S tests are sensitive to sample size and can easily pick up noise in local discrepancies. Given our large sample sizes, we would like to emphasize the lack of substantial discrepancies between the three data sets in terms of the descriptive statistics reported in Table 4 and the highly comparable density plots in Figure 3.
New development: Twitter Academic Research API
On August 12, 2020, Twitter released Twitter API V2, including a dedicated Academic Research track. In this version, Twitter rebuilt the foundation of its API services, redesigned the access levels and developer portal, and introduced new product tracks for different use scenarios. In particular, the free Academic Research track, available to researchers upon application and Twitter’s approval, provides access to the full Twitter archive, though this access is currently subject to some limitations. Although anyone can apply for the new API V2, as of spring 2021, it seemed that applicants with academic institutional affiliations having a clearly defined research project and pledging to adhere to Twitter’s Developer Policy had a greater chance for approval for the Academic Research track. Next, we outline major updates to API V2, especially the Academic Research track, in terms of access restrictions, scope of the data set available, and changes in the data organization unit.
Regarding data access, under API V2, researchers could access the full Twitter archive for free, subject to a monthly cap of 10 million tweets, as of spring 2021. This access is similar to the enterprise level in V1.1 mentioned in Table 1; yet in V1.1, most requests at this level would incur substantial financial cost. The Academic Research track supports full-archive search for any topic that the researcher is interested in, as long as the topic is not out of the scope delineated in the initial application. It is not clear how closely Twitter monitors the scope of queries; however, we encourage interested researchers to submit revised requests to Twitter should they decide to substantially modify the scope.
The third noteworthy feature is an added organizing logic for retrieved data, namely, the logic of conversation thread. API V2 assigns a shared conversation ID to all replies to an original tweet, as well as replies to a reply. Therefore, researchers can retrieve and reconstruct the entire thread of the evolving conversation linked by the conversation ID and indexed by time stamps. Previously in API V1.1, only segments of the conversation could be retrieved, lacking key information to accurately track how a conversation grows in length and complexity. Now, this critical information is readily accessible under API V2.
Under the Academic Research track, researchers are now able to access a larger Twitter archive, both historical and streaming, at nearly no cost, which can benefit researchers who have access to limited funding. In addition, researchers have the opportunity to explore research questions related to public discourses and information diffusion and mutation more easily than before. For instance, researchers can track the evolution of Twitter conversations over time by taking advantage of conversation IDs. Also, it is much easier to calculate public engagement with content made feasible by using publicly available metrics (e.g., number of likes or retweets) and internal metrics (e.g., impression count or URL link clicks), a capacity available now yet previously hidden.
Conclusion
Twitter data are well suited to a number a research questions and have been used in published research on several important topics (e.g., Budhwani & Sun, Reference Budhwani and Sun2020; Chew & Eysenbach, Reference Chew and Eysenbach2010; Fownes et al., Reference Fownes, Yu and Margolin2018; Paul & Dredze, Reference Paul and Dredze2011; Singh et al., Reference Singh, Bansal, Bode, Budak, Chi, Kawintiranon, Padden, Vanarsdall, Vraga and Wang2020; Vance et al., Reference Vance, Howe and Dellavalle2009; Wang & Guo, Reference Wang and Guo2018; Wirz et al., Reference Wirz, Xenos, Brossard, Scheufele, Chung and Massarani2018). But collecting Twitter data can be costly and time-consuming, and it often requires scholars to learn new skills. Building an interdisciplinary team is one way to efficiently address these challenges as well as to study meaningful problems at the intersection of life sciences and politics, which by nature are already multidisciplinary. Our goal in this article has been to introduce Twitter data as a viable research resource and to highlight key issues surrounding access, costs, training, and data quality that researchers need to consider when deciding whether and how to use these data. We summarize the main points of our paper as follows:
Tools, costs, and training
-
• Scholars can use Twitter’s standard APIs, third-party platforms, and the full archive to access Twitter data. Before thinking about the costs and training issues, researchers need to base their choice of data tools on what research questions they are interested in studying. When the focus is on the content of Twitter discourse about life sciences and politics, accessing a sample of tweets collected by the standard APIs or third-party platforms will likely suffice. Studying the network among users, however, requires researchers to access the Twitter full archive in order to construct a complete network.
-
• Budget is almost always a constraint for researchers. Twitter offers free but limited access to data in some cases, but the standard APIs and third-party platforms require researchers to expend money if they need a large sample of tweets rather than 1% or limited historical tracing. However, budget constraints can be worked around if researchers have a flexible schedule about data collection. For instance, Twitter’s Search API is free going back seven days of data. Yet, researchers can write scripts to collect data every seven days to build a time-series data set for free. The new Academic Research track for Twitter API V2 helps reduce the financial costs for Twitter-approved researchers.
-
• Different learning curves are required for various tools. Third-party platforms require the least programming skills. Researchers, though, are restricted by certain types of Twitter data that third-party platforms give to them. While acquiring new skills is essential, building an interdisciplinary team is also beneficial to accelerate the process.
Data quality
-
• Twitter data are organic, which has advantages and disadvantages for researchers. It is a recommended practice to assess and describe who the users are from collected tweets and whether the presence of bots is a concern for key research questions.
-
• Critically assessing the promise of the 1% random sample from standard APIs or a higher percentage of a random sample from third-party platforms is a key task facing future research in order to assess the representativeness of data returned by various data tools.
-
• We compared moral appeal distributions to assess sample representativeness relative to full-archive access. If researchers have access to multiple Twitter data sets, it is useful to carry out similar evaluations using content features tailored to their own research projects. Dictionary-based content scaling could be used as an easy-to-implement and efficient means for such comparative analyses.
-
• In our empirical examination comparing the full-archive Firehose data to the 1% sample from Twitter’s standard API or to the third-party platform, discrepancies in the distributions of moral content were statistically significant, based on the K-S tests, but not substantial. These findings support using the less costly, sampled Twitter data sets for social science research, such as studying moral messaging in the case of COVID-19. With that said, before we fully understand the representativeness of these sampled tweets from standard APIs or third-party platforms, we emphasize the value of assessing comparability between different data sources to improve confidence in findings from using Twitter data.
Acknowledgments
Kaiping Chen would like to thank the National Science Foundation for supporting this work under Grant No. 2027375. The authors thank Yachao Qian for research assistance, particularly for help with compiling data and conducting analyses. We are also thankful for support from the Mass Communication Research Center and the Center for Communication and Civic Renewal at the University of Wisconsin-Madison as well as grant support from The John S. and James L. Knight Foundation, the Hewlett Foundation, and the Journal Foundation. We thank Twitter, Inc. for providing the COVID-19 stream. Additional support for this research was provided by the University of Wisconsin-Madison Office of the Vice Chancellor for Research and Graduate Education with funding from the Wisconsin Alumni Research Foundation.
All authors contributed equally to this article.


 Open access