


DISCUSSION POINTS
• Hydrogen is scheduled to be produced for public transit fuel cell powered buses in Hawaii starting in 2020.
• This case shows that pairing hydrogen production systems with other load centers can be mutually beneficial in high renewable penetration scenarios.
• It is important to consider the variable efficiency of the system when evaluating the economics of hydrogen production.
Highlights
The cost of hydrogen production in a unique behind-the-meter scenario is presented. Increasing solar will have the biggest impact on the cost of hydrogen but will require optimal scheduling methods to maximize benefits.
Introduction
As electric grids begin to incorporate more intermittent renewable resources of energy such as solar and wind, the value of technologies such as batteries that can balance supply and demand will increase significantly. Grid-scale energy storage has the potential to provide this capability, and a number of studies have shown the technical and economic benefits of energy storage systems in this capacity.Reference Divya and Østergaard1–Reference Byrne, Nguyen, Copp, Concepcion, Chalamala and Gyuk4 However, large-scale loads that can ramp up and down quickly to match the generation needs, such as hydrogen production facilities, could also provide similar functionality while producing additional valuable commodities.Reference Staffell, Scamman, Velazquez Abad, Balcombe, Dodds, Ekins, Shah and Ward5–Reference Ball and Weeda7 This type of capability will become increasingly important as regions around the world become more reliant on renewable and intermittent forms of power production. Studies projecting future grids with high levels of intermittent resources show that hydrogen production facilities using water electrolysis could be a good flexible load for grid operations because electrolyzers can be controlled to vary their load quickly at potentially large scales.Reference Almansoori and Shah8–Reference Robinius, Raje, Nykamp, Rott, Müller, Grube, Katzenbach, Küppers and Stolten11 Though hydrogen production from fossil fuel reformation is typically the cheapest mode of production currently,Reference Acar and Dincer12 electrolytic hydrogen production could become a cost-effective option if there is an abundance of excess renewable generation that would otherwise be curtailed.
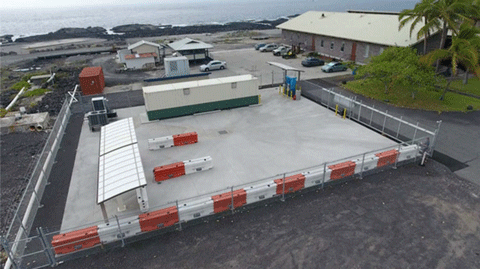
One rather unique microcosm of this concept is the Natural Energy Laboratory of Hawaii Authority (NELHA) research park. NELHA operates an ocean science and technology park at Keahole Point that supports economic diversity and sustainable development for the State of Hawaii. As part of this function, the research campus houses multiple enterprises serving a wide range of research needs. NELHA purchases electricity from the Hawai'i Electric Light Company (HELCO) and has also installed multiple photovoltaic (PV) arrays to support their electric demand. The campus has operated a 35kW PV array for years and recently signed a power purchase agreement for an additional 170kW of PV generation for a total of 205kW of PV capacity. However, the typical daily peak load recently dropped to approximately 180kW as one of the major loads at the campus ceased operation. As such, it may become common for the campus to have an overabundance of PV generation at midday, which will represent a significant loss of value as excess generation cannot be sold to their utility. The installation of an energy storage system was considered to fully utilize the excess solar that will be generated, but the campus will also soon begin operation of an approximately 250kW hydrogen electrolysis facility that will be operated by the Hawaii Natural Energy Institute (HNEI), as shown in Figure 1, which reduces the need for a separate energy storage system.

Figure 1. HNEI electrolyzer and hydrogen fueling station at the NELHA research park
This facility is the first of its kind on the island, capable of producing up to 65 kg of hydrogen a day and will be used to provide fuel for three fuel cell buses (Figure 2) on the island. This will be a useful demonstration of the flexible hydrogen production concept and will also contribute to Hawaii's goals to transition to a 100% green transportation system, targeted to be completed by 2050.

Figure 2. FCEB to be fueled by hydrogen from the electrolysis facility
To fully demonstrate the flexibility of the system, researchers at HNEI modified the control system of the electrolysis facility to improve its response time to perform fast applications such as frequency response, which could be a revenue stream that electrolysis facilities could access in the future. However, for the time being, production from the HNEI system will directly add to the electric load of the NELHA research park and will therefore be subject to the pricing structure imposed by the local utility. This could be mutually beneficial as the facility's demand could be varied to best utilize excess generation at the research park without the need for additional systems. However, the optimal mode of operation to minimize the cost of hydrogen production is not readily apparent and the cost of suboptimal scheduling could be very high as NELHA is charged based on their total energy consumption as well as their peak monthly demand. An early test of the facility over only a couple of hours more than doubled the monthly demand charges for the research park, costing a few thousand dollars for a relatively short test. When this facility begins full operation, it will need to run for the equivalent of 12 hours a day at full load daily to generate enough hydrogen for three fuel cell buses on the island. This will represent a significant increase in the electricity demands of the research campus that could cause a substantial increase in charges if not managed appropriately. It will be very important to understand the best mode of operation for the system as this directly impacts the cost of producing the hydrogen to be sold to the public transit system.
This paper seeks to answer the following with regards to behind-the-meter hydrogen production at the NELHA research park:
1) What electricity rate structure should be selected for the NELHA research park given the new load from the electrolysis facility?
2) How should the facility be operated to minimize the cost of the necessary hydrogen production?
3) What is the minimum cost of hydrogen production in this scenario?
4) Would it make more sense for the facility to operate as a standalone entity given the prevailing utility rate structures?
5) How would the cost of production vary based on the amount of solar resources available on the campus?
Conclusions will be drawn from the analyses of these scenarios to inform the optimal operation of the facility and discuss the implications for hydrogen production planning and operation in other behind-the-meter cases.
System configuration
The Natural Energy Laboratory of Hawaii Authority's park on the Island of Hawai'i supplies resources for over 50 renewable energy and aquaculture research projects. One key resource that the park provides is pumped sea water that is used widely to provide temperature-controlled water to the aquaculture facilities and ocean thermal energy conversion research stations and is even used for air conditioning NELHA buildings. The energy to pump this deep ocean is a significant and critical component of the electrical demand of the campus. Even short pump outages can be fatal to many of the creatures being sustained in the aquaculture facilities. As such, the campus has significant overnight pumping loads that cannot be eliminated. This fact has significant implications on the proper selection of the rate structure for the research campus and the optimal mode of operation for the HNEI electrolysis system to limit electricity charges.
HELCO rate structures
The NELHA research park's electricity needs are serviced by the Hawai'i Electric Light Company (HELCO). Two rate structure options are available to the NELHA research campus through HELCO - Schedule J13 and Time-of-Use (TOU) Schedule J.14 Both rate schedules include three major components:
• Demand Charge - $13/kW for the maximum power measured in the month
• Energy Charge - ₵/kWh rate for energy use
◦ The most significant contributors to this are flat energy cost recovery rates, which fluctuate monthly from 16-18 ₵/kWh based on utility calculations of fuel costs, and non-fuel energy charges, which is an additional ₵/kWh that can have hourly time-of-use options.
• Power Factor Adjustment - Either a credit or charge calculated as:
(1.1) $$\matrix{ {C_{PF} = PF_{adj}\lpar {C_{dem} + C_E + R_{PF}\cdot E_{total}} \rpar } \hfill \cr {PF_{adj} = \displaystyle{{0.1} \over {100}}\lpar {85-\overline {PF} \cdot 100} \rpar } \hfill \cr } $$

where CPF, Cdem, and CE are the monthly power factor, demand, and energy charges, respectively, PF is the power factor, RPF is a power factor adjustment rate of 10.2440 ₵/kWh, and Etotal is the amount of energy purchased in the month.13,14
The non-fuel energy charge under Schedule J is 9.6448 ₵/kWh at all times of day under Schedule J. Table 1 shows the non-fuel energy charges with Schedule TOU J.
Table 1. Time-of-Use Schedule J Pricing and Demand Windows

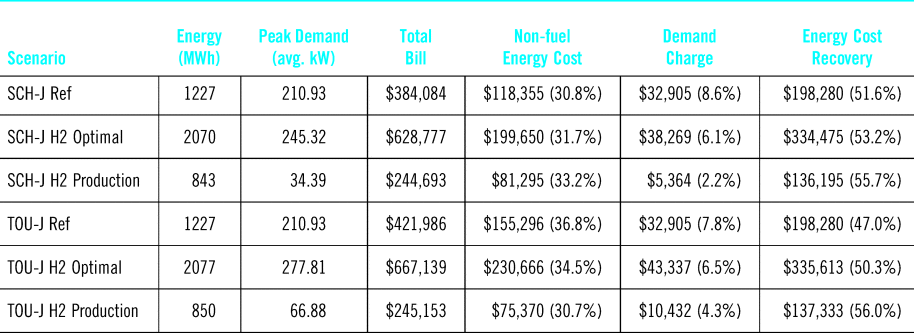
Table 2. Projected annual electricity cost statistics with different tariffs and hydrogen production scenarios

Unlike other areas of the country with time-of-use options, the electricity prices are lowest in the middle of the day from 9:00AM to 5:00PM, which incentivizes energy use outside of peak sun hours. This is likely because of the high penetration of solar generation in Hawaii, which greatly reduces net loads in the middle of the day and leads to a swift increase in generation demands in the evening as solar production ends. To combat this, HELCO is now beginning to incentivize mid-day energy use to shift loads to coincide with solar production. The implications of this versus fixed energy pricing will be discussed further later in the paper.
Modeling and optimization methodology
NELHA provided 15-minute demand data from Jan 2017 – June 2019 that included separate generation measurements from a 17.7 kW PV array on the campus. The kW, kVA, and kVAR demands for the campus were all measured and were included in the data, though gaps in the data were present due to occasional communication losses in the field. A continuous, representative data set was generated by interpolating over these data gaps. The data also included tests of the hydrogen facility that showed up as sudden ~250kW demand increases. These instances were filtered out and a third order spline interpolation of the data surrounding the removed points was used to estimate the demand of the research campus without the hydrogen facility so a baseline case could be estimated.
The output of the 17.7kW plant was scaled up by the ratio of installed capacity to estimate the output from all the PV resources. This assumes that the power output would scale up linearly with capacity.
Research campus modeling framework
The load schedule of the hydrogen production facility was optimized to minimize the cost of hydrogen production by solving a linear program assuming perfect foresight of the demand of the research park and solar generation. This optimization was performed subject to the constraints on the system shown below where C denotes a $/kW price, c denotes a $/kWh price, P denotes power in kW, ¢t is the measurement interval in hours, and H indicates a binary array with a 1 for each hour the given price is in effect.:
 $$\matrix{ {\mathop {\min }\limits_{P_C,P_D,P_{H2}} } & {P_{\,peak}\cdot C_{Dem} + \Delta t\cdot \sum\limits_{t = 1}^T {P_{FG,t}c_{total,t} + \displaystyle{{\sum\limits_{t = 1}^T {\sigma _{t + } + \sigma _{t-}} } \over K}} } & {\left( a \right)} \cr {where} & \matrix{c_{total,t} = c_{E,t} + c_{other} \cr c_{E,t} = c_{on-peak}\cdot H_{on-peak,t} \cr \quad\quad\quad+ c_{off-peak}\cdot H_{off-peak,t} \cr \quad\quad\quad+ c_{mid-day}\cdot H_{mid-day,t}} & {\left( b \right)} \cr {s.t.} & {P_{FG,t} = P_{Dem,t} + P_{H_2,t}-P_{sol,t} + P_{curt,t}} & {\left( c \right)} \cr {} & {P_{FG,t} \ge 0} & {\left( d \right)} \cr {} & {P_{curt,t} \le P_{sol,t}} & {\left( e \right)} \cr {} & {P_{\,peak} \ge P_{FG,t}} & {\left( f \right)} \cr {} & {\sigma _{t + }-\sigma _{t-} = P_{FG,t}-P_{FG,t-1}} & {\left( g \right)} \cr } $$
Subscripts Dem, FG, sol, E, H2, and curt represent demand, power purchased from the grid, solar generation, energy, hydrogen facility power, and curtailed power, respectively. The other per kWh charges (cother) include relatively small fixed prices for energy cost recovery, purchased power adjustments, revenue balancing account provisions, and public benefits funds as defined in the rate schedules.13,14
The cost function in Eqn. (1.2) is essentially equal to the monthly power and energy charges for the research park. The terms σt+ and σt - in the cost function are non-negative variables that relate to increases or decreases, respectively, in the net power draw of the research campus. A slight penalty is associated with fluctuations in the net demand (K = 1000) to smooth the system dispatch and consequently limit the number of on/off operations of the hydrogen production facility. The resulting dispatch schedule is more reflective of realistic facility operations and preliminary analyses showed that this was less computationally intensive with the same effect than directly limiting facility operations. Non-fuel energy charges are a fixed 9.6448 ¢/kWh with Schedule J in lieu of the definition in Eqn. (1.2)b. Net energy metering is not in effect here, hence constraint (1.2)e specifies that energy coming from the grid be greater than or equal to 0 at all times. The power factor adjustment is calculated after the optimization algorithm completes to avoid excessive computational expense. Besides these constraints, additional constraints were also needed for the hydrogen production facility to simulate the capabilities and limitations of the system.
Hydrogen facility modeling framework
The hydrogen production facility consists of a Proton C30 electrolyzer, and the requisite balance-of-plant components to produce up to 65 kg/day of hydrogen at 30 bar.Reference Virji, Randolf, Ewan and Rocheleau15 Previous work with this system was undertaken to ensure that the system could quickly vary its load to perform frequency response operations.Reference Ewan, Rocheleau, Swider-Lyons, Devlin, Virji and Randolf16 Hydrogen produced by the system is stored in one of three transport trailers that can store up to 100 kg of hydrogen each.
For the optimization algorithm, the hydrogen facility demand was added to the power balance constraint as shown in Eqn. (1.2)d. Additional constraints on the electrolysis facility are imposed to reflect the on-site hydrogen storage capabilities, efficiency of the system across its operating envelope, and minimum operation levels proposed by HNEI. The amount of hydrogen stored on-site is modeled with the following constraints:
 $$\displaylines{S_{H_2\comma t} = S_{H_2\comma t-1} + \Delta t\cdot G_{H_2\comma t}-D_{H_2\comma t} \cr 0 \le S_{H_2\comma t} \le S_{H_2\comma \max }} $$
where SH2,t is the amount of hydrogen stored in the transport trailer in kg, GH2,t is the hydrogen production rate at time t in kg/hr, and DH2,t is the hydrogen fueling demand at time t in kg. For this study, it was assumed that only one of the 100 kg transport trailers was in use, making SH2,max equal to 100 kg. It was further assumed that hydrogen withdrawals occurred at a steady rate from 6pm-7pm daily at the end of the buses’ daily routes.
The relationship between the hydrogen production rate and facility power draw for this electrolysis system was modeled in a previous study.Reference Virji, Randolf, Ewan and Rocheleau15 This model includes the considerations of the demand for total system, including the balance-of-plant components, and yielded data for the hydrogen production rate and across the full range of the facility's power consumption as shown in Figure 2. The relationship between power and hydrogen production rate is highly linear below ~70% of the maximum load, but the production efficiency drops off above this level of power consumption because of the limitations of the electrolyzer itself. This loss in production efficiency should be reflected in the optimization algorithm to give a better representation of the proper dispatch schedule and a more accurate representation of the minimum cost of production.
To do this, the model presented inReference Virji, Randolf, Ewan and Rocheleau15 was incorporated into the optimization as a piecewise linear correlation between the facility power output and hydrogen production rate using type 2 special ordered sets (SOS2):
 $$\matrix{ {P_{H_2\comma t} = \sum\limits_{k = 1}^B {b_k\cdot x_{k\comma t}} } \hfill \cr {G_{H_{&2}\comma t} = \sum\limits_{k = 1}^B {g_k\cdot x_{k\comma t}} } \hfill \cr {1 = \sum\limits_{k = 1}^B {x_{k\comma t}} } \hfill \cr {x_{k\comma t} \le \gamma _{k\comma t}} \hfill \cr } $$
where k denotes the break points in the piecewise linear approximation, bk is the power at breakpoint k, gk is the associated hydrogen production rate at breakpoint k, xk‘s are continuous variables introduced by the SOS2 representation for interpolation between break points, and γk's are binary variables for which only consecutive values can be non-zero. This imposes a continuous relationship between the hydrogen production and facility power that is linear between the break points. Break points at 0%, 74%, 90%, and 100% of the full rated facility power were used for this analysis. Analysis results using this variable efficiency method versus a constant efficiency model will be shown to highlight the importance of including this consideration in valuation studies.
HNEI further specified that the facility would only be operated between 10% and 100% of its full rated power when online. To reflect this, the following constraints were imposed:
 $$\matrix{ {P_{H_2\comma t}-\alpha _{H_2\comma t}\cdot P_{H_2\comma \max } \le 0} \cr {P_{H_2\comma t}-A\cdot \alpha _{H_2\comma t}\cdot P_{H_2\comma \max } \ge 0} \cr } $$
where αH2,t is a binary variable that equals 1 if the hydrogen facility is in operation at time t and 0 if it is shutdown, and A is the minimum load fraction for the facility of 10%. This ensures that if the facility was to run at less than 10% of its full rated capacity, it would instead be shut down in the optimization algorithm (αH2,t = 0).
Lastly, the kVAR demand of the hydrogen facility needed to be estimated to give the correct total kVAR demand of the research park for the power factor adjustment. This was estimated by comparing the original data set (including hydrogen facility testing) and the filtered data set. The kW and kVAR differences between these two data sets were assumed to be contributed by the hydrogen production facility. From this, it was found that the kVAR demand of the hydrogen facility was approximately 18.5% of the kW demand on average. This relationship was used to calculate the total kVAR demand for the campus for the calculation of the power factor adjustment after the optimization was performed. The linear program was implemented using PyomoReference Hart, Watson and Woodruff17,Reference Hart, Laird, Watson, Woodruff, Hackebeil, Nicholson and Siirola18 in Python and solved using Gurobi.19
NELHA case study with current resources
There are of course a number of ways that the electrolyzer could be operated to meet the hydrogen demand of the buses. Initial plans were to run the electrolyzer at a constant full load for the necessary amount of time to generate the daily demand of hydrogen. However, this mode of operation would significantly increase the peak demand of the research campus every month, thereby increasing the cost of hydrogen production.
Alternatively, the hydrogen production facility load could be varied to take full advantage of time-of-use energy pricing windows and/or solar generation while minimizing the increase in demand for the research park. This could potentially lead to significant differences in the cost of hydrogen production, though it would require more sophisticated control and forecasting methods to be implemented with the real system. The difference in hydrogen production costs with optimal or simple dispatch scheduling will vary depending on a number of factors that could interact in unexpected ways. For instance, the selection of the utility pricing schedule will have major implications on the added cost from hydrogen production and the charge paid for the entire research park. In the following subsections, we will discuss the effect of 1) the electricity rate structure, 2) mode of operation, 3) standalone operation of electrolyzer, 4) increasing solar generation, and 5) how all of these factors interact.
Rate structure comparison
Firstly, we will look at the effect of the rate structure on both the electricity cost of the NELHA campus without hydrogen production, and the added cost of hydrogen production under each rate structure in the optimal case. Again, the two rate structure options are SCH-J, which uses flat energy and demand charges, and TOU-J, which has three energy charge rates depending on the time of day. Figure 3 shows sample optimal dispatch schedules for each rate structure over a three-day period in July. This figure shows time series of the demand of the NELHA research park without hydrogen production (Demand), the on-site solar generation(Solar), the optimal power draw for hydrogen production (H2 Prod), and the net power demand for the research park including hydrogen production that would need to be purchased from HELCO (From Grid). Recall that the variable component of this scenario that is being optimized by the algorithm is the hydrogen production power requirements, and by extension the power purchased from HELCO at each time.

Figure 3. Electrolyzer efficiency and production rate versus % full power and selected SOS2 break points
The optimal dispatch profiles for SCH-J and TOU-J are fairly similar, with the demand of the electrolysis facility being varied to maintain a steady power draw from the utility. This optimally supports the electricity needs of the entire research park while minimizing the increase in the monthly peak demand to limit the increase in demand charges. The major difference between the optimal dispatch for SCH-J and TOU-J is the hours of operation over which this function is performed. Under TOU-J, hydrogen production is stopped during the on-peak period of 5:00PM-10:00PM when energy prices are at their highest. As a result, a consistent demand is maintained during the daily mid-day and off-peak pricing windows, but the limited production hours every day necessitates a higher peak demand to minimize the non-fuel energy charges.
The projected electricity costs of the research park while optimally generating 31 kg of hydrogen daily in addition to the normal loads are $629k ($38k demand charges) under SCH-J and $667k ($43k demand charges) under TOU-J. This is something of a surprising result as the natural assumption is that the ability to shift most of the hydrogen production to mid-day hours with low electricity prices would minimize charges. However, as the rest of the research campus load cannot be moved to low price times of day, the non-fuel energy charges increase due to elevated prices outside of the Mid-Day window and the continued overnight loads for the campus. This fact alone is sufficient to make SCH-J the preferable option for the NELHA campus, despite the potential to move hydrogen production to lower cost times of day.
With regards to the increase in electricity cost caused by the hydrogen production, it turns out again that the time-of-use option is also slightly worse in this case for a few key reasons. Firstly, despite the fact that the non-fuel energy costs from hydrogen production can be reduced versus SCH-J, this is at the expense of increasing demand charges as the available window for low cost production contracts, necessitating higher powers be used during the Mid-Day window. This also leads to a loss in the efficiency of the electrolysis system, which increases the total amount of energy that needs to be purchased. This ultimately leads to a slight increase in the energy cost recovery charge under TOU-J of about $1k versus SCH-J. Secondly, for the amount of hydrogen being produced and the peak production rate of the system, not all of the production can be shifted to the Mid-Day window, meaning that additional energy must be purchased at a higher price than with SCH-J (14.6448¢/kWh Off-Peak vs. 9.6448¢/kWh flat SCH-J).
It should be noted that this is very much a function of the specifics of the rate structure options and pairing with the NELHA campus, which has significant overnight loads that cannot be shifted to Mid-Day windows. The energy cost recovery charges comprise approximately 50% of the monthly expense in both cases, and electrolyzer scheduling has very little effect on this. Results could be significantly different if 1) demand charges also had a time-of-use component, as is used in some areas or 2) if the fixed “energy cost recovery” charge was not so large a portion of overall charges.
The effect of considering variable efficiencies
It is also important to consider the loss in efficiency of the system at high loads in the optimization routine to yield a more realistic estimate of the optimal cost of production and dispatch schedule. Neglecting this can lead to very different optimal dispatch schedules and projected costs. Figure 4 compares the optimal dispatch of the system with and without consideration of the change in efficiency of the system at high loads under TOU-J.

Figure 4. Sample optimal dispatch profiles for mid-July under a) SCH-J and b) TOU-J
If the loss in efficiency at high loads is not considered, the “optimal” dispatch schedule moves much more of the hydrogen generation to the Mid-Day window to decrease the non-fuel energy charges as shown in Figure 5b. This further increases the peak demand for the month, but without acknowledging the additional penalty of needing to use more energy to produce the same amount of hydrogen when operating at high powers, this tradeoff appears more beneficial than it would be in reality. In this case, assuming a fixed efficiency for the electrolyzer leads to a $10k reduction in the estimated annual cost of production as shown in Table 3.

Figure 5. Sample optimal dispatch schedule with TOU-J pricing using a) variable electrolyzer efficiency and b) fixed electrolyzer efficiency
Table 3. Projected annual electricity cost statistics under TOU-J variable and fixed efficiency assumptions

Such a misappropriation of benefits leads to an underestimation in the potential cost of hydrogen production and with a real time implementation would deviate operations from actual optimal use of the system. This shows the importance of increasing the accuracy of the system representation when performing valuation studies to make financial decisions for potential installations, particularly for technologies whose performance can change significantly across its operating range.
Optimal dispatch versus simple operation
The previous section showed how electricity charges for the NELHA research campus would change with the addition of optimally scheduled hydrogen production with the current on-site resources. To be clear, this assumes perfect foresight of the load and solar generation to give the absolute minimum cost for the production of hydrogen while limiting the peak monthly demand as much as possible. While this is a useful metric for valuation studies, in practice this requires real-time forecasting algorithms that would not be able to reach the full optimal results and would necessitate additional controls that could increase the cost of the system. Practically, it may be more beneficial to select a simpler dispatch schedule, which perhaps would not be able to minimize production costs but could be consistently implemented without increasing the cost of the system and with more transparency for operators.
There are many reasonable options for what could be considered a “simple” dispatch method. For instance, the electrolyzer production could be set to a fixed rate during the major hours of solar production to generate the necessary amount of hydrogen. This may increase the peak demand more than is necessary but would utilize low cost solar generation effectively. Conversely, the electrolyzer could be run at a fixed rate 24 hours a day, which would limit the increase in peak demand but not take full advantage of the midday increase in solar generation. Here we compare the cost of hydrogen production using an optimal dispatch to that using constant rates of production from 6am to 6pm (solar utilizing) and 24 hour (peak demand limiting) dispatch schedules. These comparisons give a sense of the financial benefit of optimal dispatch scheduling using forecasting methods in this case. Given the discussion in the previous section, comparisons will be made using the SCH-J rate structure on a $/kg,H2 basis. Figure 6 shows how the timeseries of power purchased from the utility would vary with the three different dispatch methods of the hydrogen production facility.

Figure 6. Net demand profile comparison with different dispatch methods
Constant production from the hydrogen facility increases the peak monthly demand relative to what is possible by optimally varying the demand of the facility. For the amount of solar generation currently available at the research campus, the increase in demand would be far more pronounced if production was limited to the major solar generation hours because the amount of energy being produced would not be sufficient to offset the increase in demand for electrolysis. Furthermore, limiting the hours of operation to half of the day would require operating at a less efficient point for the electrolyzer and increases the amount of energy needed to produce the necessary amount of hydrogen. Table 4 summarizes the projected electricity and hydrogen production costs using different dispatch methods with the current available resources at the research park.
Table 4. Projected annual electricity and hydrogen production cost statistics under SCH-J with different scheduling methods
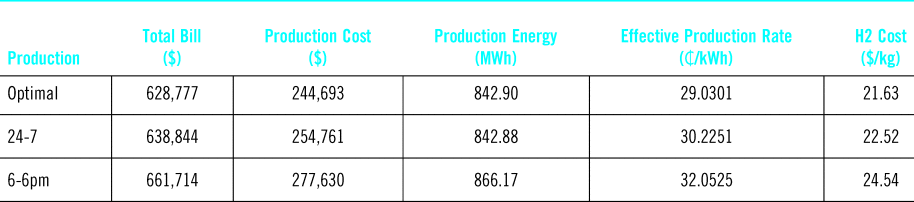
The analysis estimates that limiting production between the hours of 6am and 6pm would increase the production costs by 13.5% relative to the optimal case. By comparison, operating the facility 24 hours a day at a constant rate would only increase production costs by 4.6% relative to the optimal case. This shows that monthly demand charges are a significant driver of the variable production costs in this scenario. Furthermore, it seems that constant around-the-clock operations would be a viable method to keep production costs low for the current system configuration, particularly since optimal methods would not have the benefit of perfect foresight in reality and the optimal cost shown here could not be reached.
Reducing the cost of production
The results from the previous section show that hydrogen production costs at NELHA given the current system configuration will be high, regardless of the mode of operation. We estimate that the optimal cost of hydrogen production is nearly $22/kg; as a kilogram of hydrogen as a similar energy content to a gallon of gasoline, this price does not compare favorably with gasoline prices, even in Hawaii where they are above the national average. Also, it is unclear whether the trends in costs with different scheduling methods would remain the same if the system configuration at the research park would change, for instance with the addition of more solar generation assets. The cost of production in this case is very much a function of the available resources and the unscheduled loads at the NELHA research park.
This brings additional questions to mind as to how the cost competitiveness of hydrogen produced in this scenario could be increased. Is it actually beneficial to pair the hydrogen production with the rest of the NELHA campus load, or would it be better to have the system operate as a standalone facility? How could local resources be changed to reduce the cost of production? How does the cost change with operation as system resources change? To answer these questions, in the following sections we will explore what steps could be taken to reduce the cost of production in this case and trends that could help to identify situations that in which hydrogen production may be cost effective. In the following sections we will investigate potential strategies to reduce the cost of production at the NELHA park, explore how the effect of dispatch scheduling changes with additional renewable generation, and attempt to identify key factors that could lead to inexpensive, behind-the-meter hydrogen production in other applications.
It was shown previously that over 50% of the bill for the research campus would come from energy cost recovery charges. This base rate is very high, typically over 16 ₵/kWh, which alone would make hydrogen production costs high. At the most efficient operating point of the HNEI system, this charge alone would lead to production costs of approximately $10/kg,H2. As this is a fixed energy cost with no time-of-use component, the only way to reduce this portion of the bill is to reduce the amount of energy that needs to be purchased. This suggests that increasing the amount of on-site photovoltaic generation would be one of the only methods to further reduce the electricity charges in this scenario given the large impact of the fixed charges. The current estimates of levelized cost of energy for photovoltaic generation is $32.80/MWh or 3.28₵/kWh,20 which would equate to a hydrogen production cost of approximately $2/kg,H2 if all the hydrogen could be produced from solar generation. While increasing solar generation for hydrogen production would be beneficial, it may not be practical to have this be the sole source of energy for electrolysis as the maximum power of the system would need to be increased significantly to utilize all the solar power.
It is also possible that the cost of production is elevated because the system is paired with the research campus load, which adds constraints to the system that may be difficult to compensate for with variations in the electrolyzer load. Analyses were repeated without the load of the NELHA campus to see how much production costs would be as a standalone system and with increasing amounts of solar generation in the system. The underlying assumption here is that additional solar installations are predominantly for the purpose of hydrogen production, so production costs are calculated relative to the electricity cost of the NELHA campus with the current amount of installed solar capacity. The optimal, 6am-6pm, and 24-7 dispatch schedules were analyzed for each solar level to quantify the importance of optimal dispatch changes with the amount of local generation. The results of these analyses are summarized in Figure 6.
This figure elucidates a few important trends that will likely have general implications on minimizing the cost of hydrogen production in other scenarios.
1) Increasing solar capacity is the main driver for reducing production costs
2) The best dispatch method depends on the amount of solar generation
3) The value of pairing with another load center changes with the amount of solar generation
These points are broken down further below.
The effect of solar generation and operation method
Figure 7 shows how the cost of production would change with increasing solar generation capacity when hydrogen production is paired with the NELHA research park or if the same system were operated independently under the same electricity rate structure. Note that the production costs do not include the cost of the installed solar for simplicity. Regardless of the dispatch schedule of the hydrogen production facility or location of the system, the cost of production initially decreases linearly with increasing solar capacity. This is because the energy cost recovery charges, which again are a flat $/kWh rate, account for the largest portion of the bill. As such, simply reducing the amount of energy that needs to be purchased with additional on-site generation has a direct impact on reducing electricity charges. The analysis shows that approximately doubling the current solar generation from 170kW to 350kW would reduce the cost of production by 26-30% when the system is paired with the NELHA campus load.

Figure 7. Standalone and NELHA park coupled hydrogen production cost versus increasing solar with different operation methods
However, this trend only continues to a certain level of solar penetration, at which point further increases in solar capacity become less effective. With enough installed solar generation, there will be times when more energy is being produced than can be consumed by the electrolysis facility and the rest of the research campus combined. This would occur with an installed capacity above approximately 450-500kW in this case. As there is no net-metering option in effect, any excess energy would need to be curtailed without additional financial benefit. The dispatch schedule also affects the effectiveness of added solar. At low solar penetrations, the 24-7 mode of operation leads to lower production costs, and very nearly approximates the optimal solution. However, as solar production increase, it becomes increasingly important to schedule the load to coincide with the generation and the 6am-6pm mode of operation leads to lower production costs as shown in Figure 8.

Figure 8. NELHA park coupled hydrogen production cost versus solar capacity with different operation methods
The analysis shows a transition from a peak demand limiting focus (24-7 operation) to a solar generation utilization focus (6am-6pm operation) around 500kW of installed solar. The crossing point of course depends on the specifics of the individual case, but it is likely that a similar shift in operational focus would be seen in any situation where demand and energy charges are in effect for production. In all cases, optimal dispatch of course leads to the lowest production costs, and this becomes more pronounced as the installed solar capacity increases. This implies that more advanced control and scheduling methods would do more to reduce the cost of hydrogen production as renewable resources are relied upon more heavily. These trends could likely be applied to any behind-the-meter hydrogen production scenario without net-metering but could be significantly different where net-metering prices are in effect or for front-of-the-meter applications where systems may be able to participate in different market mechanisms.
Potential for standalone production
It is possible that the dependence of optimal electrolyzer dispatch schedule on the load profile of the rest of the research may increase the cost of production. Operating as a standalone unit could be beneficial as decisions could be made to make the best use of the electrolyzer without regard to other demands. To be clear, this is likely not an option for the HNEI system, but could offer some insight into the operation of standalone electrolysis units in other areas. Figure 9 compares the cost of hydrogen production operating the facility as a single unit under SCH-J versus operating at the NELHA research park.

Figure 9. Standalone and NELHA park coupled hydrogen production cost versus increasing solar
At low solar penetration levels, production costs would be lower when operating as a standalone unit rather than coupling the electrolysis system with the load of the rest of the research park. However, as the amount of solar generation increases, there is a distinct benefit to sharing solar generation between multiple loads and ultimately this configuration leads to the lowest production cost potential. This is again because of the lack of net-metering options under SCH-J, making it such that excess generation must simply be curtailed. Pairing multiple loads in high renewable penetration scenarios improves the utilization of renewable energy and maximizes the associated savings potential. Figure 10 shows the annual savings potential with increasing solar capacity for the NELHA research campus, the hydrogen production facility acting as a standalone unit, and when pairing the electrolyzer and research campus loads.

Figure 10. Annual savings from increasing solar generation
The savings potential from solar generation increases significantly when the two loads are paired at high solar penetration levels. If the loads are coupled, energy that would be curtailed in either single load scenario can be utilized by the other load, increasing the overall solar utilization and the resulting savings. In fact, in the very high solar penetration scenarios, the annual savings from solar with coupled loads is 36-45% higher than the same amount of solar for the individual loads. There will be an inherent benefit from locating the electrolyzer on the NELHA campus with future expansions of generation resources, despite the fact that this pairing it is not inherently beneficial with the current level of solar production. Similar symbiotic relationships will likely become possible in other areas as renewable generation assets continue to be installed.
Conclusions
Energy storage and large-scale flexible loads can both have a significant effect on the integration of renewable sources of power. While energy storage systems such as batteries can shift generation to match demand, flexible loads can also be used to shift demand to match generation to accomplish similar goals. A good example of this paradigm is the NELHA research campus, which is beginning the operation of an electrolysis facility to produce hydrogen for fuel cell buses on the Island of Hawaii. Here we have projected the cost of hydrogen production at the research campus with both simple and optimal dispatch scheduling methods given the loads of the campus and the available electricity rate structure options. These analyses revealed important considerations for NELHA that could also have implications for behind-the-meter hydrogen production in other areas.
Firstly, the cost of hydrogen production and the appropriate method of operation is highly dependent on the prevailing electricity rate structure. The common assumption is that a time-of-use rate structures would benefit hydrogen production as the flexibility of the load makes it possible to shift production to low-cost times of day. However, this analysis shows that this is not necessarily the case. Here, the time-of-use rate structure was actually shown to be the more expensive option because:
1) The low-cost window was too short to produce the daily demand of hydrogen with the given system, so some production would need to be done at higher prices
2) The demand charge does not have a time-of-use component, so limiting the production window increases demand charges
3) Limiting the production window requires high power operation, which lowers efficiency and increases the amount of electricity that is necessary for production
4) The available time-of-use rate structure still includes a large, flat $/kWh energy cost recovery charge that represents a large portion of the bill.
If any or all of these factors were different, the projected cost of hydrogen production could change significantly. This shows the importance of a thorough valuation study for hydrogen production, considering changes in efficiency throughout the operating window, to understand the potential for hydrogen production in a behind-the-meter scenario.
Further, we looked at what steps could be taken to reduce the price of hydrogen production at the NELHA research campus and found that the major driver for reduced costs would be increasing the amount of on-site solar generation. Nearly 50% of the NELHA research campus electricity bill is due to energy cost recovery charges, which can only be reduced by decreasing the amount of energy that is purchased from the local utility. Analyses regarding the effect of increasing solar penetration on the cost of hydrogen produced also showed that pairing the electrolyzer loads with the research campus load would be mutually beneficial with higher levels of solar generation. Pairing loads improves the solar utilization by using energy that would have to be curtailed by either load individually given their peak power demands (~200kW for the research campus, ~250kW for the electrolyzer). Furthermore, optimal scheduling of the electrolyzer load would play a key role in the cost of production with more solar assets. In general it is most important to limit the increase in peak demand with constant, low power production at low solar penetrations, but the focus shifts to aligning hydrogen production with solar generation with high solar penetration levels. Optimal scheduling of the electrolyzer load using forecasting methods would have a bigger effect on the cost of production with more renewable resources as well.
The primary goal of this study was to determine the cost of hydrogen production at the NELHA research campus given the rate structure options for the campus, but this does have implications on the potential for hydrogen production in other behind-the-meter scenarios. Time-of-use energy charges can be beneficial, but the length of the low-cost energy windows and the specifics of the demand charges are important associated considerations as well. If the length of the low-cost window is not long enough to produce the daily hydrogen demand, of if peak electricity demand charges do not also have a time-of-use component, time-of-use pricing may not be a good option. Also, pairing of flexible loads with other load centers is mutually beneficial with high levels of solar generation; optimal load scheduling using generation forecasting methods would be necessary to maximize value in this case. As regions increase their dependence on intermittent sources of generation, the value proposition of flexible hydrogen production will increase to improve the utilization of these resources. Future work will look at the potential for hydrogen production in front-of-the-meter scenarios and in conjunction with renewable based microgrids, as well as the potential of integrating a fuel cell with a hydrogen storage facility to inject power into the electric grid.
Acknowledgments
Funding for this analysis was provided by the US DOE Energy Storage Program managed by Dr. Imre Gyuk of the DOE Office of Electricity Delivery and Energy Reliability. Support was also provided by US DOE Fuel Cell and Hydrogen program, Office of Naval Research (ONR), State of Hawaii, and Natural Energy Laboratory of Hawaii Authority (NELHA) to establish the infrastructure for the electrolysis facility at NELHA's research park. We would specifically like to thank Laurence Sombardier and Keith Olson at NELHA for providing the research park electricity demand data for this analysis.
Sandia National Laboratories is a multi-mission laboratory managed and operated by National Technology and Engineering Solutions of Sandia, LLC., a wholly owned subsidiary of Honeywell International, Inc., for the U.S. Department of Energy's National Nuclear Security Administration under contract DE-NA-0003525. This paper describes objective technical results and analysis. Any subjective views or opinions that might be expressed in the paper do not necessarily represent the views of the U.S. Department of Energy or the United States Government.


 Open access