


1 Introduction
Deuterated potassium dihydrogen phosphate (DKDP) crystals are optical materials with excellent properties, such as high transmittance, high electro-optic coefficient and high laser damage threshold, which are widely used for frequency conversion and as electro-optical $Q$
-switching crystals in inertial confinement fusion (ICF) projects[Reference Zaitseva, De Yoreo, Dehaven, Vital, Montgomery, Richardson and Atherton1–Reference De Yoreo, Burnham and Whitman3]. In particular, DKDP crystals can grow to very large apertures, up to 900 mm by the water solution method[Reference Zaitseva and Carman2]. Due to a hydrogen atom being replaced by a deuterium atom, DKDP crystals have a few differences in performance compared with potassium dihydrogen phosphate (KDP) crystals, including a weak stimulated Raman scattering (SRS) effect[Reference Han, Wang, Zhou, Li, Feng, Cao, Zhao, Li, Zheng, Wei, Gong and Zheng4–Reference Han, Xiang, Li, Wang, Zhou, Zhao, Feng, Zheng, Zhu, Wei, Zheng and Gong6] and a low half-wave control voltage, which is about half that of KDP crystals[Reference Vakulenko, Kryukov, Matveets, Panteleev, Senatskii, Fedosimov and Yurov7]. As the number of deuterium atoms increases, the electro-optic properties become better[Reference Zhang, Yu, Zhou, Li, Xu, Liu, Ji, Zhu, Liu and Sun8]. The ICF project chooses large-aperture, highly deuterated DKDP crystals as electro-optic switch materials[Reference Baisden, Atherton, Hawley, Land, Menapace, Miller, Runkel, Spaeth, Stolz, Suratwala, Wegner and Wong9]. However, the growth of large-size, 98%-deuterated DKDP crystals faces many difficulties, such as disturbance of the monoclinic DKDP crystal during the growth of the tetragonal DKDP crystal, hydrogen–deuterium exchange, and the need for expensive heavy water[Reference Zhang, Yu, Zhou, Li, Xu, Liu, Ji, Zhu, Liu and Sun8, Reference Wang, Gao, Fu, Duan, Sun, Fang and Wang10]. To date, there have been very few reports on the growth of highly deuterated DKDP crystals.
$Q$
-switching crystals in inertial confinement fusion (ICF) projects[Reference Zaitseva, De Yoreo, Dehaven, Vital, Montgomery, Richardson and Atherton1–Reference De Yoreo, Burnham and Whitman3]. In particular, DKDP crystals can grow to very large apertures, up to 900 mm by the water solution method[Reference Zaitseva and Carman2]. Due to a hydrogen atom being replaced by a deuterium atom, DKDP crystals have a few differences in performance compared with potassium dihydrogen phosphate (KDP) crystals, including a weak stimulated Raman scattering (SRS) effect[Reference Han, Wang, Zhou, Li, Feng, Cao, Zhao, Li, Zheng, Wei, Gong and Zheng4–Reference Han, Xiang, Li, Wang, Zhou, Zhao, Feng, Zheng, Zhu, Wei, Zheng and Gong6] and a low half-wave control voltage, which is about half that of KDP crystals[Reference Vakulenko, Kryukov, Matveets, Panteleev, Senatskii, Fedosimov and Yurov7]. As the number of deuterium atoms increases, the electro-optic properties become better[Reference Zhang, Yu, Zhou, Li, Xu, Liu, Ji, Zhu, Liu and Sun8]. The ICF project chooses large-aperture, highly deuterated DKDP crystals as electro-optic switch materials[Reference Baisden, Atherton, Hawley, Land, Menapace, Miller, Runkel, Spaeth, Stolz, Suratwala, Wegner and Wong9]. However, the growth of large-size, 98%-deuterated DKDP crystals faces many difficulties, such as disturbance of the monoclinic DKDP crystal during the growth of the tetragonal DKDP crystal, hydrogen–deuterium exchange, and the need for expensive heavy water[Reference Zhang, Yu, Zhou, Li, Xu, Liu, Ji, Zhu, Liu and Sun8, Reference Wang, Gao, Fu, Duan, Sun, Fang and Wang10]. To date, there have been very few reports on the growth of highly deuterated DKDP crystals.
The traditional temperature-reduction method for producing crystals has been widely used to grow large-size, highly deuterated DKDP crystals, which requires a long period of more than one year[Reference Zaitseva and Carman2, Reference Jiang, Fang, Yu, Wang, Zheng and Gao11, Reference Zaitseva, Rashkovich and Bogatyreva12]. It is difficult to supply enough DKDP crystals by the traditional method, so a rapid-growth technology is being urgently studied for highly deuterated DKDP crystals. In 2014, Zhang et al.
[Reference Zhang, Yu, Zhou, Li, Xu, Liu, Ji, Zhu, Liu and Sun8] reported that DKDP crystals with a deuterium content of 98% and sizes of $100~\text{mm}\times 105~\text{mm}\times 96~\text{mm}$
were successfully grown by point-seed technology. The tetragonal-to-monoclinic solubility transition can be avoided by the rapid-growth technique[Reference Wang, Gao, Fu, Duan, Sun, Fang and Wang10]. It is essential that a rapid-growth method is used for the growth of highly deuterated DKDP crystals by the point-seed technique. The growth of large-size, highly deuterated DKDP crystals is affected by many factors[Reference Wang, Gao, Fu, Duan, Sun, Fang and Wang10, Reference Zhang, Zhang, Xu, Wang and Sun13], such as the need for highly pure raw materials, supersaturation stability, ultrafine filtration, the rate of hydrogen–deuterium exchange, and the disturbance of the monoclinic crystal. At present, large-scale, high-quality, highly deuterated DKDP crystals are urgently needed for ICF projects, and researchers are seeking to make a breakthrough. In this paper, we designed a synthesis tank device to prepare a high-deuterium content DKDP crystal solution. A highly deuterated DKDP crystal was grown rapidly by the point-seed technique and continuous filtration, with a size of more than 300 mm, and the crystal quality was examined.
$100~\text{mm}\times 105~\text{mm}\times 96~\text{mm}$
were successfully grown by point-seed technology. The tetragonal-to-monoclinic solubility transition can be avoided by the rapid-growth technique[Reference Wang, Gao, Fu, Duan, Sun, Fang and Wang10]. It is essential that a rapid-growth method is used for the growth of highly deuterated DKDP crystals by the point-seed technique. The growth of large-size, highly deuterated DKDP crystals is affected by many factors[Reference Wang, Gao, Fu, Duan, Sun, Fang and Wang10, Reference Zhang, Zhang, Xu, Wang and Sun13], such as the need for highly pure raw materials, supersaturation stability, ultrafine filtration, the rate of hydrogen–deuterium exchange, and the disturbance of the monoclinic crystal. At present, large-scale, high-quality, highly deuterated DKDP crystals are urgently needed for ICF projects, and researchers are seeking to make a breakthrough. In this paper, we designed a synthesis tank device to prepare a high-deuterium content DKDP crystal solution. A highly deuterated DKDP crystal was grown rapidly by the point-seed technique and continuous filtration, with a size of more than 300 mm, and the crystal quality was examined.
2 Experiment
2.1 Synthesis
Synthesis of the growth solution is the most important factor for the growth of highly deuterated DKDP crystals. The usual procedure was adopted to synthesize the high-deuterium concentration growth solution, which was divided into two steps. First, a phosphorus pentoxide ( $\text{P}_{2}\text{O}_{5}$
) reagent of electronic grade (99.9995%) reacted with heavy water of isotopic purity (99.8%). Then, the deuterated ortho-phosphoric acid obtained in the first step reacted with spectrum-pure grade (purity of 99.999%) potassium carbonate (
$\text{P}_{2}\text{O}_{5}$
) reagent of electronic grade (99.9995%) reacted with heavy water of isotopic purity (99.8%). Then, the deuterated ortho-phosphoric acid obtained in the first step reacted with spectrum-pure grade (purity of 99.999%) potassium carbonate ( $\text{K}_{2}\text{CO}_{3}$
). The concentrations of the main metallic ionic impurities in the raw materials are listed in Tables 1 and 2. The results in Tables 1 and 2 show that the ingredients are with high purity and can be used for the preparation of the DKDP solution. The reactions are as follows:
$\text{K}_{2}\text{CO}_{3}$
). The concentrations of the main metallic ionic impurities in the raw materials are listed in Tables 1 and 2. The results in Tables 1 and 2 show that the ingredients are with high purity and can be used for the preparation of the DKDP solution. The reactions are as follows:
 $$\begin{eqnarray}\displaystyle & \displaystyle \text{P}_{2}\text{O}_{5}+3\text{D}_{2}\text{O}\rightarrow 2\text{D}_{3}\text{PO}_{4},\qquad \qquad & \displaystyle\end{eqnarray}$$
 $$\begin{eqnarray}\displaystyle & \displaystyle 2\text{D}_{3}\text{PO}_{4}+\text{K}_{2}\text{CO}_{3}+\text{D}_{2}\text{O}\qquad \qquad & \displaystyle \nonumber\\ \displaystyle & \displaystyle \rightarrow 2\text{KD}_{2}\text{PO}_{4}+2\text{D}_{2}\text{O}+\text{CO}_{2}\uparrow . & \displaystyle\end{eqnarray}$$
Table 1. Concentration of the main metallic ionic impurities in $\text{P}_{2}\text{O}_{5}$
raw material (ppb, parts per billion).
$\text{P}_{2}\text{O}_{5}$
raw material (ppb, parts per billion).

Table 2. Concentration of the main metallic ionic impurities in $\text{K}_{2}\text{CO}_{3}$
raw material (ppb, parts per billion).
$\text{K}_{2}\text{CO}_{3}$
raw material (ppb, parts per billion).

To avoid hydrogen–deuterium exchange, a synthesis tank device was designed to provide a closed environment for these two reactions. The schematic of the synthesis tank device is shown in Figure 1. It includes the synthesis container, a cooling system, a control system and a heating unit, and synthesizes large batches (volume of 100 L) of the growth solution with high purity. The device features highly automated continuous production and high accuracy, and is simple to use compared with the conventional synthesis device.

Figure 1. Schematic of the 100 L synthesis tank device. 1, vibrating table; 2, heating unit; 3, synthesis container; 4, cooling system; 5, control system.
Before the reactions, $\text{K}_{2}\text{CO}_{3}$
was dried at
$\text{K}_{2}\text{CO}_{3}$
was dried at $105~^{\circ }\text{C}$
for more than 12 h to desiccate and reduce the deuterium loss. During the reactions, the tank was placed in a dry environment with a humidity of less than 20%. The saturated temperature of the solution was controlled to
$105~^{\circ }\text{C}$
for more than 12 h to desiccate and reduce the deuterium loss. During the reactions, the tank was placed in a dry environment with a humidity of less than 20%. The saturated temperature of the solution was controlled to $47~^{\circ }\text{C}$
and the pD value (deuterium ion concentration, pD is similar to pH) was adjusted to 3.9 by calculating the quantity of the raw materials. After the process, the synthesized solution was filtered through a
$47~^{\circ }\text{C}$
and the pD value (deuterium ion concentration, pD is similar to pH) was adjusted to 3.9 by calculating the quantity of the raw materials. After the process, the synthesized solution was filtered through a $0.1~\unicode[STIX]{x03BC}\text{m}$
pump and transferred to the crystallizer.
$0.1~\unicode[STIX]{x03BC}\text{m}$
pump and transferred to the crystallizer.
2.2 Crystal growth
The solution was overheated for more than 72 h in the 500-L standard hold-type crystallizer to avoid spontaneous nucleation. The highly deuterated DKDP crystal was grown rapidly from a $12~\text{mm}\times 12~\text{mm}\times 6~\text{mm}$ $z$
-cut point seed in the 500-L crystallizer with a continuous filtration system and a temperature control of
$z$
-cut point seed in the 500-L crystallizer with a continuous filtration system and a temperature control of $\pm 0.1~^{\circ }\text{C}$
. The seed, which was free of any visible macroscopic defects, was overheated at
$\pm 0.1~^{\circ }\text{C}$
. The seed, which was free of any visible macroscopic defects, was overheated at $52~^{\circ }\text{C}$
for 1 h in the growth solution before growth. During the DKDP crystal growth process, the solution was stable without spontaneous nucleation as the temperature decreased from 47 to
$52~^{\circ }\text{C}$
for 1 h in the growth solution before growth. During the DKDP crystal growth process, the solution was stable without spontaneous nucleation as the temperature decreased from 47 to $38~^{\circ }\text{C}$
and a rotation rate for the platform was adopted with a speed of about 30 r/min.
$38~^{\circ }\text{C}$
and a rotation rate for the platform was adopted with a speed of about 30 r/min.
The as-grown crystal was $318~\text{mm}\times 313~\text{mm}\times 265~\text{mm}$
in size without significant macroscopic defects, with an average growth rate of about
$318~\text{mm}\times 313~\text{mm}\times 265~\text{mm}$
in size without significant macroscopic defects, with an average growth rate of about $6~\text{mm}\cdot \text{day}^{-1}$
, as shown in Figure 2. After X-ray orientation and
$6~\text{mm}\cdot \text{day}^{-1}$
, as shown in Figure 2. After X-ray orientation and $z$
-cut, a
$z$
-cut, a $315~\text{mm}\times 312~\text{mm}\times 12~\text{mm}$
DKDP crystal wafer was obtained, which was annealed at
$315~\text{mm}\times 312~\text{mm}\times 12~\text{mm}$
DKDP crystal wafer was obtained, which was annealed at $120~^{\circ }\text{C}$
for 24 h and used to provide switching devices for the performance examination. Details of the DKDP crystal production process are shown in Figure 2.
$120~^{\circ }\text{C}$
for 24 h and used to provide switching devices for the performance examination. Details of the DKDP crystal production process are shown in Figure 2.
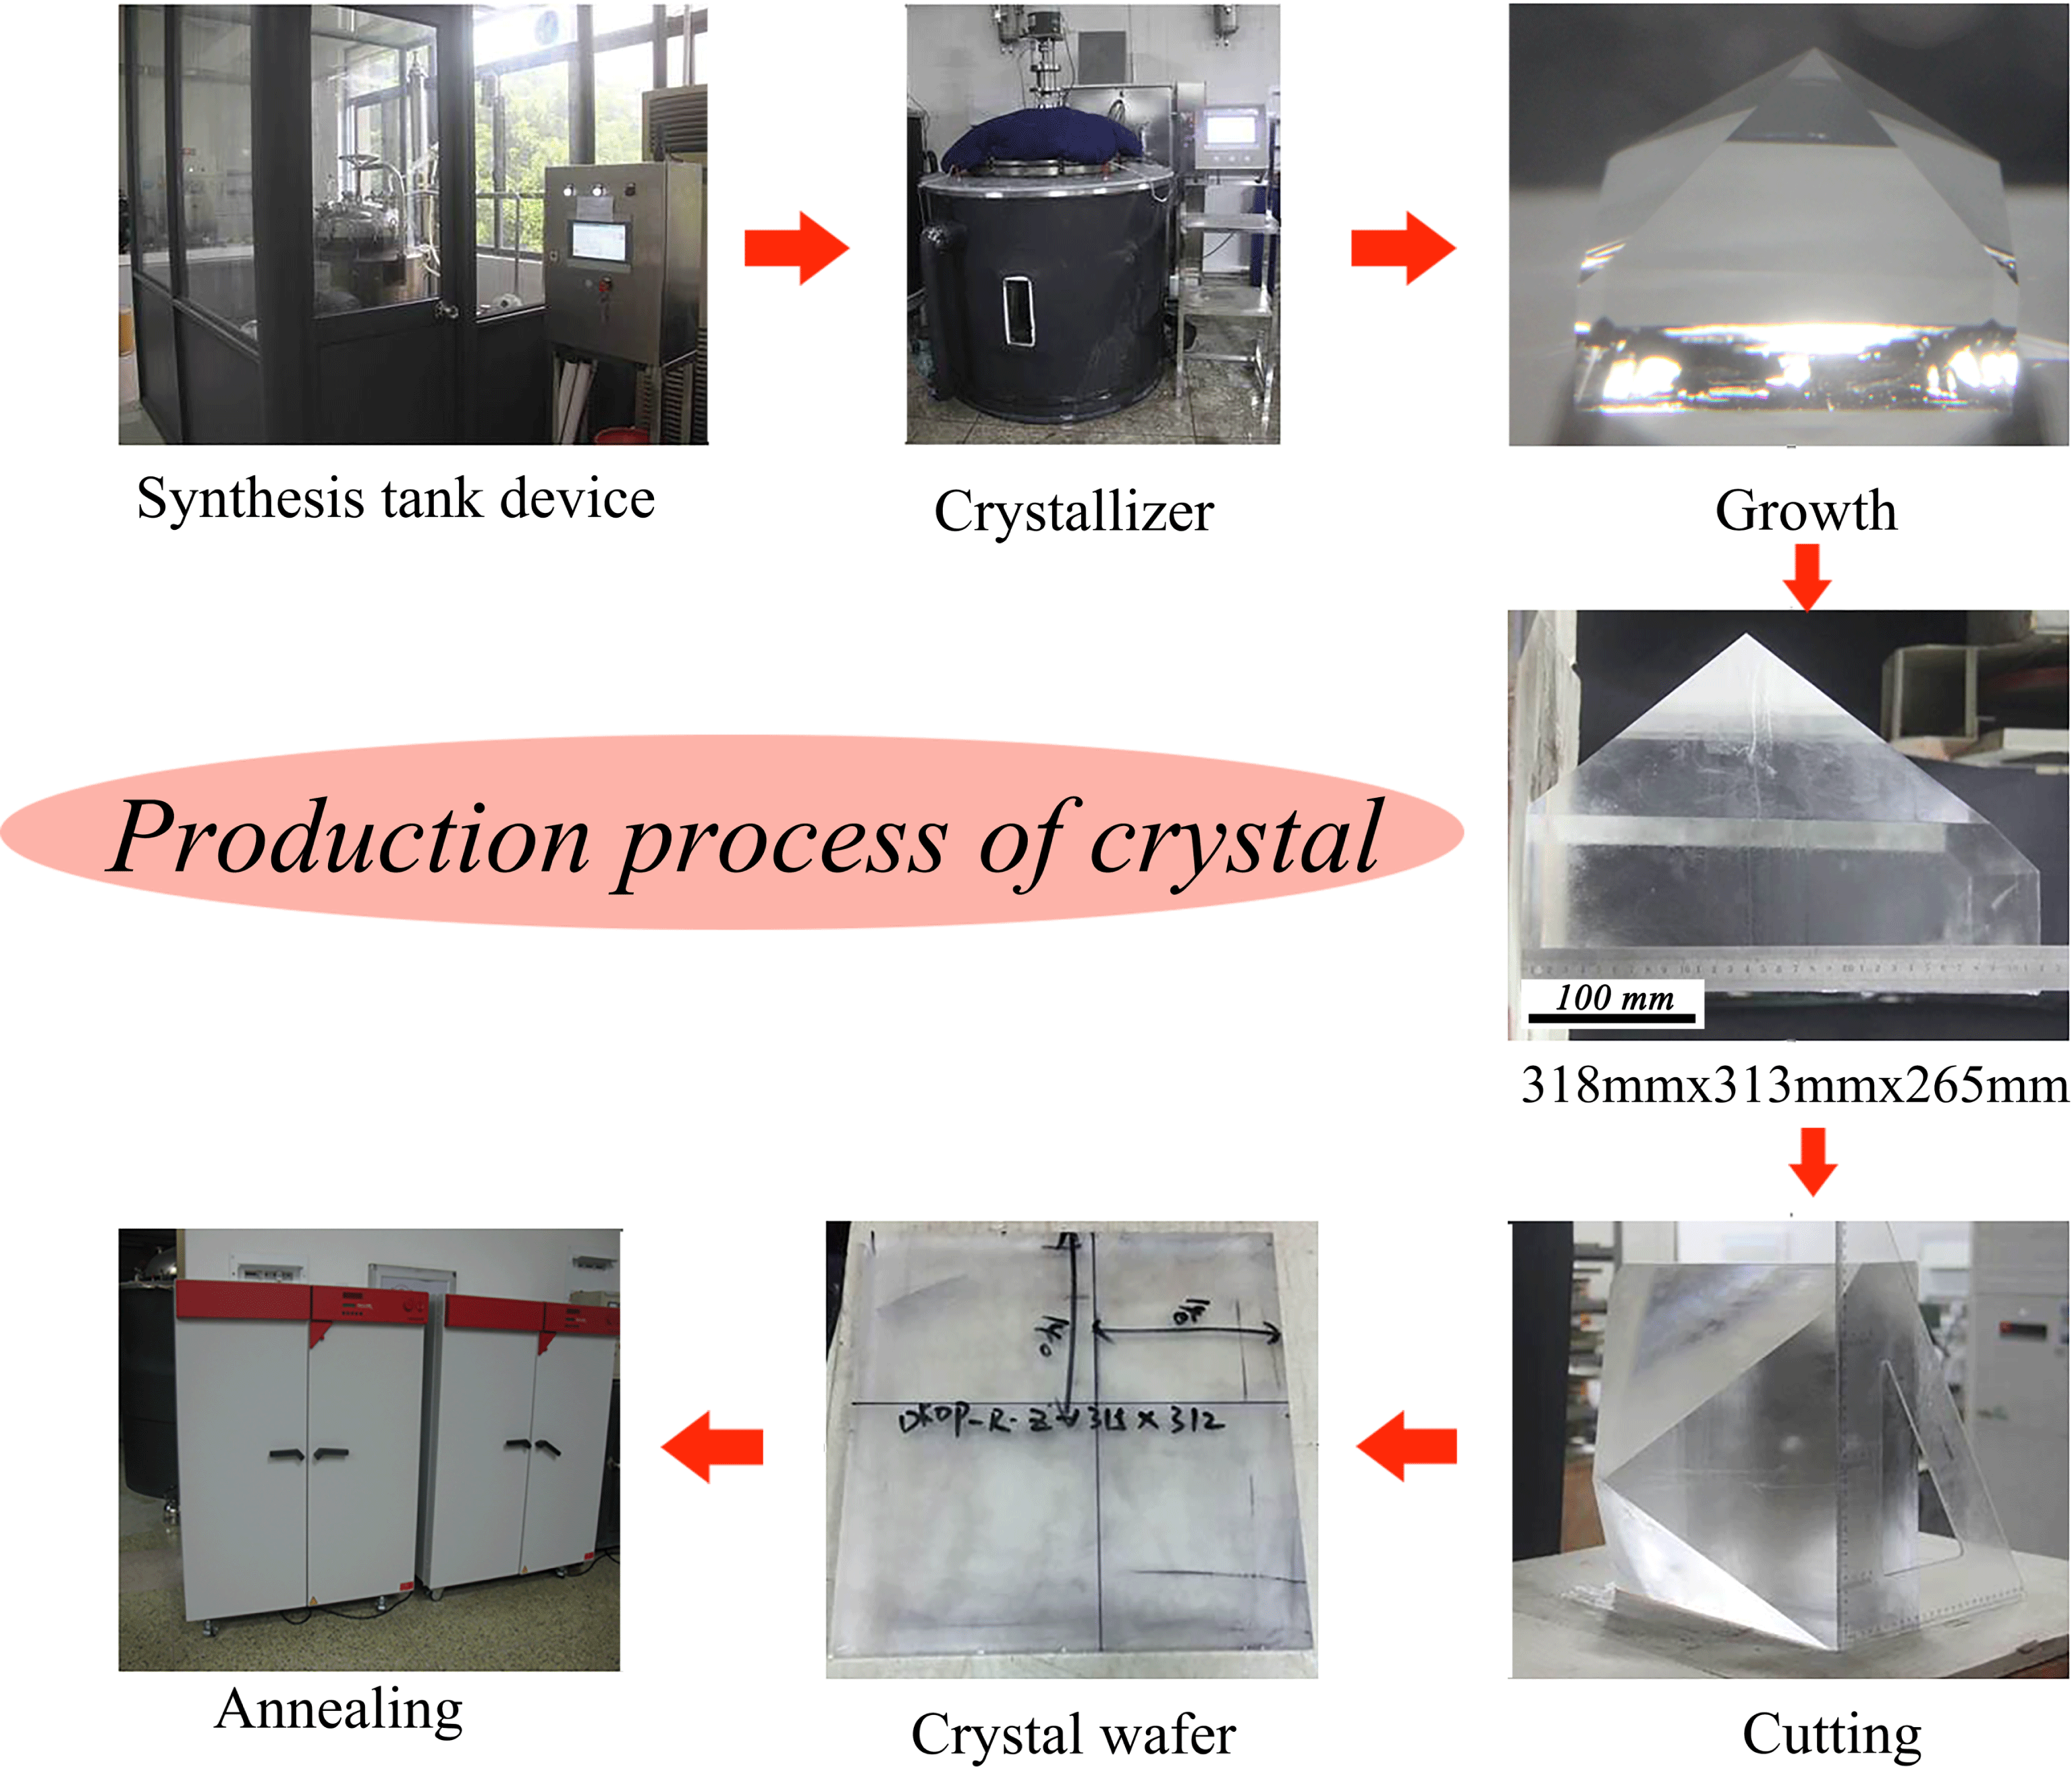
Figure 2. Details of the DKDP crystal production process, including synthesis, growth, cutting and annealing.
2.3 Measurements
Transmittance spectra of the crystal were recorded by a Lambda 950 ultraviolet–visible–near-infrared (UV–vis–NIR) spectrophotometer in the range 200–2000 nm. The spectral resolution of the spectrophotometer was 1 nm. The transmittance value was converted into the absorption coefficient according to the Lambert–Beer law.
The laser-induced damage threshold (LIDT) of DKDP crystals was measured by the Shanghai Institute of Optics and Fine Mechanics. The experimental setup for assessing the damage threshold is shown in Figure 3. The damage threshold was measured by the R-on-1 test. The test wavelength was 1064 nm with a pulse length of 8.8 ns and a $1\unicode[STIX]{x1D714}$
conversion efficiency. For the sake of engineering applications, test results at 8.8 ns were eventually normalized to 3 ns.
$1\unicode[STIX]{x1D714}$
conversion efficiency. For the sake of engineering applications, test results at 8.8 ns were eventually normalized to 3 ns.

Figure 3. Experimental setup for measuring the LIDT, including shutter, waveplate, polarizer, focus lens, beam profiler and bulk detection.
3 Results and discussion
3.1 Deuterium content of the grown crystal
In DKDP crystals, especially high-deuterium crystal, an accurate measurement of the deuterium concentration is very important. The chemical and physical properties of the hydrogen and deuterium atoms in the DKDP crystal, such as the structural dimensions, bond lengths and bond angles, are closely related to the deuterium content of DKDP crystals[Reference Fu, Zhang and Xiong14, Reference Demos, DeMange, Negres and Feit15]. There are multiple methods available to determine the deuterium level. These methods depend on different principles to measure the deuterium concentration[Reference Yakshin, Kim, Kim, Broslavets, Sidoryuk and Goldstein16–Reference Li, Su, Zhuang, Li and He20], such as the variation in the ferroelectric transition temperature of DKDP, the relationship between the deuterium concentration and the Raman shift of the $\text{PO}_{4}$
vibration peak, the sensitivity of neutrons to hydrogen and deuterium elements, differences in the infrared spectra of hydrogen and deuterium atoms, and the thermo-decomposition of DKDP and KDP crystals, as described in the present literature concerned. These methods have both advantages and drawbacks.
$\text{PO}_{4}$
vibration peak, the sensitivity of neutrons to hydrogen and deuterium elements, differences in the infrared spectra of hydrogen and deuterium atoms, and the thermo-decomposition of DKDP and KDP crystals, as described in the present literature concerned. These methods have both advantages and drawbacks.
Liu et al.
[Reference Liu, Xu, Liu, Chen, Xie, Xia, Wen, Zhang, Ju, Sun and Sun21] concluded that infrared (IR) spectra present more accurate values for high-deuterium content DKDP crystals. Li et al.
[Reference Li, Su, Zhuang, Li and He20] concluded that thermo-gravimetric apparatus (TGA) measurement is an accurate method because the residual mass, which is the weight ratio of $\text{KPO}_{3}$
against DKDP samples, can be obtained from the TG curve of the sample accurately using thermo-gravimetric apparatus. The TGA method has the advantages of simple manipulation, low sample consumption (30–90 mg) and a short measurement period (about 2.5 h). Therefore, we used IR spectroscopy and TGA measurements to determine the deuterium content of the as-grown DKDP crystal in this study.
$\text{KPO}_{3}$
against DKDP samples, can be obtained from the TG curve of the sample accurately using thermo-gravimetric apparatus. The TGA method has the advantages of simple manipulation, low sample consumption (30–90 mg) and a short measurement period (about 2.5 h). Therefore, we used IR spectroscopy and TGA measurements to determine the deuterium content of the as-grown DKDP crystal in this study.
The as-grown DKDP crystal was $z$
-cut to obtain samples with sizes of
$z$
-cut to obtain samples with sizes of $10~\text{mm}\times 10~\text{mm}\times 20~\text{mm}$
. These samples were obtained from prismatic and pyramid regions of the crystal, with the location of the samples shown in Figure 4. The samples were then lapped and polished without any coating. The IR spectra were measured in the range 200–1800 nm for 20 mm thick
$10~\text{mm}\times 10~\text{mm}\times 20~\text{mm}$
. These samples were obtained from prismatic and pyramid regions of the crystal, with the location of the samples shown in Figure 4. The samples were then lapped and polished without any coating. The IR spectra were measured in the range 200–1800 nm for 20 mm thick $z$
-cut specimens. The recorded spectra are shown in Figure 5. Based on years of experimental results, a database has been established for the deuterium level and the optical transmission (@1550 nm). This database is constantly revised based on theory (Fresnel losses) and experiments, and the results of the database are reliable. Using this database, the transmission (@1550 nm) can be converted into the deuteration levels which are shown in Table 3. From Table 3, the deuterium concentrations of samples 2 and 4 are a little higher than those of samples 1 and 3. However, the difference is not significant, thus showing excellent homogeneity in the deuterium level. The average value of the deuterium content is 97.9%.
$z$
-cut specimens. The recorded spectra are shown in Figure 5. Based on years of experimental results, a database has been established for the deuterium level and the optical transmission (@1550 nm). This database is constantly revised based on theory (Fresnel losses) and experiments, and the results of the database are reliable. Using this database, the transmission (@1550 nm) can be converted into the deuteration levels which are shown in Table 3. From Table 3, the deuterium concentrations of samples 2 and 4 are a little higher than those of samples 1 and 3. However, the difference is not significant, thus showing excellent homogeneity in the deuterium level. The average value of the deuterium content is 97.9%.
Table 3. Results for the deuterium level of DKDP crystal as assessed from IR spectra.

Figure 4. Locations of the samples used in infrared (IR) spectra measurements.

Figure 5. IR spectra. The recorded spectra were measured by a spectrophotometer in the range 200–1800 nm.
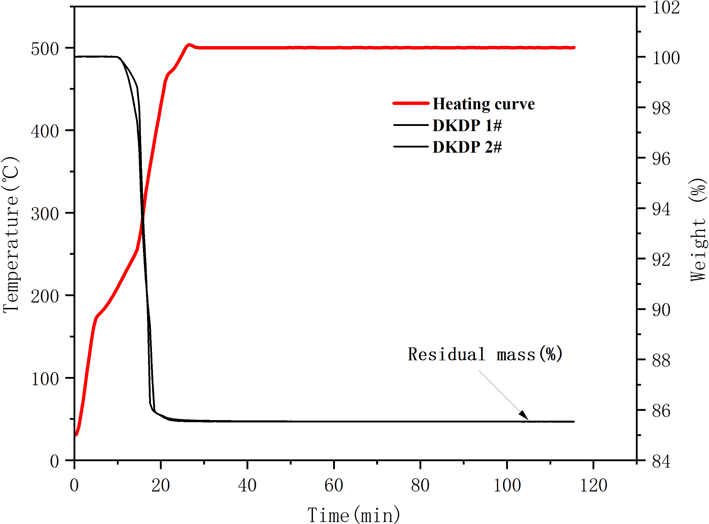
To accurately measure the degree of deuteration of crystals, we also used the TGA method to determine the deuterium concentration of the as-grown DKDP crystal. Samples of approximately 80 mg from different parts of the as-grown DKDP crystal were selected for measurement of the thermo-gravimetric curve. Samples 1 and 2 were taken from the pyramid and prismatic regions of the crystal, respectively, with the location of each sample being shown in Figure 6.

Figure 6. Locations of the samples used in TGA measurements.
The TG curves of the DKDP crystals are shown in Figure 7. The results for the residual weight of DKDP crystals are listed in Table 4. Equation (3) was used to calculate the deuterium concentration of the DKDP crystals, as follows[Reference Li, Su, Zhuang, Li and He20]:
 $$\begin{eqnarray}D=\left(\frac{58.699}{\unicode[STIX]{x1D6FC}}-67.62\right)\times 100\%,\end{eqnarray}$$
where $D$
is the deuterium level of the DKDP crystal and
$D$
is the deuterium level of the DKDP crystal and $\unicode[STIX]{x1D6FC}$
is the residual mass. The average value for the degree of deuteration of crystals is 96.94% by the TGA method. The deuterium level of sample 1 from the pyramid region is a little higher than that of sample 2 from the prism region. The deuterium concentration of the pyramid region is higher than that of the prismatic region, but the difference is not obvious. From the results for the deuterium level assessed both by IR spectroscopy and TGA measurements, it is clear that the as-grown crystal possesses good homogeneity in its deuterium concentration. The results obtained from IR spectroscopy are slightly higher than those from TGA measurements. IR spectroscopy is more suitable for measuring highly deuterated DKDP crystals – therefore, the value of 97.9% measured by IR spectroscopy is used as the measured value of the deuteration level of the as-grown DKDP crystal.
$\unicode[STIX]{x1D6FC}$
is the residual mass. The average value for the degree of deuteration of crystals is 96.94% by the TGA method. The deuterium level of sample 1 from the pyramid region is a little higher than that of sample 2 from the prism region. The deuterium concentration of the pyramid region is higher than that of the prismatic region, but the difference is not obvious. From the results for the deuterium level assessed both by IR spectroscopy and TGA measurements, it is clear that the as-grown crystal possesses good homogeneity in its deuterium concentration. The results obtained from IR spectroscopy are slightly higher than those from TGA measurements. IR spectroscopy is more suitable for measuring highly deuterated DKDP crystals – therefore, the value of 97.9% measured by IR spectroscopy is used as the measured value of the deuteration level of the as-grown DKDP crystal.
The effective distribution coefficient of deuterium is described by the following exponential equation[Reference Loiacono, Balascio and Osborne17]:
 $$\begin{eqnarray}k_{\text{eff}}=0.68\exp (0.00382M),\end{eqnarray}$$
where $M$
is the mole fraction of deuterium in the solution and
$M$
is the mole fraction of deuterium in the solution and $k_{\text{eff}}$
is the effective distribution coefficient of deuterium. The deuterium concentration of the mother solution is about 99%. Hence, the deuterium level of the as-grown crystal is about 98% according to the exponential equation. Two methods were used to determine the deuterium content of the as-grown DKDP crystals: IR spectroscopy and TGA measurements of the deuterium concentration give 97.9% and 96.9%, respectively, which are lower than the value calculated by the exponential equation. Because of the effect of hydrogen–deuterium exchange, the deuterium concentration of the solution decreased during the growth of the DKDP crystal. However, in this experiment, it can be ascertained that the deuterium level of the as-grown DKDP crystal was more than 96% with both measuring methods, and the as-grown crystal is a highly deuterated DKDP crystal as used in the optical components.
$k_{\text{eff}}$
is the effective distribution coefficient of deuterium. The deuterium concentration of the mother solution is about 99%. Hence, the deuterium level of the as-grown crystal is about 98% according to the exponential equation. Two methods were used to determine the deuterium content of the as-grown DKDP crystals: IR spectroscopy and TGA measurements of the deuterium concentration give 97.9% and 96.9%, respectively, which are lower than the value calculated by the exponential equation. Because of the effect of hydrogen–deuterium exchange, the deuterium concentration of the solution decreased during the growth of the DKDP crystal. However, in this experiment, it can be ascertained that the deuterium level of the as-grown DKDP crystal was more than 96% with both measuring methods, and the as-grown crystal is a highly deuterated DKDP crystal as used in the optical components.

Figure 7. Thermo-gravimetric curve of DKDP crystals. The red curve represents the heating curve and the two black curves represent the TG curve of DKDP.
Table 4. Results of the residual mass and deuterium level of DKDP.

3.2 Optical properties of DKDP crystal
Highly deuterated DKDP crystals with excellent optical properties are widely used for optical applications. The absorption coefficient of DKDP crystals is a significant parameter used to assess the optical properties and quality of crystals, which was measured from the transmission spectra in this paper. Samples of $15~\text{mm}\times 15~\text{mm}$
were
$15~\text{mm}\times 15~\text{mm}$
were $z$
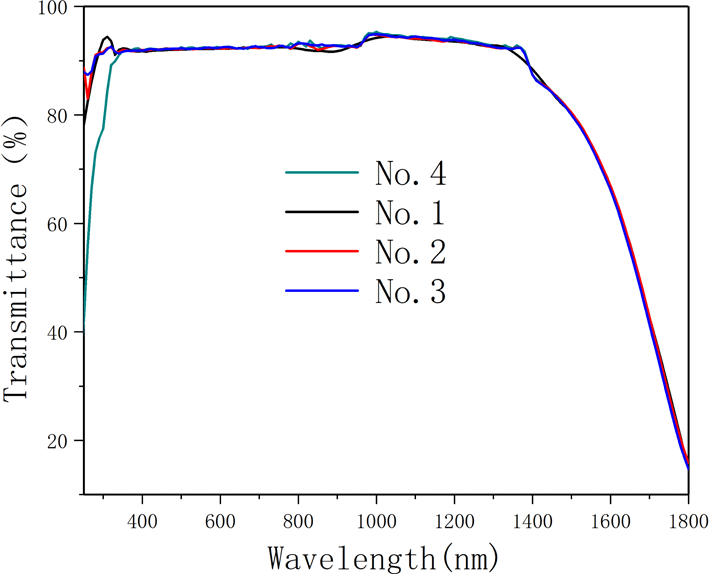
-cut from the pyramid region of the large DKDP crystal (the schematic cutting diagram is shown in Figure 8). The samples were processed into plates of 10 mm thickness and the transmitting faces of the crystal were fine polished without coating by a fly-cutting machine tool until they were free of scratches and the sample became transparent. Optical transmission spectra recorded by a spectrophotometer (Lambda 950) in the range 200–2000 nm at room temperature are shown in Figure 9. We also measured the transmission spectra of 70% DKDP and KDP crystals under the same conditions.
$z$
-cut from the pyramid region of the large DKDP crystal (the schematic cutting diagram is shown in Figure 8). The samples were processed into plates of 10 mm thickness and the transmitting faces of the crystal were fine polished without coating by a fly-cutting machine tool until they were free of scratches and the sample became transparent. Optical transmission spectra recorded by a spectrophotometer (Lambda 950) in the range 200–2000 nm at room temperature are shown in Figure 9. We also measured the transmission spectra of 70% DKDP and KDP crystals under the same conditions.

Figure 8. Schematic cutting diagram for the different DKDP samples.

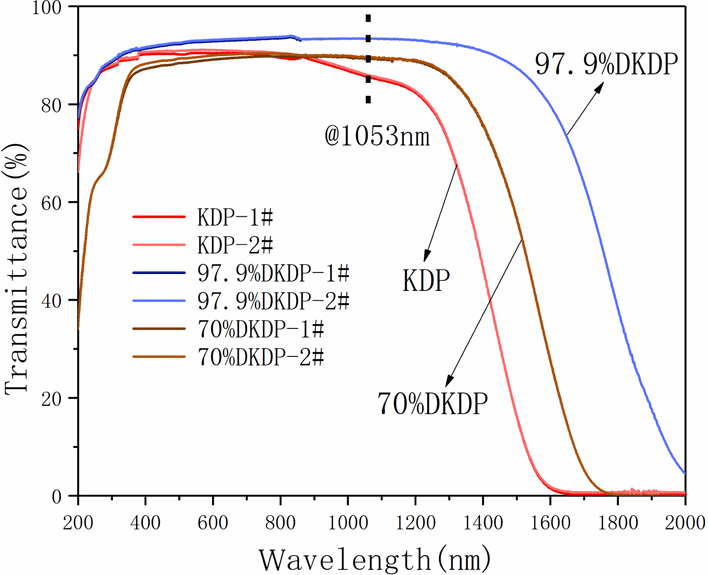
Figure 9. Transmission spectra of different deuterium concentration DKDP and DKP crystals. The blue curve represents 97.9% DKDP crystal, the brown curve represents 70% DKDP and the red curve represents KDP crystal.
The highly deuterated DKDP crystal was used in electro-optical $Q$
-switch materials for the near-infrared waveband (such as at 1053 nm or 1064 nm). It is observed from Figure 9 that, in the near-infrared band, the transmittance of 97.9% deuterated DKDP crystal is significantly higher than those of 70% DKDP and KDP crystals because the introduction and concentration of deuterium atoms weakened the infrared absorption caused by vibrations of the O-H band. Reference [Reference Xie, Qi, Wang, Wang, Chen and Shao22] considered the transmittance of the crystal at 355 nm was more than 88%, which indicated that the optical performance of the as-grown crystal was pretty good. In Figure 9, the transmittance of all 97.9% DKDP sample crystals at 355 nm was more than 89%. The difference in transmission is small between different samples of 97.9% DKDP crystal, thus indicating the good homogeneity in transmission of the pyramidal crystal. To accurately evaluate the quality of the as-grown crystal, we entrusted Nuclear Physics and Chemistry, China Academy of Engineering Physics to measure the transmittance. They processed the crystal into two
$Q$
-switch materials for the near-infrared waveband (such as at 1053 nm or 1064 nm). It is observed from Figure 9 that, in the near-infrared band, the transmittance of 97.9% deuterated DKDP crystal is significantly higher than those of 70% DKDP and KDP crystals because the introduction and concentration of deuterium atoms weakened the infrared absorption caused by vibrations of the O-H band. Reference [Reference Xie, Qi, Wang, Wang, Chen and Shao22] considered the transmittance of the crystal at 355 nm was more than 88%, which indicated that the optical performance of the as-grown crystal was pretty good. In Figure 9, the transmittance of all 97.9% DKDP sample crystals at 355 nm was more than 89%. The difference in transmission is small between different samples of 97.9% DKDP crystal, thus indicating the good homogeneity in transmission of the pyramidal crystal. To accurately evaluate the quality of the as-grown crystal, we entrusted Nuclear Physics and Chemistry, China Academy of Engineering Physics to measure the transmittance. They processed the crystal into two $100~\text{mm}\times 100~\text{mm}$
wafers with a thickness of 10 mm, polished with a chemical film coating. A spectrophotometer at a wavelength of 1053 nm was used to measure the transmittance of the samples. The transmittance results were 99.76% and 99.82%, which are higher than those of samples without any coating at 1053 nm (Table 5). Therefore, we can conclude that the as-grown highly deuterated DKDP crystal possesses a high transmission.
$100~\text{mm}\times 100~\text{mm}$
wafers with a thickness of 10 mm, polished with a chemical film coating. A spectrophotometer at a wavelength of 1053 nm was used to measure the transmittance of the samples. The transmittance results were 99.76% and 99.82%, which are higher than those of samples without any coating at 1053 nm (Table 5). Therefore, we can conclude that the as-grown highly deuterated DKDP crystal possesses a high transmission.
Table 5. Results for the transmittance and absorption coefficient with different deuterium levels in DKDP and KDP crystals.

In accordance with the Lambert–Beer law, the transmittance result is determined by the interface and internal transmittance in the crystal. The relationship can be expressed by the following formula[Reference Cai, Lian, Chai, Zhang, Yang and Xu23]:
 $$\begin{eqnarray}T_{\text{meas}}=T_{\text{Fresnel}}+T_{\text{bulk}}+T_{\text{Fresnel}},\end{eqnarray}$$
where $T_{\text{meas}}$
is the measured transmittance,
$T_{\text{meas}}$
is the measured transmittance, $T_{\text{Fresnel}}$
is the transmittance of the interface and
$T_{\text{Fresnel}}$
is the transmittance of the interface and $T_{\text{bulk}}$
is the internal transmittance in the crystal. As light travels through the crystal, Fresnel reflection occurs at every crystal interface. At the crystal interface, the transmittance (
$T_{\text{bulk}}$
is the internal transmittance in the crystal. As light travels through the crystal, Fresnel reflection occurs at every crystal interface. At the crystal interface, the transmittance ( $T_{\text{Fresnel}}$
) and reflectivity (
$T_{\text{Fresnel}}$
) and reflectivity ( $R_{i}$
) have the following relationship:
$R_{i}$
) have the following relationship:
 $$\begin{eqnarray}T_{\text{Fresnel}}=1-R_{i}.\end{eqnarray}$$ $R_{i}$
is estimated from the refractive index, as follows:
$R_{i}$
is estimated from the refractive index, as follows:
 $$\begin{eqnarray}R_{i}=\left(\frac{1-n}{1+n}\right)^{2}.\end{eqnarray}$$
In accordance with the Lambert–Beer law,
 $$\begin{eqnarray}\displaystyle I_{o} & = & \displaystyle I_{i}\text{e}^{-\unicode[STIX]{x1D6FC}_{\text{ac}}L},\end{eqnarray}$$
 $$\begin{eqnarray}\displaystyle T_{\text{bulk}} & = & \displaystyle \frac{I_{o}}{I_{i}}.\end{eqnarray}$$
Hence, one obtains
 $$\begin{eqnarray}T_{\text{bulk}}=I_{i}\text{e}^{-\unicode[STIX]{x1D6FC}_{\text{ac}}L}.\end{eqnarray}$$
Using Equations (5) and (6) directly yields
 $$\begin{eqnarray}T_{\text{bulk}}=\frac{T_{\text{meas}}}{(T_{\text{Fresnel}})^{2}}=\frac{T_{\text{meas}}}{(1-R_{i})^{2}}.\end{eqnarray}$$
Equations (10) and (11) directly yield
 $$\begin{eqnarray}\frac{T_{\text{meas}}}{(1-R_{i})^{2}}=I_{i}\text{e}^{-\unicode[STIX]{x1D6FC}_{\text{ac}}L}.\end{eqnarray}$$
Hence, one obtains
 $$\begin{eqnarray}\unicode[STIX]{x1D6FC}_{\text{ac}}=\frac{-\ln [T_{\text{meas}}/(1-R_{i})^{2}]}{L},\end{eqnarray}$$
where $\unicode[STIX]{x1D6FC}_{\text{ac}}$
is the absorption coefficient,
$\unicode[STIX]{x1D6FC}_{\text{ac}}$
is the absorption coefficient, $R_{i}$
is the reflectivity and
$R_{i}$
is the reflectivity and $L$
is the thickness of the DKDP sample.
$L$
is the thickness of the DKDP sample. $I_{i}$
and
$I_{i}$
and $I_{o}$
are the intensities of the incident and emergent light, respectively.
$I_{o}$
are the intensities of the incident and emergent light, respectively. $n$
is the refractive index, which is related to the deuterium content of the crystal. A database of the deuterium level and refractive index has been established over many years. The refractive index (
$n$
is the refractive index, which is related to the deuterium content of the crystal. A database of the deuterium level and refractive index has been established over many years. The refractive index ( $n$
is approximately 1.4) was estimated from the deuterium content of the crystal using this database. Reflectivity was then calculated from the refractive indices by using Equation (7). The optical path schematic of the experiment is shown in Figure 10. Following calculations, Table 5 is obtained. The average absorption coefficient of 97.9% DKDP crystal is about 0.0052 at 1053 nm, which is less than for the 70% DKDP and KDP crystals.
$n$
is approximately 1.4) was estimated from the deuterium content of the crystal using this database. Reflectivity was then calculated from the refractive indices by using Equation (7). The optical path schematic of the experiment is shown in Figure 10. Following calculations, Table 5 is obtained. The average absorption coefficient of 97.9% DKDP crystal is about 0.0052 at 1053 nm, which is less than for the 70% DKDP and KDP crystals.
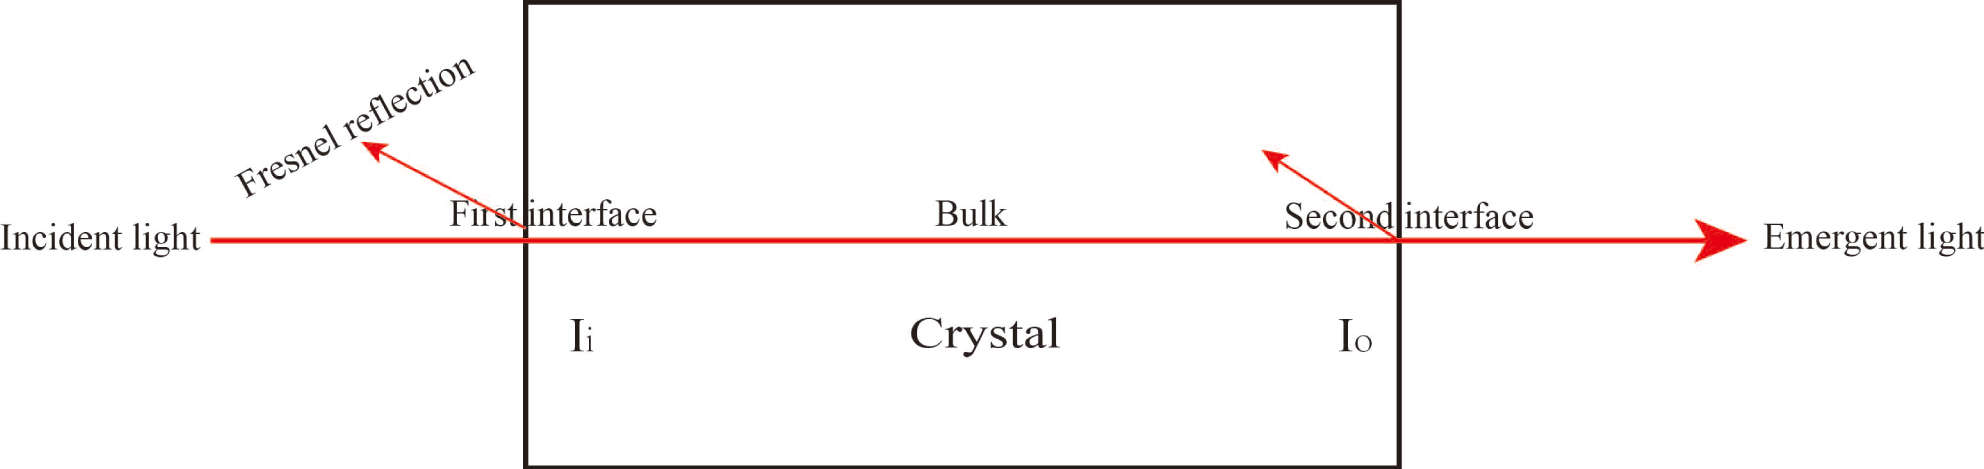
Figure 10. Optical path schematic of the experiment.
3.3 LIDT of DKDP crystals
The LIDT is one of the most important properties of DKDP crystals and is a measure of the resistance to laser damage. As-grown DKDP crystal wafers with dimensions of $50~\text{mm}\times 50~\text{mm}\times 10~\text{mm}$
were cut along the
$50~\text{mm}\times 50~\text{mm}\times 10~\text{mm}$
were cut along the $z$
-axis direction from the pyramid region of the crystal and polished thoroughly without any coating. These crystal wafers were then measured using an R-on-1 damage testing facility at a wavelength of 1064 nm with an 8.8 ns pulse width. The LIDT results are recorded in Figure 11 and listed in Table 6. The LIDT values at 3 ns and 10 ns were converted from those at 8.8 ns, which are given in Table 6. From Table 6, the average LIDT of the 97.9% DKDP crystal used for optical applications is
$z$
-axis direction from the pyramid region of the crystal and polished thoroughly without any coating. These crystal wafers were then measured using an R-on-1 damage testing facility at a wavelength of 1064 nm with an 8.8 ns pulse width. The LIDT results are recorded in Figure 11 and listed in Table 6. The LIDT values at 3 ns and 10 ns were converted from those at 8.8 ns, which are given in Table 6. From Table 6, the average LIDT of the 97.9% DKDP crystal used for optical applications is $23.2~\text{J}\cdot \text{cm}^{-2}$
, which exceeds the engineering requirements of higher than
$23.2~\text{J}\cdot \text{cm}^{-2}$
, which exceeds the engineering requirements of higher than $17~\text{J}\cdot \text{cm}^{-2}$
mandated by Nuclear Physics and Chemistry, China Academy of Engineering Physics. With the introduction of deuterium atoms, the LIDT of DKDP crystal decreased[Reference Xu, Sun, Wang, Cheng, Sun, Ji, Zhao, Liu, Gao and Xu24]. There are many factors that can influence the LIDT of DKDP crystals. To improve the LIDT of highly deuterated DKDP crystals, much work has been carried out by researchers. The LIDT of DKDP with a polymethylsiloxane coating reached approximately
$17~\text{J}\cdot \text{cm}^{-2}$
mandated by Nuclear Physics and Chemistry, China Academy of Engineering Physics. With the introduction of deuterium atoms, the LIDT of DKDP crystal decreased[Reference Xu, Sun, Wang, Cheng, Sun, Ji, Zhao, Liu, Gao and Xu24]. There are many factors that can influence the LIDT of DKDP crystals. To improve the LIDT of highly deuterated DKDP crystals, much work has been carried out by researchers. The LIDT of DKDP with a polymethylsiloxane coating reached approximately $28~\text{J}\cdot \text{cm}^{-2}$
(1064 nm, 3 ns)[Reference Wang, Tian, Niu, Wu, Zhou and Shen25]. Annealing the DKDP samples led to an improvement of the LIDT[Reference Cai, Lian, Chai, Zhang, Yang and Xu23]. However, the most important method is improving conditions during the growth process to improve the crystal quality. Further research is in process.
$28~\text{J}\cdot \text{cm}^{-2}$
(1064 nm, 3 ns)[Reference Wang, Tian, Niu, Wu, Zhou and Shen25]. Annealing the DKDP samples led to an improvement of the LIDT[Reference Cai, Lian, Chai, Zhang, Yang and Xu23]. However, the most important method is improving conditions during the growth process to improve the crystal quality. Further research is in process.

Figure 11. LIDT results. The inset gives the value of LIDT at the inflection point of the curve. The values for samples 1 and 2 are $43.9~\text{J}\cdot \text{cm}^{-2}$
and
$43.9~\text{J}\cdot \text{cm}^{-2}$
and $35.6~\text{J}\cdot \text{cm}^{-2}$
, respectively.
$35.6~\text{J}\cdot \text{cm}^{-2}$
, respectively.
Table 6. LIDT results at 8.8 ns, 3 ns and 10 ns.

4 Conclusions
The properties of a highly deuterated DKDP crystal with sizes of $318~\text{mm}\times 313~\text{mm}\times 265~\text{mm}$
grown by the rapid-growth method in a 500-L crystallizer were studied. A synthesis tank device was designed to synthesize a large volume (500 L) of high-purity, highly deuterium content growth solution, which effectively avoids the reduction of deuterium ion concentration and hydrogen–deuterium exchange. The deuterium content of the as-grown DKDP crystal was determined by IR spectroscopy and TGA measurements, giving a value of 97.9%. Transmission and absorption coefficient results confirmed that the as-grown DKDP possessed high optical quality in the near-infrared band. The LIDT of the 97.9% DKDP crystal was
$318~\text{mm}\times 313~\text{mm}\times 265~\text{mm}$
grown by the rapid-growth method in a 500-L crystallizer were studied. A synthesis tank device was designed to synthesize a large volume (500 L) of high-purity, highly deuterium content growth solution, which effectively avoids the reduction of deuterium ion concentration and hydrogen–deuterium exchange. The deuterium content of the as-grown DKDP crystal was determined by IR spectroscopy and TGA measurements, giving a value of 97.9%. Transmission and absorption coefficient results confirmed that the as-grown DKDP possessed high optical quality in the near-infrared band. The LIDT of the 97.9% DKDP crystal was $23.2~\text{J}\cdot \text{cm}^{-2}$
(1064 nm, 3 ns, R-on-1), which reached the engineering requirements for use in optical applications. In summary, highly deuterated DKDP crystals with excellent performance, with over 300 mm diameter, can be obtained by the same growth method and equipment.
$23.2~\text{J}\cdot \text{cm}^{-2}$
(1064 nm, 3 ns, R-on-1), which reached the engineering requirements for use in optical applications. In summary, highly deuterated DKDP crystals with excellent performance, with over 300 mm diameter, can be obtained by the same growth method and equipment.
Acknowledgements
This work is supported by the State High Technology Program for Inertial Confinement Fusion. We thank the Institute of Nuclear Physics and Chemistry, China Academy of Engineering Physics for help with transmittance measurements, and the Shanghai Institute of Optics and Fine Mechanics for help with LIDT measurements.


 Open access