


Introduction
Product planning is subject to a dilemma: Although usually only little and imprecise information is available, new promising products are to be defined in this phase (Kim and Wilemon, Reference Kim and Wilemon2002; Herstatt and Verworn, Reference Herstatt and Verworn2004). The uncertainties resulting from this dilemma must be reduced by obtaining additional information (Kim and Wilemon, Reference Kim and Wilemon2002). This can be done, for example, by analyzing predecessor products: In a study with 247 engineers, Albers et al. found that only 7% of developments are true new developments without any carryovers or adjustments of existing products. On the contrary, 93% of developments build on existing products and aim to improve them (Albers et al., Reference Albers, Bursac, Urbanec, Lüdcke and Rachenkova2014). The analysis of predecessor products, thus, represents a promising possibility for obtaining information for product planning.
For the systematic improvement of a product, its problems and potentials for improvement must be investigated. A promising source for identifying these is the products’ use phase. It describes the phase of the product's lifecycle in which the product is operated and used (Kiritsis, Reference Kiritsis2011). However, the feedback information flows are in most cases interrupted shortly after the product is sold (Terzi et al., Reference Terzi, Bouras, Dutta, Garetti and Kiritsis2010; Kiritsis, Reference Kiritsis2011), making the acquisition of high-quality product use information challenging (Deng et al., Reference Deng, Wellsandt, Hribernik and Thoben2021). Therefore, engineers in product planning traditionally need to rely on their experiences and assumptions about the use phase when planning the next product generation (Holler et al., Reference Holler, Uebernickel and Brenner2016b).
A possible solution emerges from the ongoing digitalization of products. In the last years, this megatrend has turned mechatronic products into cyber-physical systems (CPS). These systems integrate hardware, sensors, data storage, microprocessors, software, and connectivity, enabling the collection and sharing of data about themselves and their environment during their utilization (Porter and Heppelmann, Reference Porter and Heppelmann2014). The analysis of such use phase data promises new insights into how users use the products and how the products behave during usage (van Horn et al., Reference van Horn, Olewnik and Lewis2012). In product planning, these insights are considered especially valuable, as they help to reduce the characteristic uncertainties of this phase (Holler et al., Reference Holler, Uebernickel and Brenner2016b). The analysis of use phase data in product planning is an exemplary application of the ideas of the digital thread, which describes the linking of information of all product lifecycle stages for design, evaluation, and life cycle management (Maybury, Reference Maybury2013; Singh and Willcox, Reference Singh and Willcox2018).
For the manufacturing industry and its products, research on analyzing use phase data in product planning is still scarce. For example, Bertoni found that research articles on the data-driven identification of customer needs mainly focus on data from social media and online reviews. Sensor data, which are prevalent in the manufacturing industry and its CPS, are only considered in a minor number of articles (Bertoni, Reference Bertoni2020). This is especially noteworthy as the manufacturing industry generates more data than any other industry, for example, financial services, health care, and transportation (Reinsel et al., Reference Reinsel, Gantz and Rydning2018), making it seem suitable for analyzing use phase data. To investigate this discrepancy, we ask the following research question: What are the potentials and challenges associated with analyzing use phase data in product planning of manufacturing companies?
To answer this research question, we conducted an exploratory interview study with decision-makers of eight manufacturing companies that offer business-to-business (B2B) products. For illustration, these products can be production systems (e.g., machines and plants) that their customers, other companies, use to produce their own products (e.g., car parts). The users of these B2B products are employees of the customer companies, for example, operators of the considered machines and plants.
The results of this interview study reveal the purpose of analyzing use phase data in product planning of manufacturing companies as well as ten exemplary applications. Also, the results contain an analysis of the challenges and their associated causes. The challenges concern the products, the data, the customers, the implementation, and the employees.
The paper is structured as follows: Following the introduction, first, we describe the scientific background of this paper. Second, we present an overview of related research. Third, we explain our research design. Fourth, we present and discuss the findings of our study. Finally, we discuss the findings and conclude the paper.
Scientific background
The analysis of use phase data in product planning builds on three independent parts: product planning, use phase data, and data analytics. In the following, each of these three is briefly described.
Product planning
Product planning represents the first phase in the product creation process. The main tasks in this phase are the identification of the success potentials of the future, the discovery of promising product ideas as well as business planning (Koen et al., Reference Koen, Ajamian, Burkart, Clamen, Davidson, D'Amore, Elkins, Herald, Incorvia, Johnson, Karol, Seibert, Slavejkov and Wagner2001; Gausemeier et al., Reference Gausemeier, Dumitrescu, Kahl and Nordsiek2011). Results are the products to be developed by the company (Ulrich and Eppinger, Reference Ulrich and Eppinger2016) and the corresponding requirements lists (Pahl et al., Reference Pahl, Beitz, Feldhusen and Grote2007). Some authors, for example, Ulrich and Eppinger, refer to product planning as the initial phase or phase zero of product development. Other authors like Koen et al. call it the front end of innovation or the fuzzy front end (Koen et al., Reference Koen, Ajamian, Burkart, Clamen, Davidson, D'Amore, Elkins, Herald, Incorvia, Johnson, Karol, Seibert, Slavejkov and Wagner2001).
In many of his publications, Cooper emphasizes the importance of product planning: His studies show that the activities before the actual product development determine the success of a new product (Cooper and Kleinschmidt, Reference Cooper and Kleinschmidt1986). For him, the decisive pre-development activities are idea generation, product definition, and project evaluation (Cooper, Reference Cooper1988). These essentially describe the three main tasks of product planning proposed by Koen et al. (Reference Koen, Ajamian, Burkart, Clamen, Davidson, D'Amore, Elkins, Herald, Incorvia, Johnson, Karol, Seibert, Slavejkov and Wagner2001) and Gausemeier et al. (Reference Gausemeier, Dumitrescu, Kahl and Nordsiek2011). In a recent publication, Cooper also names these pre-development activities and a “sharp, early, and fact-based product definition” among the critical drivers of success in new-product development (Cooper, Reference Cooper2019).
In addition to its influence on product success, product planning also has a considerable influence on the other phases of the product life cycle. This is described by Herstatt and Verworn as well as Machac and Steiner among others: Of all phases, product planning has the greatest design freedom, but at the same time must deal with the greatest uncertainties. Hardly any costs are incurred in product planning itself. However, the costs for the further product lifecycle phases are determined, since the decisions made in this phase have an impact, for example, on the technologies to be used in the product. Following product planning, changes to the product are associated with steadily increasing costs (Herstatt and Verworn, Reference Herstatt and Verworn2004; Machac and Steiner, Reference Machac and Steiner2014).
Use phase data
Every product goes through a typical lifecycle. In product lifecycle management, the product lifecycle categorizes the following three major phases: beginning of life (BOL), middle of life (MOL), and end of life (EOL) (Terzi et al., Reference Terzi, Bouras, Dutta, Garetti and Kiritsis2010; Kiritsis, Reference Kiritsis2011). The MOL includes the minor phases use, service, and maintenance.
The data generated and collected in the use phase are described differently in the literature. Beverungen et al. divide these data into usage data, context data, and status data. Usage data describes how the product is used in terms of activities performed as well as their duration and intensity. Context data contains information about the environment of the product. Status data describes the status and health of the product (Beverungen et al., Reference Beverungen, Müller, Matzner, Mendling and vom Brocke2019).
Kreutzer calls the data generated in the use phase of CPS field data and divides them into three classes: Technical measurements, user data, and system data. Technical measurements reflect the data from sensors and actuators. User data describes the users and their interaction with the CPS. System data is inherent to the system and describes the state of the CPS (Kreutzer, Reference Kreutzer2019).
Balasubramanian et al. (Reference Balasubramanian, Beiker, Chauhan, Colombo, Hansson, Inampudi, Jaarsma and Kässer2016) divide the use phase data of cars into five types: External conditions, technical status of equipment, product usage, personal data and preferences, and direct communications. External conditions data describes the environment of the car. The technical status of equipment data indicates the system state. Product usage data contains information about the usage of the car by the user. Personal data and preferences store information about the user. Direct communications data contains the communication data of the car (Balasubramanian et al., Reference Balasubramanian, Beiker, Chauhan, Colombo, Hansson, Inampudi, Jaarsma and Kässer2016).
Although the approaches presented make different classifications, many similarities can be found, for example, the distinction between product- and user-related data. In this article, it is not important to choose and follow a certain classification. It is only necessary to clarify what is meant by use phase data and which data is included. Due to the similarities, all three classifications equally contribute to this.
Data analytics
Technological advancements in big data architectures, as well as artificial intelligence and machine learning, enable the efficient analysis of big data (Lueth et al., Reference Lueth, Patsioura, Williams and Kermani2016). The process of accessing, aggregating, and analyzing large amounts of data from multiple sources is called data analytics (DA). DA enables companies to extract knowledge from data to understand historical and predict future events (Tyagi, Reference Tyagi2003). The foundations of DA are mathematics, computer science, and business analysis techniques (Porter and Heppelmann, Reference Porter and Heppelmann2015). In addition, Reinhart (Reference Reinhart2016) stresses the importance of integrating specific domain knowledge, for example, about manufacturing. DA can be divided into four types with increasing value and complexity: descriptive, diagnostic, predictive, and prescriptive (Steenstrup et al., Reference Steenstrup, Sallam, Eriksen and Jacobson2014).
To understand the challenges and opportunities associated with data analytics, LaValle et al. (Reference LaValle, Lesser, Shockley, Hopkins and Kruschwitz2011) conducted a survey with more than 3000 business executives, managers, and analysts from 108 countries and 30 industries. They found that the main driver of using DA is the need to innovate to achieve competitive differentiation. Furthermore, they concluded that top-performing companies utilize DA five times more than lower-performing companies. The use of DA ranges from management tasks to day-to-day operations; however, the authors stress the correlation found for analytics-driven management and business performance.
DA can be used in numerous application areas. For example, Duan and Xiong (Reference Duan and Xiong2015) mention marketing, supply chain management, finance, and accounting and list several exemplary applications for each application area. In this paper, the application of DA in product planning of manufacturing companies is considered.
Related research
The analysis of use phase data in product planning and development has been addressed in previous research. In this section, we present a brief overview of five related studies.
Holmström Olsson and Bosch (Reference Holmström Olsson, Bosch, Fitzgerald, Conboy, Power, Valerdi, Morgan and Stol2013) present a multiple case study on the use of post-deployment data in software-intensive embedded systems. In their case study, eight semi-structured group interviews were conducted with employees of three companies. The companies use the analysis of data especially for improved product understanding, as a source of information for product management, and for product improvement. Overall, however, the authors note that the data are mainly used for troubleshooting and support. Processes for the systematic and continuous improvement of existing and future products do not exist (Holmström Olsson and Bosch, Reference Holmström Olsson, Bosch, Fitzgerald, Conboy, Power, Valerdi, Morgan and Stol2013).
Meyer et al. (Reference Meyer, Wiederkehr, Koldewey and Dumitrescu2021) present the results of a systematic literature review. In this paper, they derive the main concepts, advantages, success factors, and challenges of analyzing use phase data in product planning based on the identified literature. The six main concepts describe how use phase data can be utilized in product planning. The benefits address the three levels of analysis, process, and business. The authors structure the success factors and challenges according to the four classes organization, product, data analysis, and evaluation. They also note that some success factors are directly related to challenges. They interpret these factors as crucial for the success of analyzing use phase data in product planning (Meyer et al., Reference Meyer, Wiederkehr, Koldewey and Dumitrescu2021).
Holler et al. (Reference Holler, Stoeckli, Uebernickel and Brenner2016a) investigate the role of use phase data for the development of products with intelligent properties. For this purpose, the authors conducted a multiple case study with three companies, two of which are from the automotive sector. They used semi-structured interviews to answer their research questions. Furthermore, complementary sources of evidence such as documents about the IT landscape and management presentations describing strategic initiatives were analyzed. After the analysis of the interviews and the documents, the results were evaluated in focus groups workshops with the case companies. The results of their research process are four rationales, four opportunities, four conditions, and four obstacles for exploiting use phase data for product development (Holler et al., Reference Holler, Stoeckli, Uebernickel and Brenner2016a).
In their paper, Wilberg et al. (Reference Wilberg, Triep, Hollauer and Omer2017) present the results of an interview study on the use of Big Data in product development. In the study, the authors conducted a total of 15 interviews with experts from engineering departments of various companies. The interviews were semi-structured and addressed three topics: basic understanding, current practice in using big data, and future application of big data. In addition, the interviewees were asked to prioritize the steps of a data analysis process. The results of the study are the prioritized steps of the data analysis process, opportunities for product development, and current and future problems in the use of big data in product development (Wilberg et al., Reference Wilberg, Triep, Hollauer and Omer2017).
Briard et al. (Reference Briard, Jean, Aoussat, Véron, Le Cardinal and Wartzack2021) investigate the challenges of data-driven design (DDD) research in the early phases of the product development process. First, the authors conducted a literature review. Its goal was to provide an overview of the current state of DDD use in the early stages of product development and potential challenges. They then conducted a workshop at the DESIGN 2020 conference, asking participants to share their knowledge and speculate on future challenges. Building on the results of the workshop, the paper outlines a research agenda that addresses five overarching challenges: Methods and frameworks development, guidelines and tools development, organization of product design integrating data specialists, the establishment of ethical rules protecting user's privacy in DDD, and exploring limits of DDD (highlighting strengths, weaknesses, and synergies) (Briard et al., Reference Briard, Jean, Aoussat, Véron, Le Cardinal and Wartzack2021).
These five studies present valuable results concerning the analysis of use phase data in product planning and development. However, no study presents a comprehensive overview of the potentials and challenges of analyzing use phase data in product planning of manufacturing companies. For this reason, there is a need for action to conduct such a study.
Research design
Our research design is divided into two parts: Data collection and data analysis. In the following, both are explained in detail.
Data collection
To collect the data, we conducted an exploratory interview study with eight decision-makers from manufacturing companies. The data collection is based on the suggestions of Eisenhardt (Reference Eisenhardt1989) and Saunders et al. (Reference Saunders, Lewis and Thornhill2019) and is divided into four phases: preparation of an interview guide, selection of companies, conducting the interviews, and documentation of the interviews.
To ensure that the research question presented is also answered, we decided on semi-structured interviews and created a corresponding interview guide. Such a guide provides a content framework for the interviews without prescribing each question or its timing. The interview guide was based on our research question. It was divided into four sections: (1) identification of the success potentials of the future, (2) discovery of promising product ideas, (3) business planning, and (4) integration of data analytics into product planning. Sections 1 through 3 represented the three main tasks of product planning according to Gausemeier et al. (Reference Gausemeier, Dumitrescu, Kahl and Nordsiek2011). In the following, we display the questions of our interview guide.
(1) As use phase data are a new source of information, we wanted to investigate what effects this has on the identification of the success potentials of the future. Therefore, we raised the following questions:
1. How do you currently analyze the expectations and needs of your customers?
2. How do you currently analyze how customers and users utilize your products?
3. How do you currently analyze the performance and behavior of your products in the field?
4. How do you feed the results back into product planning?
5. Which potentials does the analysis of use phase data open up for the identification of the success potentials of the future?
6. What are the challenges of analyzing use phase data in this context?
(2) We also wanted to find out whether and how analyzing use phase data could help in the discovery of promising product ideas. Therefore, our questions included:
1. How do you currently identify new product ideas?
2. How do you improve existing products? Do you plan your products in generations?
3. Which potentials does the analysis of use phase data open up for the discovery of promising product ideas?
4. What are the challenges of analyzing use phase data in this context?
(3) For business planning, we wanted to learn how business models and product strategies could be affected by the feedback and analysis of use phase data. Our questions were:
1. What business models do you currently pursue? Do these include the feedback of use phase data?
2. Which potentials does the analysis of use phase data open up for your business models?
3. What are the challenges of analyzing use phase data in this context?
4. What product strategies do you currently pursue?
5. Which potentials does the analysis of use phase data open up for the development of product strategies?
6. What are the challenges of analyzing use phase data in this context?
(4) Finally, we aimed to further investigate the current and future integration of data analytics into product planning. This led us to the following questions:
1. Do you already analyze use phase data of your products? If so, do you perform these analyses during product planning?
2. What is your current data analysis process?
3. What is your future vision concerning the analysis of use phase data in product planning?
4. How can you reach this vision and overcome the existing challenges?
Due to the exploratory nature of the interview study, we did not include more detailed questions, but only defined some basic questions to go deeper into the answers, for example, what is working well or badly in this process? Who is responsible for the process?
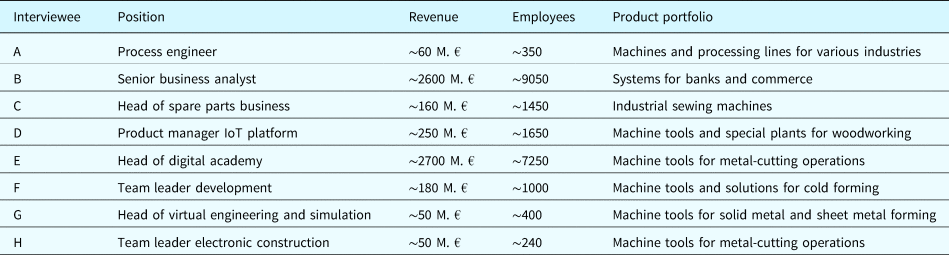
For the determination of the companies to be interviewed, we contacted 75 manufacturing companies from Germany via e-mail. We focused on companies whose products can generate and collect use phase data. From these 75 inquiries, we received eight positive answers, which is considered sufficient for case study research (Eisenhardt, Reference Eisenhardt1989). Our sample is characterized by heterogeneity concerning the position of the interviewees, the revenue of the companies, the number of employees, and the product portfolio (see Table 1). This heterogeneity enabled us to gather insights from a broad spectrum of the manufacturing industry, thereby strengthening the validity of the results. The interviewees and case companies are characterized in Table 1.
Table 1. Interviewees and case companies
We conducted the interviews online as Microsoft Teams video meetings. Each of the eight interviews lasted between 90 and 120 min. Each interview was conducted individually and led by two interviewers. We recorded each interview and subsequently created a word-for-word transcript. We then anonymized the transcripts to prevent inferences about the companies.
Data analysis
To evaluate the data, we conducted a thematic analysis (TA). Braun and Clarke (Reference Braun and Clarke2006, Reference Braun, Clarke, Cooper, Camic, Long, Panter, Rindskopf and Sher2012) describe TA as “a method for systematically identifying, organizing, and offering insight into patterns of meaning (themes) across a data set”. TA helps to find relevant patterns in the data that contribute to answering the research question. In the following, a detailed description of our thematic analysis is given. Figure 1 illustrates the steps of the data analysis.
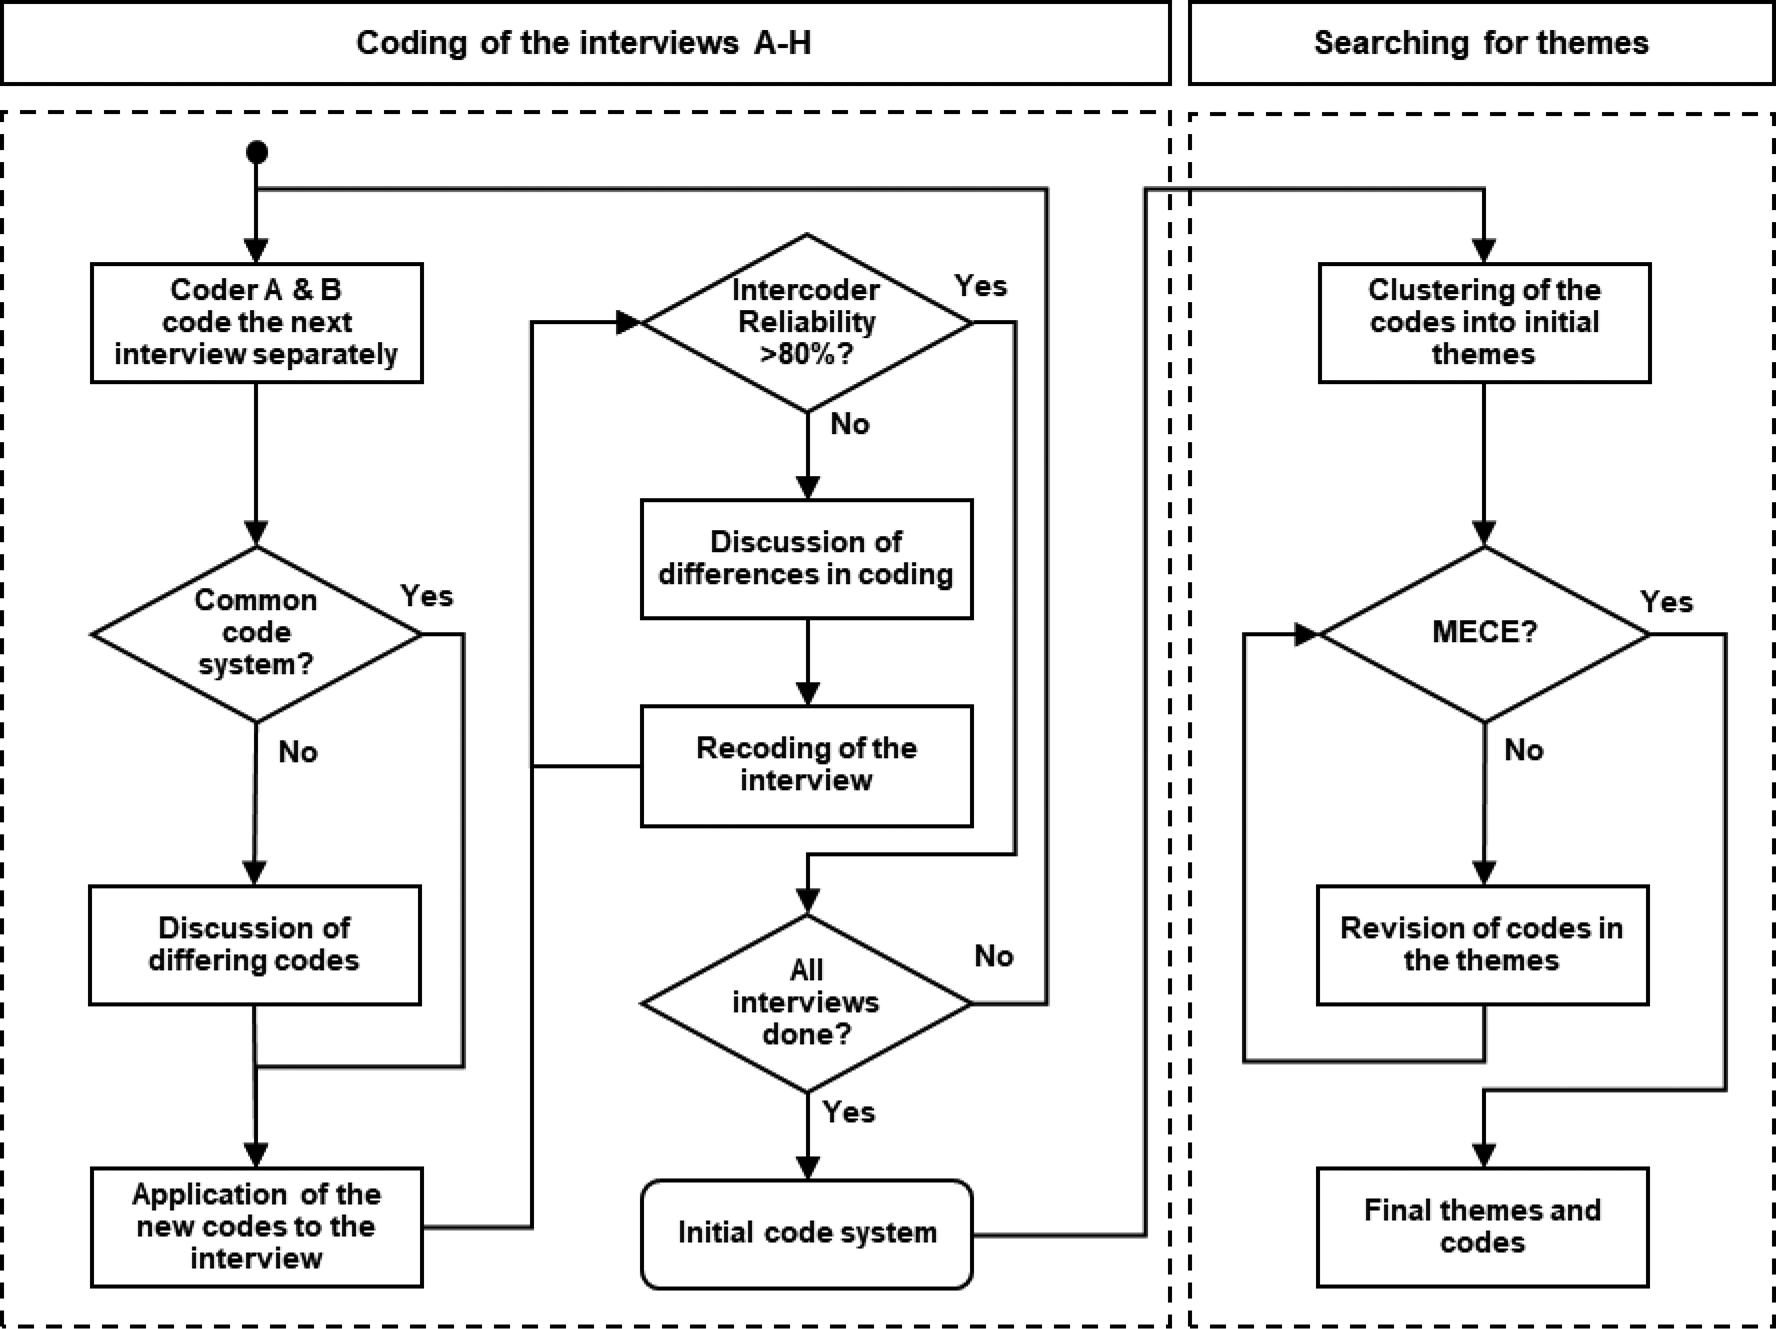
Fig. 1. Steps taken for the evaluation of the interviews.
The first step is the coding of the interview transcripts. For this task, we used the software MAXQDA. We coded the interviews inductively. This means that we did not prescribe a code system. Instead, we derived the codes directly from the interviews. We worked very closely with the transcript and tried to adopt the wording as accurately as possible. Thereby, we tried to prevent early interpretations of the content and biases.
Each interview was coded independently by two researchers (Coder A and B). Due to the inductive coding and the free choice of the code names, two separate code systems were created. Therefore, after each interview, coder A and B compared all newly created codes and discussed the differences. For example, coder A coded a certain segment as “only a few machines in the field”. Coder B coded the same segment as “not many machines available”. After discussing the codes, both coders agreed that coder A's code is more precise and should be kept. Coder B then updated his code according to the agreement. For the first interview, the code comparison and discussion were necessary for all codes, from the second interview only for the newly added codes. The discussion of the new codes thus led to a new, common code system, which replaced the two original code systems. Subsequently, coders A and B applied the new, common codes once again to the most recently coded interview. The new codes did not have to be applied to the previous interviews because the references to them occurred exclusively in the last interview.
After coding with the new codes, we calculated the inter-coder reliability. This indicates the extent to which different coders with identical code systems highlight the same text segments from the same interview. For the calculation of the inter-coder reliability, we set a minimum code intersection rate of 90% at the segment level in MAXQDA. This means that two selected quotes from the coders must match at least 90% for them to be recognized as the same and thus as a match between the coders. If, for example, one coder codes the same segment 20% shorter than the other (e.g., because he considers the last part of the segment irrelevant), the coded segment is counted as different.
If the inter-coder reliability was below 80%, we discussed the differences and then recoded the interview again. After this step, our inter-coder reliability surpassed 80% for each interview. Across all interviews, our inter-coder reliability was 83% which is considered satisfactory (Kassarjian, Reference Kassarjian1977).
After coding, we searched for themes in the codes. Themes “capture something important about the data in relation to the research question and represent some level of patterned response or meaning within the data set” (Braun and Clarke, Reference Braun and Clarke2006). We first approached this inductively by clustering codes based on their similarity or subjective proximity. The themes formed gave us initial clues to the answers to our research question. However, upon closer examination of the themes, we found that the codes in the themes were not mutually exclusive and collectively exhaustive (MECE). Specifically, some codes overlapped and shared the same thought, others described something on different abstraction levels and thus could not be compared.
To solve this problem, we drew on the method for creating taxonomies according to Nickerson et al. In this method, the authors describe how an inductive (“empirical-to-conceptual”) approach can be combined with a deductive (“conceptual-to-empirical”) approach (Nickerson et al., Reference Nickerson, Varshney and Muntermann2013). Since we had already used the empirical-to-conceptual approach for the generation of codes and themes and had noticed the problems mentioned above, we subsequently revised the codes in each theme using the conceptual-to-empirical approach. Having investigated the topic in a research project for several years and having coded all interviews, we had a sufficient understanding of the topic to specify suitable and distinguishable codes and create a reasonable structuring of these codes within the themes.
We then checked the revised structure of the codes in each theme by assigning the quotes to the codes. It was crucial that we could assign each quote to a code (codes are collectively exhaustive) and that this assignment was unique, that is, that a quote could not be assigned to two codes (codes are mutually exclusive). If this was not the case (e.g., because a quote was not described by any code or because there were two possible codes for the quote), we further improved the structure. In the end, we were able to assign all quotes to one code. The result was the final code system.
Findings
From the interviews, we were able to derive detailed answers to our research questions. These findings are presented in this section. First, we describe the status quo in the companies. Second, we present the mentioned potentials of analyzing use phase data in product planning. Third, we specify and explain the mentioned challenges. Note that the direct quotes used in this section represent a sample to illustrate the key points.
Status quo
At present, the companies employing the interviewees are not yet analyzing use phase data in product planning. One reason for this is that the companies still have rather small amounts of data from the use phase. With one exception, there is no regular transfer of use phase data. Instead, the companies only receive information via service reports, discussions with customers, or assessments of the product in operation.
[ … ] The [service technicians] go out and get a lot of feedback from the field. [ … ] They go to the production site, write reports, take photos, bring back a lot of requirements for our development. Problems are often thrown into the company in exactly this way. (Interviewee C)
We only get information [about the product use phase] via the service department or the sales engineer, who visits the customer and talks to him about how the other products are behaving or whether there are any problems. (Interviewee G)
Some companies also use regular conversations and surveys with customers to gain information:
We send our customers a form once a year to express their satisfaction. [Exemplary questions are:] “Do you have any problems?” [ … ] “What potentials for improvement do we still have?” (Interviewee H)
[Our] service actively contacts the customers to follow up again and again: “Are you having problems with the product at the moment?” (Interviewee F)
The data and information obtained are only insufficiently used in the further development of products, either because they do not reach the right recipients or because their evaluation is very time-consuming.
One colleague passes it on, the other considers it unimportant, although it [ … ] might be important after all. (Interviewee G)
The fact that [the information] is not yet recorded in a structured way means that it always takes a great deal of effort for us as a development/innovation department [ … ] to convert it into requirements and functional specifications. (Interviewee F)
Analyses of use phase data take place primarily to rectify acute errors. However, the findings from such analyses are usually not fed back into product planning.
[A use phase data analysis] is only carried out if a fault occurs and the customer reports it. Then it is solved. But the fact that this is then documented and incorporated into product planning is currently not the case. (Interviewee G)
It can, therefore, be concluded that the companies surveyed do not yet analyze use phase data in product planning. Based on these findings, we will present the potentials that the company representatives associated with the analysis of use phase data in product planning.
Potentials of analyzing use phase data in product planning
The interviewees addressed the potentials of analyzing use phase data in product planning from two perspectives: On the one hand, they described the overarching intended purpose. On the other hand, they described concrete application examples for the analysis of use phase data in product planning. These two perspectives are presented below.
Intended purpose of analyzing use phase data in product planning
The interviewees see the systematic analysis of use phase data in product planning as a new way to develop their products in generations.
The biggest gain [ … ] is, of course, that I can incorporate [the findings from the data analysis] into my next generation of machines. (Interviewee D)
When we get to the mass data in the field, [ … ] then I see huge potential there for technical improvements [to the products]. (Interviewee C)
The analysis of use phase data of existing products is considered particularly suitable to identify success potentials in terms of a focus or a promising development direction for the next product generation.
[Data analysis] certainly helps me to find out in which direction I should further develop my products. So: Where is a benefit and where is none? (Interviewee C)
[ … ] and then to get statements about this very, very quickly: Where should the focus be for us in product development? [ … ] That would be very important information for us. (Interviewee F)
When we analyze our data, we can of course also see what potential the machine still holds. (Interviewee H)
In addition to identifying new potentials, the data analyses can also be used to verify and prove assumed potentials or feedback from the field (Interviewees A, B, D, and H). However, the analysis of past-related data does not provide entirely new solution principles for the development of potentials (Interviewee A); this creative task must continue to be performed by humans.
Due to this focus on improving existing products, analyzing use phase data in product planning is linked with the product and release management:
Specifically, I would then couple this topic with product management and release management. (Interviewee F)
The identified potentials help product managers to safeguard their product strategies (Interviewee B). These form the basis for the development orders of future product generations. By analyzing use phase data, for example, it is possible to uncover false assumptions within the product strategy that could lead to wrong strategic decisions and ultimately to the failure of products. (Interviewee B).
Summarized in terms of the three tasks of product planning according to Gausemeier et al. (Reference Gausemeier, Dumitrescu, Kahl and Nordsiek2011) (see Section Product planning), the interviewees, therefore, agree that analyzing use phase data supports the identification of the success potentials of the future for existing products, but it does not directly aid the discovery of promising product ideas. Business planning is attributed a dual role. On the one hand, for example, the current product strategy with its uncertainties can be a starting point for data analyses. On the other hand, success potentials identified with data analyses ensure that a revised product strategy contains fewer uncertainties and is thus more valid because it builds on data-based success potentials.
Generic application examples
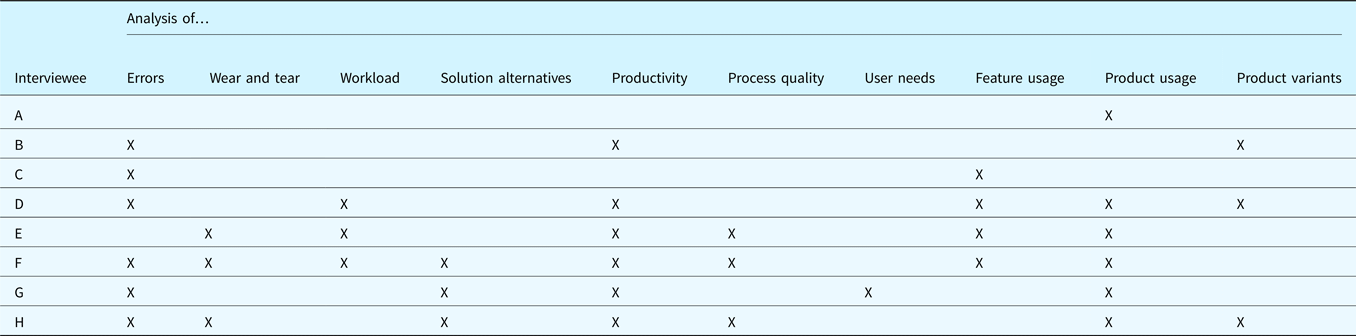
In the interviews, the interviewees named a total of ten generic application examples for analyzing use phase data in product planning. These are presented below. An overview of which interviewee discussed which example is shown in Table 2.
1) Analysis of errors
A frequently mentioned application example is the analysis of errors. With the help of use phase data, the context and the origin of errors are to be investigated:
In what context did [the error] happen? If I had no data there, no traces, then I would not know and then I could not assign the problem either. (Interviewee B)
When do machines generate error codes? And what happened just before? (Interviewee C)
In addition, analyses of use phase data can help to identify error patterns:
With this view into the data, one would certainly recognize weak points very quickly. That is: I recognize a frequent failure of certain components. (Interviewee F)
Such analyses could in particular enable higher availabilities of the products (Interviewee H).
2) Analysis of wear and tear
Table 2. Generic application examples discussed by the interviewees
The interviewees want to analyze use phase data to gain more precise insights into the wear and tear behavior of their products. In the case of production machines, for example, questions arise such as:
How heavily are tools loaded? How many cycles do components survive before they need to be replaced? (Interviewee F)
However, the insights gained with the help of data analysis will not only be used to better understand and predict wear and tear. The interviewees also see a potential for improving the products in the long term and reducing wear and tear:
You get [ … ] information [ … ] and [we] can then draw appropriate conclusions: Do we perhaps have to reduce the acceleration somewhat to improve the durability [ … ]? (Interviewee H)
[ … ] that one tries [ … ] to reduce or even completely eliminate the wear of various components [through data analyses]. (Interviewee H)
3) Analysis of workload
Another application example is the analysis of the workload of products and their components. The aim here is to use the analysis of the data to identify over-dimensioned functionalities and components:
We can already see that we are completely oversizing certain components. [ … ] We see that the controllers and the motors are extremely oversized. This is quite a high-cost point because we have over 100 motors in such a plant. That is of course an enormous savings potential if I could design each component 15% smaller. (Interviewee D)
“Is my plant actually at its limit in terms of output? Am I running it at 90% capacity? Or do I have parts of equipment in my overall production line that are severely underutilized?” (Interviewee E)
The performance values of the individual functions: Are they really always maxed out? (Interviewee F)
The interviewees expect to be able to reduce the manufacturing costs of their products through such data analyses.
4) Analysis of solution alternatives
The data can also be used to analyze alternative solutions for a given task. For example, analyses shall be used to determine which solutions or concepts prove themselves in which operating situations and provide the best performance (Interviewee G). In addition, the data should also be used to compare, for example, cycle times, downtimes and availability (Interviewee F), or to gain indications of the need for a different solution:
Of course, it helps if you then determine [via data analyses]: “There are often problems with this type of drive. It causes costs on our side and problems on the customer side”. And then you can use another technology. [ … ] So you can really make data-based improvements. (Interviewee H)
5) Analysis of productivity
Another application example for the analysis of use phase data is the analysis of the productivity of products.
[With the use phase data, we can] make an as-is assessment: “Where are you losing cycle time? Where could you get more cycle time or more output out of the machine?” In the final analysis, this is all aimed at OEE (overall equipment effectiveness) [ … ]. [Such analyses] would definitely work better with data support. (Interviewee G)
With bottleneck analyses, “weak points” (Interviewee B) could be identified and subsequently remedied:
Quick wins are, of course, when I recognize the bottlenecks in a machine, [ … ] can generate a rebuild and thereby increase the potential. (Interviewee D)
When analyzing productivity, however, it can also be of interest to compare different combinations of production steps concerning their productivity and economic efficiency (Interviewee F). For Interviewee F, it is also conceivable to “increase the efficiency of old plants” with data analyses.
6) Analysis of process quality
In addition to analyzing the output performance, data shall also be used to assess the quality of the processes in the product.
I could well imagine [the analysis of use phase data] in places where it is a matter of process analysis, i.e., process quality. (Interviewee H)
Based on such an analysis, the processes are to be improved in such a way that they cause fewer problems overall and the quality of the produced output increases. Different process variants can also be compared with each other in terms of process and result quality. (Interviewee F)
7) Analysis of user needs
The analysis of use phase data shall also be used to investigate user needs. For example, the pains of users during the use of the products can be captured with the help of data:
In the best case, we want to understand where the pains are and then work out solutions based on this. (Interviewee G)
In contrast to customer surveys, for example, this also allows user needs to be identified that the user is unable to articulate (unspoken needs) or that he is not yet aware of (latent needs).
8) Analysis of feature usage
Use phase data shall also be used to analyze feature usage. For example, the aim is to identify functions or features that are used particularly frequently:
I can see [from the data] which are the most used features. (Interviewee D)
Similarly, functions and features that are hardly ever or never used should also be identified:
[We don't know] whether all customers are using [the many functionalities of the products] to the full or whether we are not also offering [ … ] functionalities that nobody needs. (Interviewee E)
[With the data] I see: The product is completely over-engineered. I can leave that [function] out, [ … ] I don't need that at all. (Interviewee C)
If I now had exactly these evaluations of the machines, [ … ] then I could of course deduce relatively quickly that I am keeping costly functions or requirements in the machines that I only need in 10% of the cases. (Interviewee F)
Such analyses also promise interesting findings when comparisons are made over a longer period:
Then you can certainly see a trend from the data of [which] functions are used more over the years and [which] are used less. (Interviewee E)
9) Analysis of product usage
In addition to feature usage, companies are also interested in the wider use of the products.
If we had all this data, we would certainly also be able to read out how a product is used during the day [ … ] to obtain statements about where the focus should be for us in further product development. (Interviewee F)
In concrete terms, for example, it is a question of finding out the “actual production quantities on the machines” and the flexibility of the product expected by the customer. (Interviewee F).
It is our wish to [carry out] evaluations of the operating states in which our machines are usually used because we could then of course optimize the machine in this respect. (Interviewee E)
The utilization of the products by the customers can also be analyzed with the data and lead to interesting insights:
How often do customers set up the machine, how often are they busy performing any service activities? [ … ] This would give us a much better understanding of the customers’ behavior and work with the machine. (Interviewee H)
10) Analysis of product variants
The interviewees also plan to use the data to identify promising product variants.
I would now look at the data and, based on that, I would first define what types of machines I actually need. (Interviewee B)
Interviewee H emphasizes that his company wants to use data to tailor products more to users. This even goes as far as the data-driven customization of products for users:
[By analyzing use phase data], we can deliver [ … ] tailored concepts when redesigning [a product]. (Interviewee D)
Challenges of analyzing use phase data in product planning
In addition to the potential described, the interviewees see five challenges that they must overcome for analyzing use phase data in product planning. These are presented in detail below.
Products are too complex for fast data analyses and conclusions
The interviewees cite the high complexity of their products as a key challenge – especially in comparison with other industries.
Our standard machines are more complex than a mid-range vehicle or even a top-of-the-range vehicle. (Interviewee E)
This high level of complexity makes fast data analyses and conclusions difficult. The interviewees already perceive this challenge when analyzing defects in their products:
There is an infinite number of different error cases that can occur and an infinite number of different scenarios of how they could happen because the products are so complex and large. (Interviewee A)
As a result, the interviewees see considerable difficulties in detecting errors, classifying them, and identifying their causes.
What is counted as an error? What is not counted as an error? And where do you assign this error? Is this one error or are they two errors? (Interviewee B)
The problem is that there are many causes and that it is extremely resource-intensive to finally explicitly say “Okay, this or that is the reason for the malfunction” when a malfunction is reported. (Interviewee D)
A successful cause-effect analysis, thus, requires an intensive examination of the product and the context of the investigation. However, companies often have only a few experts available for such an investigation:
Only a few [employees] can [ … ] recognize [the causes] because you usually must delve deep into the PLC program to analyze it. For us, this is a serious problem [ … ]. (Interviewee D)
The products provide too little data
As of today, the products still provide manufacturers with too little data. One reason is that many products in the field still have too few sensors and are, therefore, “no sophisticated data collectors” (Interviewee C). But even in current products, often only the sensors that are already necessary today are installed because otherwise, it is “not economical” (Interviewee D). However, there are considerations to provide possibilities for sensor retrofitting or to install additional sensors, even if these only promise significant added value in the future (Interviewee E).
In addition to limited data collection, a main contributing factor for lacking use phase data is the missing network connection of the products. Most existing products in the field are currently not yet connected to a network:
Another group [ … ] are machines [ … ] that cannot provide this information, i.e., old machines. That is if they are from the predecessor product generation, and there are quite a few in the field. (Interviewee B)
And since our machines are still not connected to a network to a large extent, we naturally also lack data. In other words, you can certainly say that for 90% of the machines in the field we do not have access and we don't know exactly how the customer is using them. (Interviewee C)
To increase connection rates, companies are currently developing solutions such as IoT connectors or specific interfaces (Interviewees C, E, F, G, and H). These solutions are to be built into all products in the future, even if customers do not want to pay for them:
I am currently in the process of creating an interface in the electrotechnical area in all machines to standardize how we will connect our products in the future [ … ]. Of course, this has not yet been activated, but I would like it to be included in every machine when it is delivered. In other words, it doesn't matter whether the customer has paid for it or not. [The interface] will be included. (Interviewee G)
However, receiving data in sufficient quantities is also expected to be a future problem. The main reason for the interviewees is that far fewer instances of a product are sold in B2B than in B2C (business-to-consumer).
The quantities in mechanical engineering are different from what we know from all these great application areas of data analytics, from Google on Smartphones or from the automotive industry. [ … ] With some large machines, we already have a series cut after 10 machines. So I have 10 machines in the field that are identical. (Interviewee E)
Especially in B2B, products are often designed individually for each customer, which runs directly counter to standardization:
If the next customer says he would like [the product] to be different again, [ … ] then we will do that, too. (Interviewee G)
To make matters worse, some companies do not even know which version of a component was installed in a specific product or product instance because they do not have a system in which this information is stored (Interviewees A, B, G, and H). One company also has to deal with the fact that its customers modify their products (production machines) after they have been purchased and put into operation:
Some customers work very closely with us and inform us of modifications [ … ]. Other customers have a machine, and it runs [ … ] until it breaks down and then they try to repair it again via some other service provider or a local supplier. [ … ] You might hear from them 10 years later because something has broken that the customer can no longer get any other way, but only through us. And then you also notice that it has already been modified. There is another engine on it, which was not built by us and is not the same type. The customer has simply rebuilt or extended it. It's a big machine, so you can do a lot of work yourself. (Interviewee G)
Nevertheless, the interviewees stated that they wanted to push standardization in the future to build up a common database for all products and thus increase the comparability of the instances. Interviewee G called hardly comparable products “dead machines” that must be avoided.
Customers do not want to or cannot feedback the use phase data
Another challenge is that many customers do not want to or cannot feedback the use phase data.
We don't yet have a customer who commits [ … ] that the plant will go online and we will get access to data. [ … ] At the moment, I see the biggest obstacle in this separation of the IT worlds. (Interviewee F)
Customers often see no added value in sharing data. Also, they fear know-how-losses as well as a systematic observation:
Most of the time [it fails] because the customer doesn't see any added value in it or often simply doesn't want it because he knows what he's doing with the machines himself or because he consciously operates [the machines] in a way he shouldn't. (Interviewee G)
The interviews revealed that large companies and corporations are much more restrictive about sharing data than smaller companies (Interviewees A, C, E, F, and H). There is also a lack of clarity regarding the question of who owns the data and, above all, the knowledge extracted from it (Interviewees E and F).
If customers do not rule out data feedback as a matter of principle, in most cases they still do not allow permanent full access to the data, but only temporary access:
When we [ … ] access the systems [ … ], then the customer has to give his approval at that moment, and then we can access it. (Interviewee A)
To improve this, the companies want to focus primarily on cooperations and partnerships:
We enter collaborations and partnerships with customers [ … ] where there are concrete use cases that also offer our customers added value. In other words, they can quickly get a direct solution to either a challenge they have in production or a problem they have [with data analyses]. In return for this, we receive the data as payment. (Interviewee F)
Other approaches to convincing customers include greater transparency through the integration of customers in analyses and the utilization of good customer relationships (Interviewees A, B, C, F, and H). Interviewee E also assumes that the shift to younger generations in management will automatically lead to more openness in data exchange over time.
However, the willingness of customers alone is not sufficient for data exchange. Even if this exists in principle, the establishment of a connection to the customer is usually associated with immense efforts and expenses:
It's a big struggle with the IT departments to even get remote access to the machines. (Interviewee H)
We “mess around” in the customer's network, which is of course extremely tedious and also an enormous effort of coordination and clarifications. (Interviewee D)
In some cases, the feedback of data is just not possible:
I first must transfer the data from all these small and medium-sized companies that are located somewhere in the countryside. Often, I don't have the data connection at all. They have no Ethernet in the hall and no WLAN to connect the machines properly. [ … ] We have a lot of customers whose main management tool is Excel, and you can't connect that. (Interviewee E)
Implementation requires new processes and infrastructures
For efficient implementation in the company, the interviewees stress the introduction of a clearly defined process as crucial:
We will certainly also need completely new processes [ … ]. That is a completely new way of receiving customer feedback. (Interviewee C)
In particular, Interviewee B requests a “clean methodology” that has a strong focus on the goal and does not get bogged down in details.
The interviewees see specific obstacles in the analysis of the data as well as in the exploitation of the analysis results:
The evaluation would have to be very, very flexible. So [ … ] I have a question, a challenge, and then I have to be able to configure: “How do I now get the aggregated information out of this data?” (Interviewee F)
It's always nice to feedback data. And evaluating data is always nice, too, but whether I'll be able to figure it out in the end, or whether I might even draw the wrong conclusions because I find some link that the algorithm presents, which might be there, but from which I can't learn anything. (Interviewee E)
What is still needed in this context, of course, is the individual developer or expert who can also interpret the data or the results. And who can say, “Okay, the result that came out of this is nonsense. It can't be true. It's not physically possible at all.” (Interviewee G)
Interviewees B, C, D, and F see product management as responsible for the overall process because it must also exploit the knowledge gained:
Ideally, I would see something like this not directly in the development area [ … ], but in product management. So ideally I have implemented a product management function in the company, which then evaluates [the analysis results] and derives: What are the future challenges and the requirements for the products? And from this, it then derives the consequences for the products. (Interviewee F)
Another problem for the implementation is the lack of digital consistency, which is shown by a multitude of tools and databases (Interviewees B, D, F, and G). These points make the merging and joint evaluation of different data immensely difficult.
Companies lack data skills
Another challenge is the lack of data skills among employees in the manufacturing industry. Interviewee A explains this with the rather traditional orientation of the mechanical engineering industry:
[With our employees] from mechanical design or classic project planning [ … ] perhaps the connection to the topic is simply not yet as strong. (Interviewee A)
Although companies have known for some years that data-based methods will rise in importance in the future, they have not gained much experience so far:
We simply lack experience in analyzing data. [ … ] Of course, the first thing we have to do is deal with the topics of analytics and AI. These are topics that we haven't dealt with yet; that have been hovering over our heads for 2-4 years, but have we dealt with them? No, not yet to this day. (Interviewee H)
To overcome these problems, some companies are currently relying on external data experts:
[…] when it comes to big data, to evaluations, we still bring in expertise from outside. (Interviewee F)
Other companies are already planning new data analysis positions (Interviewee C). However, the interviewees agree that both options for building data competencies will not easily solve the competency problem. This is because new external and internal data experts will lack an “overall understanding of the technical systems” that they need to “actually understand the machines to be able to search for the right thing” (Interviewee B). For products as complex as those in the manufacturing industry, data competencies alone are not enough:
Sometimes [the data experts] can code really well, but they haven't understood the machine at all. [ … ] And even with AI approaches like this, I have to formulate a hypothesis to perform a corresponding evaluation. (Interviewee B)
You have to be extremely deep in the engineering processes to know how to handle the data. (Interviewee D)
Application knowledge and experience are indispensable to be able to “interpret the data or the results” (Interviewee G). If data experts are left alone, “things usually go wrong” (Interviewee F). Therefore, cross-domain collaboration with product experts is essential (Interviewees A and C). But for collaboration between data and product experts to succeed, product experts must also build up data competencies. However, day-to-day business is a hurdle as it “always is the top priority” (Interviewee D). This is especially true for smaller companies that have no separate capacities for topics outside of day-to-day business (Interviewee C).
However, even if capacities and training opportunities are available, the qualification of employees is not ensured. The interviewees note that not all employees want to familiarize themselves with the topic voluntarily. For example, Interviewee D's company has set up a digital platform to collect data. However, this is only insufficiently used:
The development [department] is always complaining: “We don't know how to design the components [ … ].” Now they have the ability to [analyze data on the platform], yet they don't use it. I think a lot of people have underestimated this stubbornness. (Interviewee D)
Interviewee H also reports similar experiences:
Our experience [ … ] is that it's not as easy to get the masses on board as you might imagine. (Interviewee H)
Many experienced employees will also try to defend their know-how (Interviewees B and F). To solve these problems, the interviewees request the establishment of a data culture, the demonstration of clear added value, and offensive support from management (Interviewees A, D, and F).
Discussion and conclusion
In this section, we discuss the limitations and contributions of our research. Finally, we make recommendations for future research to conclude the paper.
Limitations
The findings of this study are based on eight in-depth interviews with experts from manufacturing companies. Due to this rather small sample, a statistical representation of the results cannot be claimed. Furthermore, the results cannot necessarily be generalized for all manufacturing companies. This sector is very heterogeneous, it consists of thousands of small- and medium-sized enterprises and every one of these has its strengths and weaknesses. Therefore, the results must be reflected before they can be applied within a company. More limitations concern the generated data themselves. The chosen interview and evaluation methods as well as the interview setting in an online meeting may have restricted further insights. In addition, the interviewees described their personal and subjective experiences, perceptions, and opinions. These statements do not necessarily correspond to the official statements their companies would make or the answers other employees of the same company would give. Lastly, the interview study only gathered qualitative data. From these data, quantitative statements (e.g., a prioritization of the potentials or challenges) cannot be derived. Consequently, all data identified can only be viewed as equally important, even if this is not the case in practice.
Contributions
This paper provides the first comprehensive review of the potentials and challenges that decision-makers of manufacturing companies associated with analyzing use phase data in product planning. In the following, the main contributions of this paper are presented.
First, the results show that the analysis of use phase data primarily enables a new form of potential identification for the planning of future product generations. This confirms the statements of Holmström Olsson and Bosch (Reference Holmström Olsson, Bosch, Fitzgerald, Conboy, Power, Valerdi, Morgan and Stol2013). Direct findings for completely new products, on the other hand, are not to be expected. Furthermore, the results show that the responsibility for the analysis of use phase data lies with the product management and should be used there to secure the product strategy. We do not know of any other study that has described this responsibility and intended purpose before.
Second, the paper provides a comprehensive list of generic application examples of the analysis of use phase data in product planning. These examples represent the expectations of practitioners in the research field. Such a list of generic application examples does not yet exist in the literature. For example, Wilberg's internet of things use case catalog does not address product planning, but seven organizational functions of companies such as operations or service and product deployment (Wilberg et al., Reference Wilberg, Lau, Nützel, Hollauer and Omer2018; Wilberg, Reference Wilberg2020). Apart from this catalog, only individual use cases are mentioned in the literature, for example, in the papers of Hou and Jiao (Reference Hou and Jiao2020) (“identifying customer behavior”, “understanding customer preferences”), Cantamessa et al. (Reference Cantamessa, Montagna, Altavilla and Casagrande-Seretti2020) (“identification of customer segments”, “elicitation of customer needs”), or Abramovici et al. (Reference Abramovici, Gebus, Göbel and Savarino2017) (“to identify weak spots”). Thus, the presented list of application examples expands the knowledge base for the analysis of use phase data in product planning.
Third, the paper contains a comprehensive description and investigation of the challenges that decision-makers of manufacturing companies associated with the analysis of use phase data in product planning. The challenges of the high complexity and individuality of products are also a finding of Holler et al.'s interview study and thus confirm it (Holler et al., Reference Holler, Stoeckli, Uebernickel and Brenner2016a). That not all customers will share their data voluntarily is also described by Wilberg et al. (Reference Wilberg, Triep, Hollauer and Omer2017) in the results of his interview study. The need for new processes and infrastructures is mentioned by Briard et al. (Reference Briard, Jean, Aoussat, Véron, Le Cardinal and Wartzack2021) but from the perspective of research and not from the perspective of manufacturing companies. The challenge of missing competencies is also described in the results of the study by Wilberg et al. (Reference Wilberg, Triep, Hollauer and Omer2017). Our study, thus, confirms numerous challenges already identified in previous studies. However, beyond confirming the challenges, it also explains the causes of the challenges and possible starting points for overcoming them. This could not be found in any other study and therefore represents a further added value of our study.
Recommendations for future research
The results of the interview study, as well as their limitations, represent the starting point for further research projects. In particular, we see the following focal points:
1. As described in the limitations, the results of the interview study presented are to be understood as purely qualitative. To prioritize the potentials and challenges, a quantitative study should be conducted with further manufacturing companies.
2. Table 2 shows that all interviewees named only a subset of the generic application examples. This indicates that none of the interviewees is aware of the full potential of the analysis of use phase data in product planning. Therefore, the identified application examples should be further analyzed and – if possible – supplemented by additional examples.
3. The identified challenges prevent the analysis of use phase data in product planning. Therefore, research should be conducted on suitable artifacts like methods and frameworks to specifically support companies in overcoming these challenges.
Acknowledgments
This publication was written in a research project funded by the German Federal Ministry of Education and Research (BMBF) within the “Innovations for Tomorrow's Production, Services and Work” Program. The authors are responsible for the content of this publication.
Conflict of interest
The authors declare none.
Maurice Meyer, M. Sc. studied Industrial Engineering and Management at the University of Applied Sciences Bielefeld and Mechatronics at the Technical University Cologne. Since 2018, he has been a research associate at the Heinz Nixdorf Institute of Paderborn University in Prof. Dumitrescu's Advanced Systems Engineering research group. His research focuses on the integration of data analytics approaches into strategic product planning, the planning of future product generations, and strategy development.
Timm Fichtler, M. Sc. studied Industrial Engineering and Management at the University of Applied Sciences Bielefeld and at Paderborn University. Since the end of 2021, he has been a research associate at the Heinz Nixdorf Institute of Paderborn University in Prof. Dumitrescu's Advanced Systems Engineering research group. His research focuses on the integration of data analytics approaches into strategic product planning.
Dr.-Ing. Christian Koldewey studied mechanical engineering at Paderborn University and the University of Applied Sciences Bielefeld. Since 2015, he has been a research associate at the Heinz Nixdorf Institute of Paderborn University in Prof. Gausemeier's Strategic Product Planning and Systems Engineering research group and Prof. Dumitrescu's Advanced Systems Engineering research group. There, he leads the research area Strategy & Innovation. His research focuses on the strategic planning of smart services as well as business model and strategy development.
Prof. Dr.-Ing. Roman Dumitrescu studied mechatronics at the Friedrich-Alexander-University Erlangen-Nuremberg. Afterwards, he was a research assistant at the chair of product development at the Heinz Nixdorf Institute of Paderborn University. Under the supervision of Prof. Dr.-Ing. Jürgen Gausemeier, he received his doctorate in 2010 in the field of systems engineering for intelligent mechatronic systems. He is director at the Fraunhofer Institute for Mechatronic Systems Design IEM and head of the Advanced Systems Engineering research group at the Heinz Nixdorf Institute of Paderborn University. His research focuses on the creation of intelligent technical systems. Prof. Dumitrescu is also managing director of the technology network Intelligent Technical Systems OstWestfalenLippe (it's OWL).


 Open access