


Introduction
The defining challenge of agriculture is to increase the production of food, fiber, and fuel for the growing population while reducing environmental harms, providing ecosystem services, and sustaining social equity and prosperity (Matson, Reference Matson1997; Tilman et al., Reference Tilman, Balzer, Hill and Befort2011; Robertson, Reference Robertson2015). The dominant crop production systems in the US relies heavily on chemical inputs, limited crop choices, and intensive soil disturbance, leading to soil loss and degradation, water quality issues, and loss of biodiversity (Prokopy et al., Reference Prokopy, Gramig, Bower, Church, Ellison, Gassman, Genskow, Gucker, Hallett, Hill, Hunt, Johnson, Kaplan, Kelleher, Kok, Komp, Lammers, LaRose, Liebman, Margenot, Mulla, O'Donnell, Peimer, Reaves, Salazar, Schelly, Schilling, Secchi, Spaulding, Swenson, Thompson and Ulrich-Schad2020; Davis et al., Reference Davis, Hill, Chase, Johanns and Liebman2012). Change has been called to diversify the crop production systems from conventional or ‘business as usual’ to move toward various practical or aspirational systems that can balance production and profits with environmental and social well-being (Davis et al., Reference Davis, Hill, Chase, Johanns and Liebman2012; Hunt, Hill and Liebman, Reference Hunt, Hill and Liebman2017; Spiegal et al., Reference Spiegal, Bestelmeyer, Archer, Augustine, Boughton, Boughton, Cavigelli, Clark, Derner, Duncan, Hapeman, Harmel, Heilman, Holly, Huggins, King, Kleinman, Liebig, Locke, McCarty, Millar, Mirsky, Moorman, Pierson, Rigby, Robertson, Steiner, Strickland, Swain, Wienhold, Wulfhorst, Yost and Walthall2018; Robertson et al., Reference Robertson, Hamilton, Paustian and Smith2022). Agricultural researchers are working on interdisciplinary, multi-scale, long-term studies since many agroecological processes operate on landscape-farm-field scales and over long periods of time (Robertson et al., Reference Robertson, Allen, Boody, Boose, Creamer, Drinkwater, Gosz, Lynch, Havlin, Jackson, Pickett, Pitelka, Randall, Reed, Seastedt, Waide and Wall2008; Walbridge and Shafer, Reference Walbridge and Shafer2011; Cusser et al., Reference Cusser, Bahlai, Swinton, Robertson and Haddad2020). This work includes topics such as soil health, climate change resilience, biodiversity, and rural prosperity.
To support agricultural research and the adaptability of agricultural policies, we need to improve our understanding of how fast and widely the production system is changing by gauging prevailing practices at different time and spatial scales. Federal datasets such as the USDA Census of Agriculture (Ag Census) and the Agricultural Resource Management Survey (ARMS) endeavor to provide an accurate picture at the national level. Sometimes, the survey data are supplemented by geospatial data products like the Cropland Data Layer (CDL). These federal datasets are also often the sole source for information at the regional, state, and other local scales. However, when designing research and developing policy and education programs, researchers and local practitioners often need more nuanced information than can be gleaned from large-scale national surveys. The detail needed might instead be provided by surveys that provide coverage of specific regions.
Farmer surveys need to be tailored to specific regions and types of farms and may need to be collected more frequently. First, farms in the US vary widely in terms of the crops they grow, their acreage, and other characteristics. For instance, corn and soybean farms will differ from vegetable farms in their land management and production practices such as tillage, planting seasons, and nutrient needs. For projects focused on specific types of farms such as cash grain farms (e.g., corn and soybean) federal datasets only provide aggregated descriptions for all farm types and may miss the details needed for describing certain types of farms. Second, some questions have a local focus, and require a larger sample size for their particular states than what the federal datasets provided. For example, for the 2019 ARMS phase three survey, the combined sample size for Michigan and Ohio was 754 farms, compared to Illinois, for which 1370 farms were surveyed as one of the fifteen core production states (USDA-NASS, 2020). Third, monitoring the continuity of practices in the same fields over consecutive years provides valuable information for agricultural research, policy, and education (Mcfadden, Smith and Wallander, Reference Mcfadden, Smith and Wallander2022). The Ag Census is conducted every five years at the county level, while ARMS collects data about the same crop every five or more years. Wade, Claassen and Wallander (Reference Wade, Claassen and Wallander2015) noticed the difficulty in conducting time series analysis using ARMS due to a lack of examining the same targeted field every year of data collection. For at least these three reasons, surveys that focus on a specific type of farm for a specific region and cover consecutive years can fill gaps in federal datasets.
Here we propose reframing typical collection and analyses of survey data to focus on time and spatial details (resolution), consecutive sampling and surveying, and targeted farm types. Our survey was part of an interdisciplinary project at W.K. Kellogg Biological Station (KBS) which is a Long-Term Ecological Research (LTER) and United States Department of Agriculture (USDA) Long-Term Agroecosystem Research (LTAR) site. Sites in the LTAR network conduct common experiments which compare conventional agriculture with proposed aspirational systems across the country to form strategies at the national and regional levels (Meredith et al., Reference Meredith, Bean, Brymer, Friedrichsen and Hurst2022). This analysis is part of an interdisciplinary effort to determine baseline treatments for the common experiment at KBS. We demonstrate the use of multi-year targeted survey data from the same farm and field over three years to inform prevailing crop rotation, tillage, and cover crop practices in Illinois, Indiana, Michigan, and Ohio. In doing so, we introduce unique knowledge about the cash crop production system in the four Midwest states. Crop rotation, cover crops, and tillage are key conservation practices, since they set the baseline for crop diversity on farms and levels of soil disturbance, further affecting biodiversity; nutrient management; soil moisture, soil structure, and organic matter; soil carbon emission and sequestration; and many other farm and landscape level ecosystem services (Kaspar and Singer, Reference Kaspar, Singer, Hatfield and Sauer2011; Robertson et al., Reference Robertson, Gross, Hamilton, Landis, Schmidt, Snapp and Swinton2014; Syswerda and Robertson, Reference Syswerda and Robertson2014; Wezel et al., Reference Wezel, Casagrande, Celette, Vian, Ferrer and Peigné2014; Spiegal et al., Reference Spiegal, Bestelmeyer, Archer, Augustine, Boughton, Boughton, Cavigelli, Clark, Derner, Duncan, Hapeman, Harmel, Heilman, Holly, Huggins, King, Kleinman, Liebig, Locke, McCarty, Millar, Mirsky, Moorman, Pierson, Rigby, Robertson, Steiner, Strickland, Swain, Wienhold, Wulfhorst, Yost and Walthall2018).
Our analyses of consecutive farm-field data also contribute to social science research on farmer practice adoption by highlighting the importance of observational units in interdisciplinary research. Many social science studies collected farm practice data at the farm or household scale. These data, although collected for purposes other than describing prevailing practices, can provide estimations of adoption levels at regions with varied boundaries. For example, Fleckenstein et al. (Reference Fleckenstein, Lythgoe, Lu, Thompson, Doering, Harden, Getson and Prokopy2020) found 60.4% of surveyed producers in Indiana, Illinois, and Iowa were currently using conservation tillage (including reduced tillage or no-till), while 24.7% were using cover crops. Adhikari et al. (Reference Adhikari, Wang, Jin, Ulrich-Schad, Sieverding and Clay2023) found 78.2% of surveyed producers in South Dakota adopted conservation tillage while 47.5% adopted cover crops. Singer, Nusser and Alf (Reference Singer, Nusser and Alf2007) found 8% of the farmers in four states in the corn belt (Illinois, Indiana, Iowa, and Minnesota) planted a cover crop in the fall of 2005. At a finer geospatial scale in the Western Lake Erie Basin (covering parts of Ohio, Michigan, and Indiana), Burnett et al., (Reference Burnett, Wilson, Heeren and Martin2018) found 16.2% of corn and soybean farmers planted cover crops after the 2013 fall harvest. In contrast, crop rotation is often studied using geospatial data. For example, Socolar et al. (Reference Socolar, Goldstein, De Valpine and Bowles2021) found that 4.5% of the study area that included the states of Illinois, Indiana, Iowa, Kansas, Minnesota, Missouri, Nebraska, and Ohio was under corn monoculture and half of the study area had a corn-soy rotation.
It is worth noting that although these studies were conducted in the general region of US Midwest or Corn Belt, the adoption rates varied by geospatial boundaries. These studies focused on a snapshot of the conservation practices and lacked studies on adoption rates across years. Survey findings with farmers as units also tend to show higher rates of adoption than the present study using acreage as units (Arbuckle and Roesch-McNally, Reference Arbuckle and Roesch-McNally2015). Using farmers as the unit of analysis and reporting reflects a disciplinary focus on people. In contrast, agroecosystem and agronomy studies often use acres as units reflecting their disciplinary focus on land. Descriptions provided by federal agencies such as USDA Economic Research Service and National Agricultural Statistics Service use acres as units (e.g., Wallander et al., Reference Wallander, Smith, Bowman and Claassen2021). These federal statistics are commonly consulted by natural and social scientists in research design and by policymakers and education professionals such as extension specialists in communication. Such differences in units can potentially impede the wide application of social science study results in interdisciplinary agricultural research and policy conversations.
To bridge the disciplinary gap and bring more visibility to social survey data, we propose connecting self-reported behavior data (e.g., whether a respondent used a practice) with information about scale (e.g., on how many acres the respondent used a practice and for how long), which calls for shifts in conventional survey design, analyses, and presentation. Through our methods and results, we demonstrate how continuous observation of a single farm-field over multiple years helps inform our knowledge of yearly fluctuation in reported practice adoption and, in doing so, generates unique insights for large grain farms. We present our results along with descriptions from the Ag Census and ARMS. Although our analysis is specific in space and time, the method we propose aims to inspire innovative designs and uses of farmer surveys in understanding evolving agricultural systems as well as provide better social and behavioral data for agroecosystem research and policy development.
Our analyses are guided by three questions:
1. What are the prevailing crop rotation, tillage, and cover crop practices for corn and soybean fields across four Midwest states (IL, IN, MI, OH)?
2. How do the four states compare in the adoption of these three practices?
3. To what extent do tillage and cover crop adoption rates change annually?
Materials and methods
Data collection: a panel farmer survey
We gathered data using a self-administered mail survey that targets corn and soybean farms with over 100 acres (40 ha) in production in a total of 263 counties in Illinois (95), Indiana (81), Michigan (31), and Ohio (56) where over 15% of the land area is planted to corn and soybean to exclude urban areas from the sampling frame. Soybean and corn farms are predominant in the US Midwest and play critical roles in the region's agricultural production, steering the environmental, economic, and social outcomes of the region's cash grain production system. Farm addresses were purchased from a private vendor, Farm Market iD, Westmont Illinois. Samples were stratified by farm size, with equal numbers of farms operating 100–499 acres (30 to 202 ha) and 500 or more acres (203 or more ha). The oversample of large farms was to ensure adequate coverage of acres in the study region. Based on the sampling design, weights were calculated by the ratio between the percent of farms within a farm size category for a state in the sample frame and the respective percent in the sample.
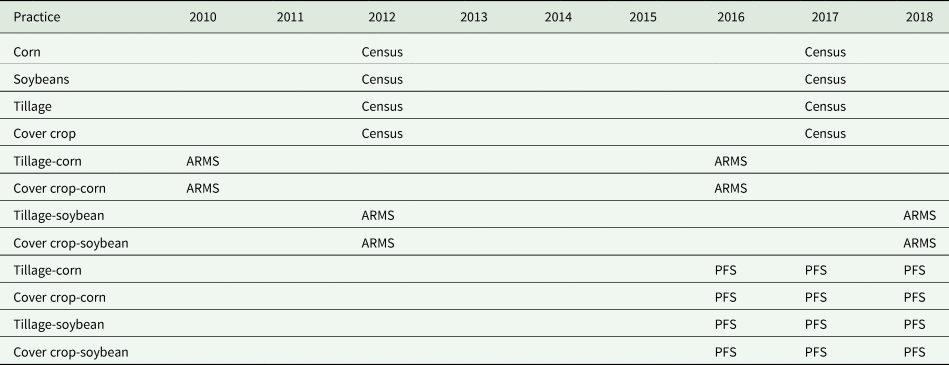
Although the mail survey method is not new, our multi-year sampling design, the integration of measures, and data analysis procedures are novel and provide practical lessons for reorienting survey data uses to describe prevailing practices and capture changes at the regional scale. The first survey was conducted in spring 2017 measuring farming practices in the 2016 growing season and has been repeated at annual intervals since then. In each survey year, a pre-notice postcard, a survey packet (including cover letter, and questionnaire), a reminder postcard, and one or two follow-up questionnaire(s) were sent to farmers, following a modified Dillman Tailored Design Method (Dillman, Smyth and Christian, Reference Dillman, Smyth and Christian2014). The sample follows a two-part panel design to account for attrition over time in the panel. Compared to Ag Census and ARMS, our survey coverage reveals a more granular resolution with three consecutive years from 2016–2018 at the regional scale instead of single years at five- or six-year intervals at the federal level (Table 1).
Table 1. Recent Ag Census, ARMS, and Michigan State University-Panel Farm Survey (MSU-PFS, Authors' survey) coverage from 2010–2018
One challenge in measuring the same farm/field over years was to anticipate and manage participants moving in and out of the panel. In the first survey year of 2017, 10,582 surveys were mailed, and 3086 surveys were returned, resulting in an initial response rate of 29%. All participants who gave a valid response were invited back for the second-year survey, and 1480 returned a valid survey. In addition, 3520 surveys were mailed to new farm addresses to maintain a yearly sample size target for each state; of these, 693 valid responses were returned, which comprised the new-sample portion of the panel. Then, participants in the earlier survey waves were invited back to the third-year survey with the continued addition of a new sample. The same sampling strategy was used every year, generating an overall average annual response rate of 43.5%. Each year's sample consisted of a stratified combined sample (both return and new), which was considered representative of farm size at the state level. In this analysis, we used the field-level portion of the 2017, 2018, and 2019 survey data, which correspond to crop years 2016, 2017, and 2018. We named our annual surveys as Michigan State University (MSU)- Panel Farmer Survey (PFS).
Measures
The survey instrument was developed through consultation with agricultural scientists and stakeholders, including an interdisciplinary team of scientists, and from previous research based on the agricultural practices' literature. The survey instrument was also pretested with a farmer focus group. In the section on field-level farming practices, farmers were asked to identify their largest corn or soybean field on the farm and answer operational and management questions for that field. Although the method was not a random field selection, our strategy ensured consistency of the fields that are measured each year and increased the survey's overall acreage coverage within each farm.
We measured crop rotation, tillage, and cover crop use with specific survey items in the field-based section of the questionnaire. Crop rotation was constructed as three-year cropping histories from the question ‘In each of the last three years, what crop did you grow on [your largest] field?’ We used the farmers' responses for cropping history to derive crop rotation by categorizing crop rotation into three groups: corn-soybean rotation, continuous corn rotation, and other rotation. Corn-soybean rotation was defined as only corn or soybean planted in the reported years (i.e., 2016, 2017, and 2018). Continuous corn rotation was defined as only corn planted in the reported years. Other rotations included other crops such as wheat and dry beans or two crops planted in a single year. Each field assigned a crop rotation in our analyses had cropping information for at least three consecutive years. A total of 3091 fields had crop rotation information.
The tillage question was, ‘what kind of tillage did you perform on [your largest corn or soybean] field before the 2016 growing season?’ Respondents were instructed to check all that applied within four tillage categories for both fall and spring preceding the growing season: (1) conventional tillage (such as moldboard plow) with less than 15% residue remaining on the surface, (2) reduced tillage (such as chisel plow) with 15–30% residue remaining on the surface, (3) conservation tillage (such as vertical, ridge, strip, or mulch till) with more than 30% residue remaining on the surface, and (4) no-till. We combined reduced tillage and conventional tillage into the category of conventional tillage to be consistent with residue-based tillage definitions (Wade, Claassen and Wallander, Reference Wade, Claassen and Wallander2015). No-till was defined as fields with no tillage in the fall after the harvest of the previous growing season or during the spring preceding the current growing season. Conservation tillage was defined as fields with only conservation tillage in the fall of the previous growing season and spring of the current growing season. If fields were reported to have used conventional or reduced tillage in spring or fall, they were categorized as conventional tillage. Continuous no-till was defined as no-till in three consecutive years (2016, 2017, and 2018).
Winter cover crops were measured with a single question: ‘During the 2015–2016 winter (years changed according to survey year), did [your largest] field have a cover crop?’. Respondents answered ‘yes’ or ‘no’ and were prompted to specify what cover crop was planted if they selected ‘yes.’ Continuous cover crop was defined as using cover crops in three consecutive winters (2015–2016 winter, 2016–2017 winter, 2017–2018 winter). Cover crops in the study are defined as crops planted not for harvest.
For all three practice measures, we completed detailed data cleaning and validation. Practice use is often more nuanced and context-dependent than the survey question entailed. For example, we entered and checked all the comments that respondents wrote about their crop rotation and individually coded those rotations. For cover crops, some respondents considered winter wheat or corn/soybean residues as ‘cover crops’, suggested by their answers to the follow-up open-ended question ‘which cover crop did you plant.’ If farmers reported wheat, corn stalks, or soybean stubble, their responses were recoded to zero, that is as no cover crop. Allowing respondents to provide more details on their practices turned out to be a valuable source of information to balance the nuanced production system and the need to simplify categories for the analyses. The data cleaning and validation process was time-consuming but necessary in using the survey data to measure adoption of the three practices.
Data analysis
The adoption rate is defined as the number of acres adopted for a given practice (e.g., corn-soybean rotation) divided by the number of total acres. To calculate adoption rates, we completed a lengthy data transformation procedure, including multiplying the acres of the field by whether a field is managed by a practice. Such calculation required measurements of the practice and field characteristics including field size. The adoption rates for tillage and cover crops were calculated by crops and for each growing season. For example, the adoption rate of no-till for the pre-2016 growing season for corn fields was calculated by the acres of corn fields reported using no-till divided by the total acres of corn fields in the 2016 growing season. Adoption rates by state and crop were also calculated for state comparisons. Weights were applied to all crop rotation, tillage, and cover crop statistics to account for the oversampling of large farms. All descriptive analyses were performed in SPSS 26, and the adoption rates were calculated in Excel. No-till and cover crop adoption rates were plotted by state and crop to show the changes from the 2017 growing season to the 2018 growing season. The survey for the 2016 growing season (collected in 2017) only included corn fields and was thus not included in the yearly comparison.
We also consulted the Ag Census and the ARMS to compare our survey results. The Ag Census data reported acres of total harvested cropland, land harvested for corn for grain, and soybean for grain (USDA-National Agricultural Statistics Service, 2019a, 2019b), cropland on which no-till practices were used, and cropland planted to a cover crop (excluding Conservation Reserve Program lands) (USDA-National Agricultural Statistics Service, 2019a, 2019b). These statistics were used to calculate the adoption rates with acres of total harvested cropland as the denominator. ARMS no-till estimates were from Wade, Claassen and Wallander (Reference Wade, Claassen and Wallander2015) and Claassen et al. (Reference Claassen, Bowman, Mcfadden, Smith and Wallander2018), and ARMS cover crop estimates were from Wallander et al. (Reference Wallander, Smith, Bowman and Claassen2021). The earliest ARMS data used in these reports were the 2010 corn field surveys.
Results
Sample description
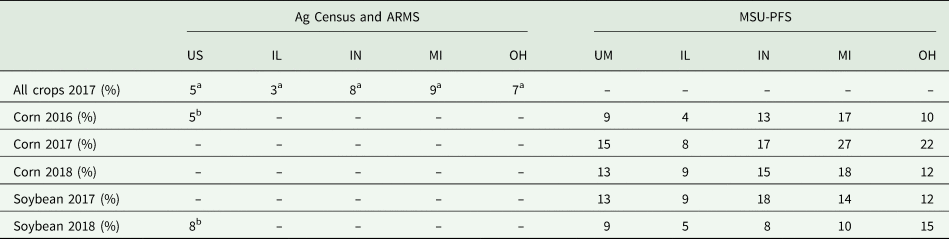
Compared to Ag Census and ARMS, our MSU-PFS survey describes a subsample of farms in four Midwestern states that consists of large grain farms (corn and soybeans) with more than 100 acres (40 ha) of planted areas to corn and/or soy. According to the 2017 Ag Census, corn and soybean fields together accounted for 64% (Michigan) to 96% (Illinois) of the total harvested area in these four Midwestern states that grow more corn and soybeans than the national average (Table 2). The survey sample data used in this analysis included 166,029 acres (67,190 ha) of corn fields for the 2016 growing season, 69,561 acres (28,150 ha) for the 2017 growing season, and 75,992 acres (30,753 ha) for the 2018 growing season. Soybean fields were not sampled in the first year of the survey field section. There were 76,218 acres (30,844 ha) of soybean fields sampled for the 2017 growing season and 55,558 acres (22,484 ha) sampled for the 2018 growing season.
Table 2. Share of corn and soybean acreage out of total harvest cropland acres from 2017 Ag Census

The average production size of sampled farms in our regional survey ranged from 584 acres (236 ha, Michigan) to 740 (299 ha, Indiana) (Table 3). In comparison, in the Ag Census more than one-third of the farms were small-holder farms with less than 49 acres (20 ha) that grow grains or other crops. Fewer than one-third of the farms were 50 (20 ha) to 179 acres (72 ha). The average farm sizes from our data by the state were larger than those in the Ag Census due to our stratified sampling design (farms operating 100 acres or more).
Table 3. Unweighted farm size and field size statistics
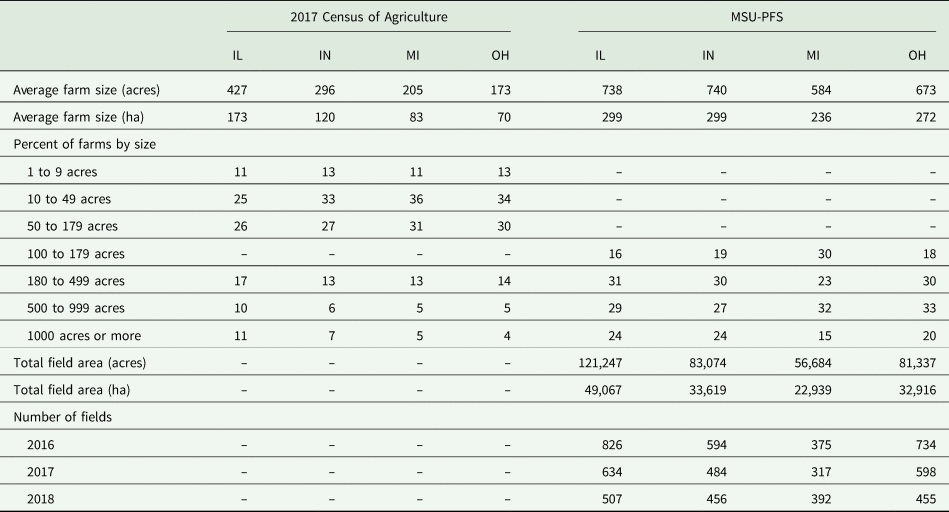
Note: Ag Census surveyed all farms including farms with 50 to 179 acres. MSU-PFS (Authors' survey) sampled farms with more than 100 acres. This population difference should be considered when interpreting the comparison.
Crop rotation
We found that 66 percent of all sampled acres that had at least three years of cropping information had a corn and soybean rotation (Table 4). Continuous corn accounted for eight percent of all acres, and 18 percent of all acres had ‘other’ crop rotation, which is a category that encompasses a variety of other cropping practices, such as the inclusion of wheat, hay, alfalfa, or dry beans in the rotation. At the state level, corn and soybean rotation was most common in Indiana (72%), Ohio (71%), and Illinois (68%). Michigan (41%) had the most crop diversity and the lowest percentage of corn and soybean rotation in our sample, which stood in contrast to the 64% of combined percentage of single-year corn and soybean acreage reported by the Ag Census (Table 2). The difference is likely due to our survey's considering multiple years of cropping data. Michigan farmers have been shown to incorporate crops other than corn and soybean in their rotation more often than farmers in other Midwest states do (Michigan Department of Agricultural and Rural Development, 2019). Shares of acreage planted to continuous corn in our survey date were lower than anticipated. Illinois had the highest share of continuous corn (13%), followed by Indiana (6%), Michigan (6%), and Ohio (3%).
Table 4. Crop rotation acres (percentages) for large (over 100 acres) grain farms by states (weighted) as reported by MSU-PFS (Authors' survey)

The Ag Census did not offer estimates of crop rotation, although single-year shares of crop acreage are commonly used to support the dominance of corn and soybean planting in the Midwest. Using ARMS data, Claassen et al. (Reference Claassen, Bowman, Mcfadden, Smith and Wallander2018) reported estimates for conservation rotation, which was a more specific crop-rotation concept that included the requirement for high residue crop, low nitrogen crop, and attaining a threshold level of average annual residue. They estimated that roughly 28% of 2016 corn acreage and 12% of soybean acreage was planted as part of a conservation crop rotation (Claassen et al., Reference Claassen, Bowman, Mcfadden, Smith and Wallander2018). Compared to our survey data, ARMS did not report estimations for traditionally defined crop rotations.
No-till
Our survey reported single-year no-till was used on roughly 20% of the corn acres (2016) and 39% of the soybean acres (2017) in the four-state region (Table 5). In comparison, using ARMS, Claassen et al. (Reference Claassen, Bowman, Mcfadden, Smith and Wallander2018) reported somewhat higher adoption rates of single-year no-till at the national level, which was 27% for corn fields and 40% for soybean fields. Wade, Claassen and Wallander (Reference Wade, Claassen and Wallander2015) combined no-till with strip-till in using the ARMS data and reported 31% of the combined adoption rates on corn fields and 46% on soybean fields. The Ag Census did not differentiate tillage practices by crops. If using the national average no-till adoption rate (33%) to estimate no-till adoption by crops for large grain farms in the Midwest, the average would simultaneously overestimate single-year no-till adoption rates for corn fields yet underestimate single-year no-till adoption rates for soybean fields.
Table 5. Comparison of no-till adoption rates (by acres) between Ag Census, ARMS, and MSU-PFS (Authors' survey) (weighted)

UM-upper Midwest, the four studied states combined.
b Source: Wade, Claassen and Wallander (Reference Wade, Claassen and Wallander2015).
c Source: Claassen et al. (Reference Claassen, Bowman, Mcfadden, Smith and Wallander2018).
Note: Ag Census surveyed all farms including farms with 50 to 179 acres. MSU-PFS (Authors' survey) sampled farms with more than 100 acres. The population difference should be considered when interpreting the comparison.
In the sample, 619 corn or soybean fields were observed over three consecutive years, covering 52,592 acres (21,283 ha) across four states. These longitudinal field data were used for the analysis of continuous no-till. Overall, 15 percent of these acres were not tilled in any of three consecutive years. This value is lower than that from Claassen et al. (Reference Claassen, Bowman, Mcfadden, Smith and Wallander2018), who reported that 21% of the combined acreage in the surveys of corn, soybean, cotton, and wheat were continuously in no-till or strip-till in all four years. It is likely due to our concentrating on large farms.
For state differences, Ohio was the most likely state to have no-till corn (27% in 2016, 33% in 2017, and 28% in 2018) and no-till soybean (52% in 2017 and 2018) compared to the other three states in most of the years, while Michigan and Illinois had lower adoption of no-till on corn or soy fields as shown in Panels B and C in Figure 1 respectively. Ag Census estimates did not differentiate between corn fields and soybean fields (Panel A in Fig. 1). Ohio had the highest overall no-till adoption rate (42%), followed by Indiana (40%) and Illinois (29%). Michigan had the lowest overall no-till adoption rate (22%). Our findings mirrored Ag Census findings on state differences for single-year no-till adoption. However, the Ag Census overestimated state-level no-till adoption rates for corn fields in large farms and underestimated state-level no-till adoption rates for soybean fields in large farms for all states. ARMS reports did not report state-level estimates.

Figure 1. No-till overall (Panel A, Ag Census), no-till corn (Panel B, MSU-PFS), and no-till soybeans (Panel C, MSU-PFS), shares by states and years.
For temporal changes, in general, no-till adoption rates for the same crop remained stable from 2017 to 2018 (Fig. 1). Two exceptions were for no-till corn in Ohio, which dropped from 33 to 28%, and no-till soybeans in Michigan, which dropped from 31% in 2017 to 23% in 2018. In comparison, Ag Census and ARMS monitored the long-term changes in no-till use. Both the 2012 and 2017 Ag Census revealed that the overall no-till adoption rates remained stable for Ohio and Michigan, while Indiana saw a slight decrease and Illinois saw a slight increase. Overall, Ag Census showed that no-till adoption rates remained similar from 2012 to 2017.
Cover crop
Our survey data reported cover crop adoption rates for corn fields (following cover crops, corn was planted) prior to the 2016, 2017, and 2018 growing seasons and for soybean fields (following cover crops, soybeans were planted) prior to the 2017 and 2018 growing seasons (Table 6). For the Midwest, the shares of corn acres planted to cover crop were 9 percent prior to the 2016 growing season, 15 percent prior to the 2017 growing season, and 13 percent prior to the 2018 growing season. The shares of soybean acres planted to cover crops were 13 percent prior to the 2017 growing season and 9 percent prior to the 2018 growing season. Using ARMS data, Wallander et al. (Reference Wallander, Smith, Bowman and Claassen2021) reported that prior to the 2016 growing season, the national cover crops adoption rate on corn fields was 5 percent and the adoption rate on soybean fields was 8 percent, both lower than our estimates for fields in large grain farms in the Midwest.
Table 6. Comparison of cover crops adoption rates (by acres) between Ag Census, ARMS, and MSU-PFS (Authors' survey) (weighted)
UM-upper Midwest, the four studied states combined.
b Source: Wallander et al. (Reference Wallander, Smith, Bowman and Claassen2021).
Note: Ag Census surveyed all farms including farms with 50 to 179 acres. MSU-PFS (Authors' survey) sampled farms with more than 100 acres. This population difference should be considered when interpreting the comparison.
As shown in Panels B and C of Figure 2, Michigan had the highest cover crop adoption rates prior to corn in all three years: 17% in 2016, 27% in 2017, and 18% in 2018 (Table 6). Illinois had the lowest cover crop adoption rates prior to corn: 4% in 2016, 8% in 2017, 9% in 2018. For soybean fields, Indiana had the highest cover crop adoption rate (18%) in 2017. In 2018, Ohio had the highest cover crop adoption rates (15%) prior to soybean. Without differentiating crops, the Ag Census found that Michigan had the highest cover crop adoption rates (9%), followed by Indiana (8%) and Ohio (7%) (Panel A in Fig. 2). Illinois was the lowest (3%). Both Ag Census and ARMS's national averages and Ag Census's estimates of state cover crop adoption rates were lower than our state estimates for most states and years.

Figure 2. Cover crop overall (Panel A, Ag Census), cover crops prior to corn (Panel B MSU-PFS), cover crops prior to soybeans (Panel C MSU-PFS), shares by states and years.
We found a dip in cover crop adoption rates for most states from 2017 to 2018 except for Illinois corn fields. Cover-crop adoption may have increased slightly from 8 to 9% for Ohio soybean fields, wherein cover crop adoption increased from 12 to 15% (Fig. 2). Cover crops may be more susceptible to harvest season temperature, precipitation, and other environmental factors limiting cover crop planting (Roesch-McNally et al., Reference Roesch-McNally, Basche, Arbuckle, Tyndall, Miguez, Bowman and Clay2018), and thus show more fluctuation in adoption rates than no-till. In comparison, Ag Census reported an overall increase in cover crop adoption for all four states from 2012 to 2017. Because of the spacing of sampling intervals, the Ag Census misses the yearly fluctuation of cover crop adoption rates, dampening confidence in the long-term increasing trend in cover crop adoption for individual states.
Discussion
We used three consecutive years of survey data to describe prevailing crop rotation, cover crop, and tillage practice for large (>100 acre) grain farms in Illinois, Indiana, Michigan, and Ohio. Results from 3914 farmer surveys showed good agreement with Ag Census and ARMS on the dominance of corn-soybean rotations, modest no-till adoption, and little cover crop acreage. However, our more detailed sampling showed yearly fluctuations in conservation practices, especially for the use of cover crops. Our survey also had larger sample sizes for Michigan and Ohio. For these two states, we found lower estimates of the single-year and continuous no-till percentage of acres before corn, and higher estimates of the no-till percentage of acres before soybeans and cover crop uses compared to national estimates. The analysis demonstrates the value of complementing national statistics with a survey with a stratified sampling design that covers more field acres and consecutive years, targets large grain farms, and collects data on the same field in consecutive years.
The results show that farm types and data collection years matter for determining prevailing practices for states and sub-national regions. Our annual farmer survey focuses on corn and soybean farms with more than 100 acres and oversampled farms with more than 500 acres, while Ag Census includes all farms, a third of which are less than 50 acres with no differentiation among crop types. Farm size and crop type may well affect the likelihood of a farm operation's use of conservation practices. Large farms may have more resources to experiment with new practices, which might explain why some of our adoption rate estimations were higher than the Ag Census estimation. Likewise, different cash crops have different management needs and constraints, affecting the adoption of conservation practices.
The yearly fluctuation in cover crop adoption rates, compared to the relatively stable albeit comparatively high adoption rates of no-till, suggests some best management practices are more sensitive to changing environmental and economic contexts. For example, harvest timing, fall precipitation, and crop and seed prices all impact cover crop decisions (Roesch-McNally et al., Reference Roesch-McNally, Basche, Arbuckle, Tyndall, Miguez, Bowman and Clay2018); these factors also tend to change from year to year, leading to the large variability of cover crop adoption rates from year to year. Such variability should be taken into consideration when gauging long-term changes in cover crop adoption and assessing the effectiveness of conservation initiatives. Importantly, multiple years of granular data may be needed to tease out the effects of certain initiatives from the naturally occurring yearly fluctuations.
The spatial coverage and temporal frequency of data collection are critically important, and our inquiry revealed the tradeoff between spatial and temporal frequency: where one is larger, the other is constrained, and the reverse may also be true. On the one hand, national-level datasets provide estimates that reveal considerable detail about specific crops in a specific year across expansive geography. On the other hand, regional datasets provide detailed information about fields and farms that provides more nuanced detail about specific crops for multiple years or successive crop seasons, more closely approximating a typical crop rotation. Although both strategies are representative, they provide different leverage points for describing the current state of on-farm practice adoption and, by extension, for crafting agricultural policy.
The comparison between our results and federal statistics provided insight on which information can be added by a regional continuous farmer survey. However, there are a few limitations of our survey approach that should be considered when interpreting the difference between the descriptions. First, ARMS randomly selected fields within a farm. In contrast, we asked farmers to report on their largest fields to provide a cognitive reference for our mail survey recipients and help farmers to report on the same field over multiple years. Using the survey question of ‘How similar is the management of this field in relation to your farm operation’, we found 87.1% of respondents managed the reported fields like all their other fields with similar soil types and field conditions or like all other fields planted in the same crop, which gave us confidence that the results were generally representative for the whole farm. That said, farmers may experiment with conservation practices on smaller or less productive fields. Compared to ARMS and Ag Census, we are likely to miss capturing the acreage under emergent management practices.
Second, measures of practices varied between surveys. We directly asked farmers to report their tillage practices in one of four categories (no-till, conservation tillage, reduced tillage, and conventional tillage) to balance survey complexity, data accuracy, and specificity. Within ARMS, tillage practices were determined using binary field management questions (Was this field no-tilled or strip-tilled?) and field operation and equipment questions (What operation or equipment was used, including all field work using machines for tillage?) (Questions from USDA-ERS NASS ARMS questionnaire). Claassen et al. (Reference Claassen, Bowman, Mcfadden, Smith and Wallander2018) converted this information to a Soil Tillage Intensity Rating, which characterizes soil disturbance due to tillage. The self-administered mailed survey method does not allow for the collection of detailed residue and operation data without sacrificing response rates. Instead, we asked respondents to report on types of tillage in the spring and fall, which kept the temporal details of the practice. The decision of how to measure the adoption of conservation practice and in which level of detail should match the questions and resources.
Third, the average response rate for our annual farmer survey was 43.5%, which was lower than Ag Census' response rate of 72% (USDA-NASS, 2017) and ARMS's response rates of 49% for Illinois, 44% for Indiana, and 53% for Michigan and Ohio (USDA-NASS, 2020), but is higher than other mail surveys on agricultural conservation practices (Arbuckle et al., Reference Arbuckle, Prokopy, Haigh, Hobbs, Knoot, Knutson, Loy, Mase, Mcguire, Morton, Tyndall and Widhalm2013; Houser et al., Reference Houser, Marquart-Pyatt, Denny, Reimer and Stuart2019). Last, although some comparisons could be performed with access to raw federal data (e.g., cover crop adoption rates by crops); the raw federal data are not publicly available. Like other human subjects' data, ARMS and Ag Census must be strictly managed to protect participants' privacy, preventing most researchers and local policymakers from accessing data for tailored analyses. Lack of data access is a procedural source of potential errors in comparing data sources. Dedicated resources will be needed to build data-sharing infrastructures including personnel along with developing privacy protection protocols in data-sharing. A grant program could be developed for researchers and local policymakers to request controlled data access.
Implications for an Agriculture Information System. Agricultural policies and industry heavily depend on accurate and timely information that reflects spatial and temporal dynamics of human and natural conditions. Our analyses revealed a need to build an agricultural information exchange and workforce that integrates diverse data sources with differing strengths and weaknesses to provide a greater understanding of agricultural management practices that provide baseline data for ‘business-as-usual’ or prevailing practices. The variance in adoption rates due to sampling years, farm types, farm sizes, measurement differences, and responses vs non-responses should be quantified further as we seek to combine and interpret different results.
Toward such an integrated system, researchers collecting farm practice data should also consider important methodological questions, such as how frequently researchers should survey producers, and at what spatial scale we should sample them. Should researchers collect more data at the regional scale at a greater frequency to complement existing federal datasets? Our research suggests annual frequency may be an appropriate time step for data gathering to consider growing operational complexity as farmer decision-making can operate simultaneously on a within-season and between-season basis, especially as climate variability increases throughout the Midwest. Capturing multiple facets of decision-making related to practice adoption is important for understanding agricultural transitions from ‘business-as-usual’ to aspirational systems. However, faced with resource constraints, annual sampling that considers the combination of crop rotation and management practices may not be realistic. Researchers must ensure data quality concerns are balanced with representativeness to enable inference for empirical models.
Other types of data may help with the dilemma of respondent burden and decreasing response rates, highlighting the importance of cross-disciplinary collaborations. The focus of our study is on producer-reported behavior although there are limitations associated with behavior surveys, such as non-response bias, self-selection bias, and memory bias. Integrating geospatial data, including remote sensing data, is likely to add precision in determining farming practices without burdening the same population groups repeatedly. With advances in satellite techniques and spatial sciences, datasets can vary widely with respect to spatial and geospatial resolutions. These data can benefit from validation with behavior surveys. Future studies might determine prevailing conservation practices combined with spatial and behavior data to critically assess the advantages and disadvantages of each data type. With diverse data sources and more temporal and spatial details, we are more likely to approach the ‘ground truthing’ of prevailing farming practices and promote the timeliness and relevance of agricultural policies.
In summary, using three consecutive years of survey data, we found a similar farming pattern (dominant corn-soybean rotation, limited use of cover crop and no-till corn, moderate use of no-till soybean) in four Midwestern US states, yet different estimates for cover crop and no-till adoption rates as compared to federal data. Portraying the intersection of practices was not as easily realized across the different data levels. Our findings show the value of combining regional and national surveys to provide greater coverage and details for improved predicting and promoting conservation policies at multiple administrative and geospatial levels. Through multiple years of data collected by different entities at varied levels, researchers and policymakers will be closer to reaching a more comprehensive picture of US conservation practices adoption rates.
Acknowledgements
We thank the altruistic farmers who took the time to complete the survey and invest in social science research. We also thank the graduate and undergraduate students who contribute to data collection and data entry.
Authors’ contributions
All authors contributed to formulating the research questions and designing the study. Dr Guo is instrumental in analyzing the data, interpreting the findings, and writing the article. Dr Marquart-Pyatt conducted data collection and reviewed the manuscript. Dr Robertson secured the funding and reviewed the manuscript.
Funding statement
Support for this research was also provided by the NSF Long-term Ecological Research Program (DEB 1832042) at the Kellogg Biological Station, by Michigan State University AgBioResearch, and by the USDA Long-term Agroecosystem Research Network program.
Competing interests
None.


 Open access