


Impact Statement
This study describes the first longitudinal examination of patterns and durations of vessel noise events and quiet intervals in the underwater environment of Glacier Bay National Park and Preserve. Previously, this type of analysis was hampered by the magnitude of the task of classifying and measuring noise events. To address this issue, we explored the use of a convolutional neural net to detect vessel noise in passive acoustic recordings. Machine learning is a field of growing interest in natural resource management that has the potential to enable rapid and accurate data summaries. Developing these techniques will help National Park Service managers more fully describe the underwater acoustic environment and assess the effects of vessel traffic, which is primarily related to tourism, on marine mammal communication.
1. Introduction
Soundscape monitoring is of high priority to the United States (U.S.) National Park Service (NPS), which considers the preservation of natural sounds to be integral to wildlife conservation and ecosystem health in both marine and terrestrial environments (Hatch and Fristrup, Reference Hatch and Fristrup2009; Buxton et al., Reference Buxton, McKenna, Mennitt, Brown, Fristrup, Crooks, Angeloni and Wittemyer2019). In Southeast Alaska, Glacier Bay National Park and Preserve (GBNP) is an important habitat for many protected species that rely on sound for essential life history functions. In the summer months, GBNP is also a tourism destination where daily cruise tours and private vessels take visitors into park waters to view glaciers, humpback whales, seals, and other wildlife. These tourism vessels generate sound that can dominate the acoustic environment, which also contains natural environmental and animal sound sources (Frankel et al., Reference Frankel and Gabriele2017; McKenna et al., Reference McKenna, Gabriele and Kipple2017; Gabriele et al., Reference Gabriele, Ponirakis, Clark, Womble and Vanselow2018, Reference Gabriele, Ponirakis and Klinck2021).
The underwater soundscape of GBNP is unique among marine protected areas in the United States due to its remote location as park waters are isolated from much of the vessel traffic occurring in the Inside Passage of Southeast Alaska. Vessels entering GBNP waters are strictly managed throughout the May–September tourist season with a quota system that limits daily visitors and requires permits at peak visitation times (McKenna et al., Reference McKenna, Gabriele and Kipple2017).
Passive acoustic monitoring is one tool that NPS managers use to observe sound sources in the underwater environment, including vessels, and as a result, GBNP is one of the very few places in the world that can identify the individual vessels that are producing underwater sound or have measured the sound profiles of individual vessels. Since 2000, the NPS has monitored underwater sound near the entrance to GBNP. In collaboration with the Naval Surface Warfare Center Carderock Division, a single cabled hydrophone was installed to continuously record underwater sounds. Over the past two decades, recordings from the hydrophone have provided data for NPS researchers to better understand the sources and biological implications of underwater sound pollution in Glacier Bay, with direct relevance to vessel management (Frankel and Gabriele, Reference Frankel and Gabriele2017; McKenna et al., Reference McKenna, Gabriele and Kipple2017; Gabriele et al., Reference Gabriele, Ponirakis and Klinck2021).
Management decisions about vessel traffic rely on a thorough understanding of GBNP’s underwater sound environment, to protect both the natural environment as a resource and the marine biota that rely on the natural underwater soundscape to carry out essential life functions. For this reason, the GBNP Resource Stewardship Strategy lists a goal to “maintain underwater acoustic monitoring station in Bartlett Cove and conduct periodic quantitative analyses to describe change in the underwater soundscape over time” (Nadeau et al., Reference Nadeau, Allen, Davis, Gardner, Benck, Komp, Meinke, Zanon and Robertson2017). Previous efforts to analyze and monitor the underwater soundscape in GBNP have focused on characterizing ambient noise, studying humpback whale and harbor seal vocal patterns, and using agent-based models to understand communication masking and exposure to vessel noise (Frankel and Gabriele, Reference Frankel and Gabriele2017; McKenna et al., Reference McKenna, Gabriele and Kipple2017; Fournet et al., Reference Fournet, Matthews, Gabriele, Haver, Mellinger and Klinck2018; Gabriele et al., Reference Gabriele, Ponirakis, Clark, Womble and Vanselow2018, Reference Gabriele, Ponirakis and Klinck2021).
Here, we focus on the presence and absence of vessel noise to quantify the proportion of time that vessel noise is audible in the recording location (McKenna et al., Reference McKenna, Gabriele and Kipple2017), and the pattern and duration of “noise-free intervals (NFIs).” NFIs are a biologically relevant measurement of underwater acoustic conditions for humpback whales and other soniferous species in GBNP which rely on sound for life functions and may be impacted by extended durations of uninterrupted vessel noise (Lynch et al., Reference Lynch, Joyce and Fristrup2011; Betchkal, Reference Betchkal2019; Erbe et al., Reference Erbe, Marley, Schoeman, Smith, Trigg and Embling2019). For example, while humpback whales have been observed to increase the source level of their vocalizations to overcome increases in ambient sound levels (i.e., Lombard effect; Lombard, Reference Lombard1911), they are also likely to stop vocalizing as ambient sound levels increase especially if the noise source is a motorized vessel (Fournet et al., Reference Fournet, Matthews, Gabriele, Haver, Mellinger and Klinck2018). When vessel noise was present, whales were one-third to nearly one-half as likely to vocalize in the presence of vessel noise compared to vessel noise-free conditions (Fournet et al., Reference Fournet, Matthews, Gabriele, Haver, Mellinger and Klinck2018). Thus, the duration of vessel noise intervals in comparison to vessel noise-free conditions is biologically relevant to humpback whales and ostensibly other marine animals in GBNP. While the NFI is a standard metric used in terrestrial soundscape analysis, it has not yet been described in GBNP or other studies of marine environments. Monitoring NFIs in addition to ambient sound levels, provides additional information about habitat conditions for humpback whales and other marine species.
In this study, we utilize a convolutional neural network (CNN) machine-learning (ML) model trained on previously labeled hydrophone data collected in GBNP. The trained model allows us to automate the detection and classification of vessel noise with higher resolution and longer sampling periods. The CNN was verified with acceptable performance on 3 years (2017, 2018, and 2020) of passive acoustic data collected between May and September when most vessel-based tourism occurs in GBNP (McKenna et al., Reference McKenna, Gabriele and Kipple2017; Gabriele et al., Reference Gabriele, Ponirakis and Klinck2021). The sound levels of these data were previously analyzed to evaluate the acoustic impact of dramatic tourism reduction at the onset of the COVID-19 pandemic in 2020 (Gabriele et al., Reference Gabriele, Ponirakis and Klinck2021). Adding an additional metric to the soundscape analysis of the existing dataset, here, we utilize the CNN to quantify the hourly proportions (HP) of vessel noise to vessel noise-free, and the occurrence and duration of vessel NFIs. While this project was limited in scope and resources, ongoing availability of continuous audio recordings from GBNP may enable additional analysis to continue to provide information about soundscape conditions to park managers and stakeholders.
2. Methods
2.1. Instrumentation
A single cabled hydrophone has been recording in Glacier Bay National Park since 2000. The acoustic recorder is deployed within the park waters near Bartlett Cove (58.43501 N, 135.92297 W) on an anchored tripod (1 m above the seabed) at a depth of 30 m (Figure 1). The calibrated omnidirectional hydrophone is ITC type 8215A with a nominal sensitivity −174 dB re 1 V/μPa (Gavial ITC Inc., Santa Barbara, CA, USA). Continuous audio data transmitted to a control unit at the park headquarters via a submerged cable was sampled at 22,048 Hz to generate 5-min AIF files (Gabriele et al., Reference Gabriele, Ponirakis and Klinck2021).
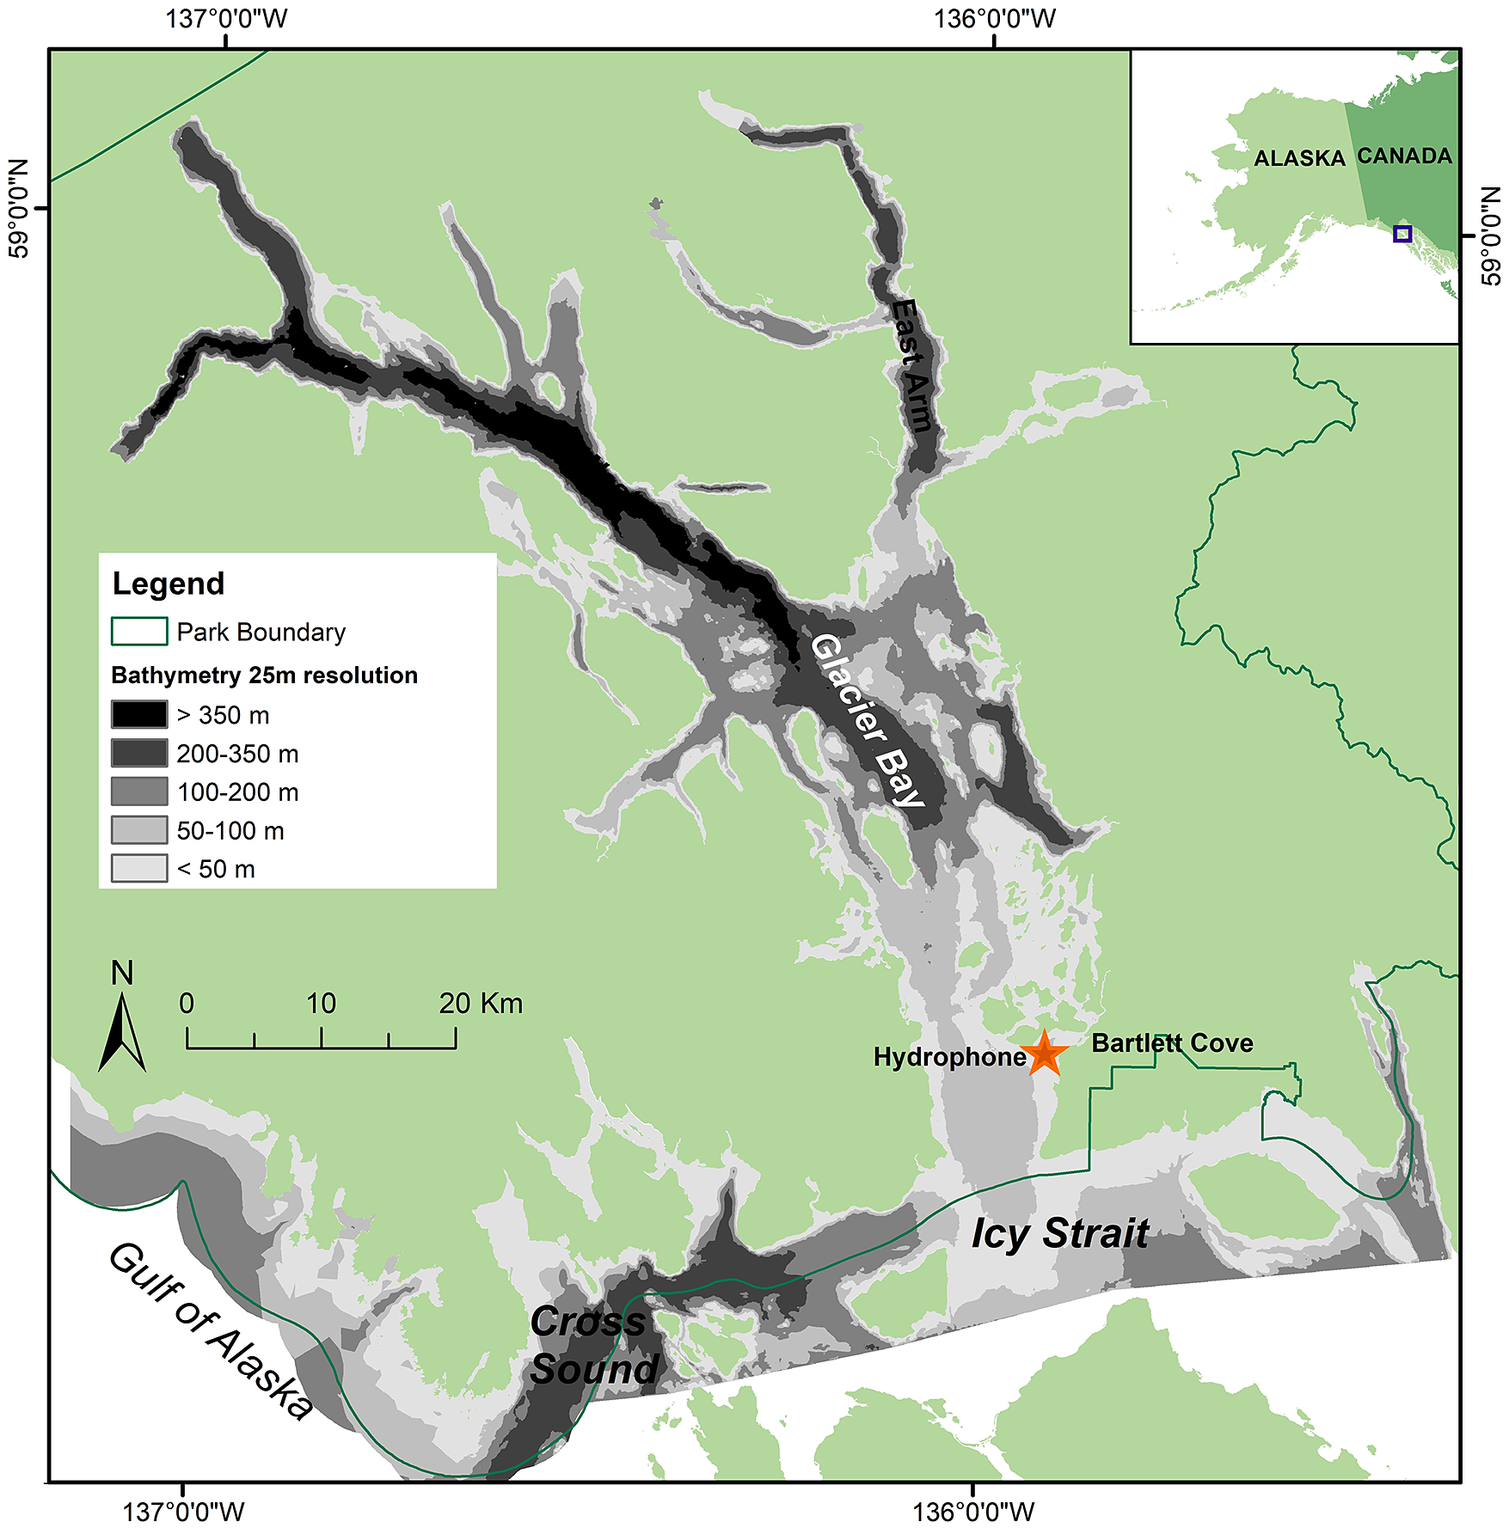
Figure 1. Map showing the location of the cabled hydrophone (orange star) at Bartlett Cove within Glacier Bay National Park (adapted from Gabriele et al., Reference Gabriele, Ponirakis and Klinck2021).
2.2. Passive acoustic dataset
In this study, we sought to perform a new analysis of the most recently available data (continuous audio recordings from 2017, 2018, and 2020; Gabriele et al., Reference Gabriele, Ponirakis and Klinck2021). The recording system was inactive in 2019. Our strategy for analyzing this data started with creating an ML model from previously labeled data from the same hydrophone. Then, we labeled a subset of the most recent data via human observation and used the ML model to classify the remainder of this recent dataset.
The main visitor season for passenger and private vessels to transit through park waters is June–August annually, and “shoulder” season, characterized by fewer vessels, in the months of May and September. Acoustic data sampled between May 1 to September 30 in 2018 and 2020, and June 1 to August 31 in 2017 were analyzed in monthly time periods. May and September 2017 were not analyzed due to data availability. Minor data gaps of a few hours to a few days are interspersed throughout the analyzed data due to brief system outages.
2.3. Machine-learning methods
2.3.1. Machine-learning model development
Data for training the ML model used here was taken from a set of Bartlett Cove hydrophone recordings (mainly from 2000, 2001, and 2008) previously labeled by U.S. Navy acoustic engineers using custom-built analyst software (Kipple and Gabriele, Reference Kipple and Gabriele2004). These recordings come from the same hydrophone and data acquisition system as was newly analyzed for this publication. This custom Navy analyst software displays a spectrogram while playing the sound from a short clip taken from the beginning of every hour (Kipple and Gabriele, Reference Kipple and Gabriele2004; McKenna et al., Reference McKenna, Gabriele and Kipple2017). The length of each short clip labeled by the analyst in previously published work varied slightly, between 21 and 23 s. Most often, the length was 22.3 s. Over the course of several years of data collection, this process created several thousand labeled short clips in previously published categories that included several sizes of marine vessels, humpback whales, and harbor seals. The label simply indicates that an analyst believed the putative sound source to be present within a range of the hydrophone (Figure 2a).
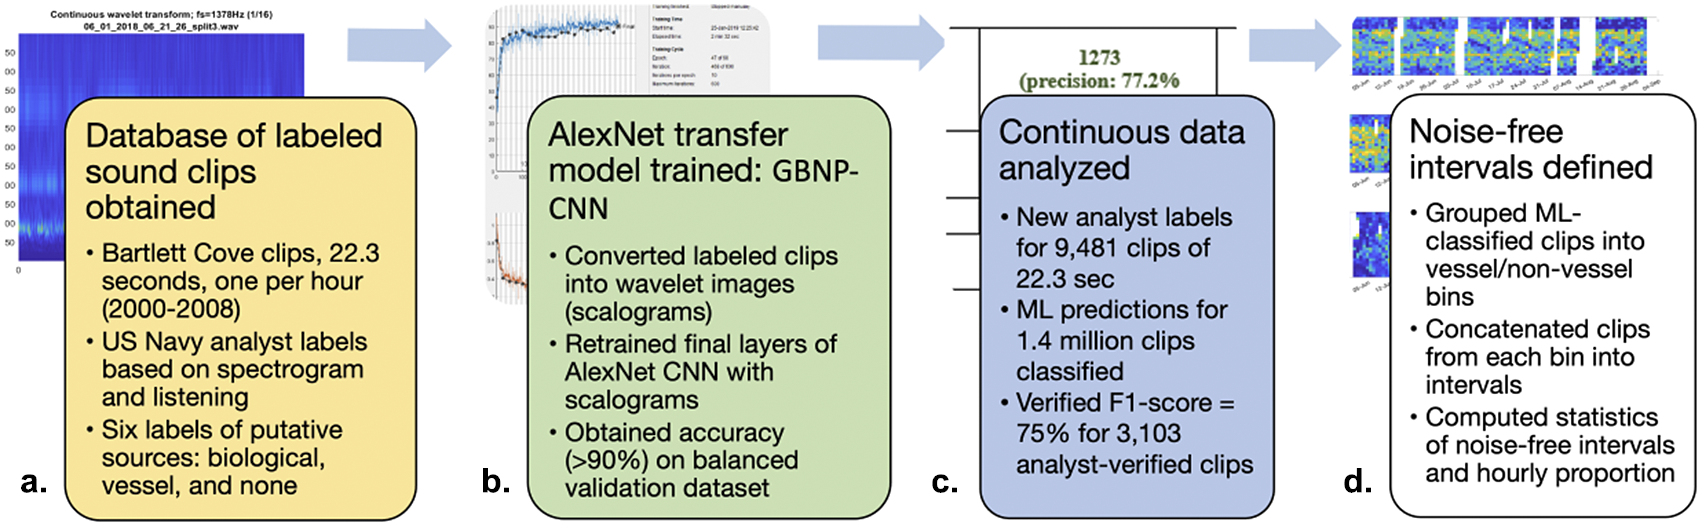
Figure 2. Schematic of the methodology showing the supervised machine-learning (ML) modeling process from (a) compiling previously labeled 22 s sound clips, (b) to training an ML model (GBNP-CNN) on six categories of labels, (c) to using the trained model to categorize newer, continuous data from the same hydrophone. Finally, (d) the non-vessel and vessel labels are grouped separately to form vessel NFIs.
We created an ML model, as described in the next paragraph, for six categories: (1) humpback whale, (2) harbor seal, (3) small marine vessel (MV), (4) medium MV, (5) large MV, and (6) none of the above. We kept all six categories because we seek to create an explainable model with utility for a wider variety of studies beyond the scope of this work. The number of training data points was capped at the number of usable humpback whale vocalization clips (N = 479), so that the training set would be balanced. Humpback vocalizations were mainly short transients (Fournet et al., Reference Fournet, Szabo and Mellinger2015) while the harbor seal roars were typical of previously noted vocalizations (Matthews et al., Reference Matthews, Parks, Fournet, Gabriele, Womble and Klinck2017). Small MV are believed to be recreational craft with high RPM outboard motors and large MV are known to be the commercial cruise ships that are selectively permitted to enter GBNP. The “none” or “other” category can include ambient noise and acquisition system interference of various types. The wide range of unknown sound sources in this naturalistic data is a challenge to creating a high-performing ML model.
A CNN ML classification model was trained for these six categories of putative sound sources recorded at the hydrophone in Bartlett Cove (Figure 2b). An image-based transfer-learning approach was implemented on the basis of the AlexNet CNN computer vision model (Krizhevsky et al., Reference Krizhevsky, Sutskever and Hinton2012). AlexNet was originally designed for and trained on photographic images, which allowed it to learn a variety of basic geometric shapes and patterns. We chose to leverage transfer learning because of the small number of labeled samples from the humpback whale category. This CNN transfer-learning approach was also recently used with ResNet-50 for fish acoustics on a tropical reef (Munger et al., Reference Munger, Herrera, Haver, Waterhouse, McKenna, Dziak, Gedamke, Heppell and Haxel2022).
We created images for re-training the AlexNet architecture by processing the previously published 22.3 s hydrophone sound clips into 2D short-time wavelet transformed images (scalograms; Figure 2b). The scalograms (see Figure 3a,b for two examples) were generated using the Matlab functions cwtfilterbank() and cwt() with the signal decimated from 22,048 Hz to 1,378 Hz. The default analytic Morse (γ = 3, β = 60) wavelet was consistently used with 16 voices per octave (Lilly, Reference Lilly2016). This Morse wavelet is exactly symmetric in frequency space (γ = 3) with a time-bandwidth product β = 60. This combination of image generation parameters was chosen to balance processing time and accuracy by limiting the frequency bandwidth to 600 Hz.
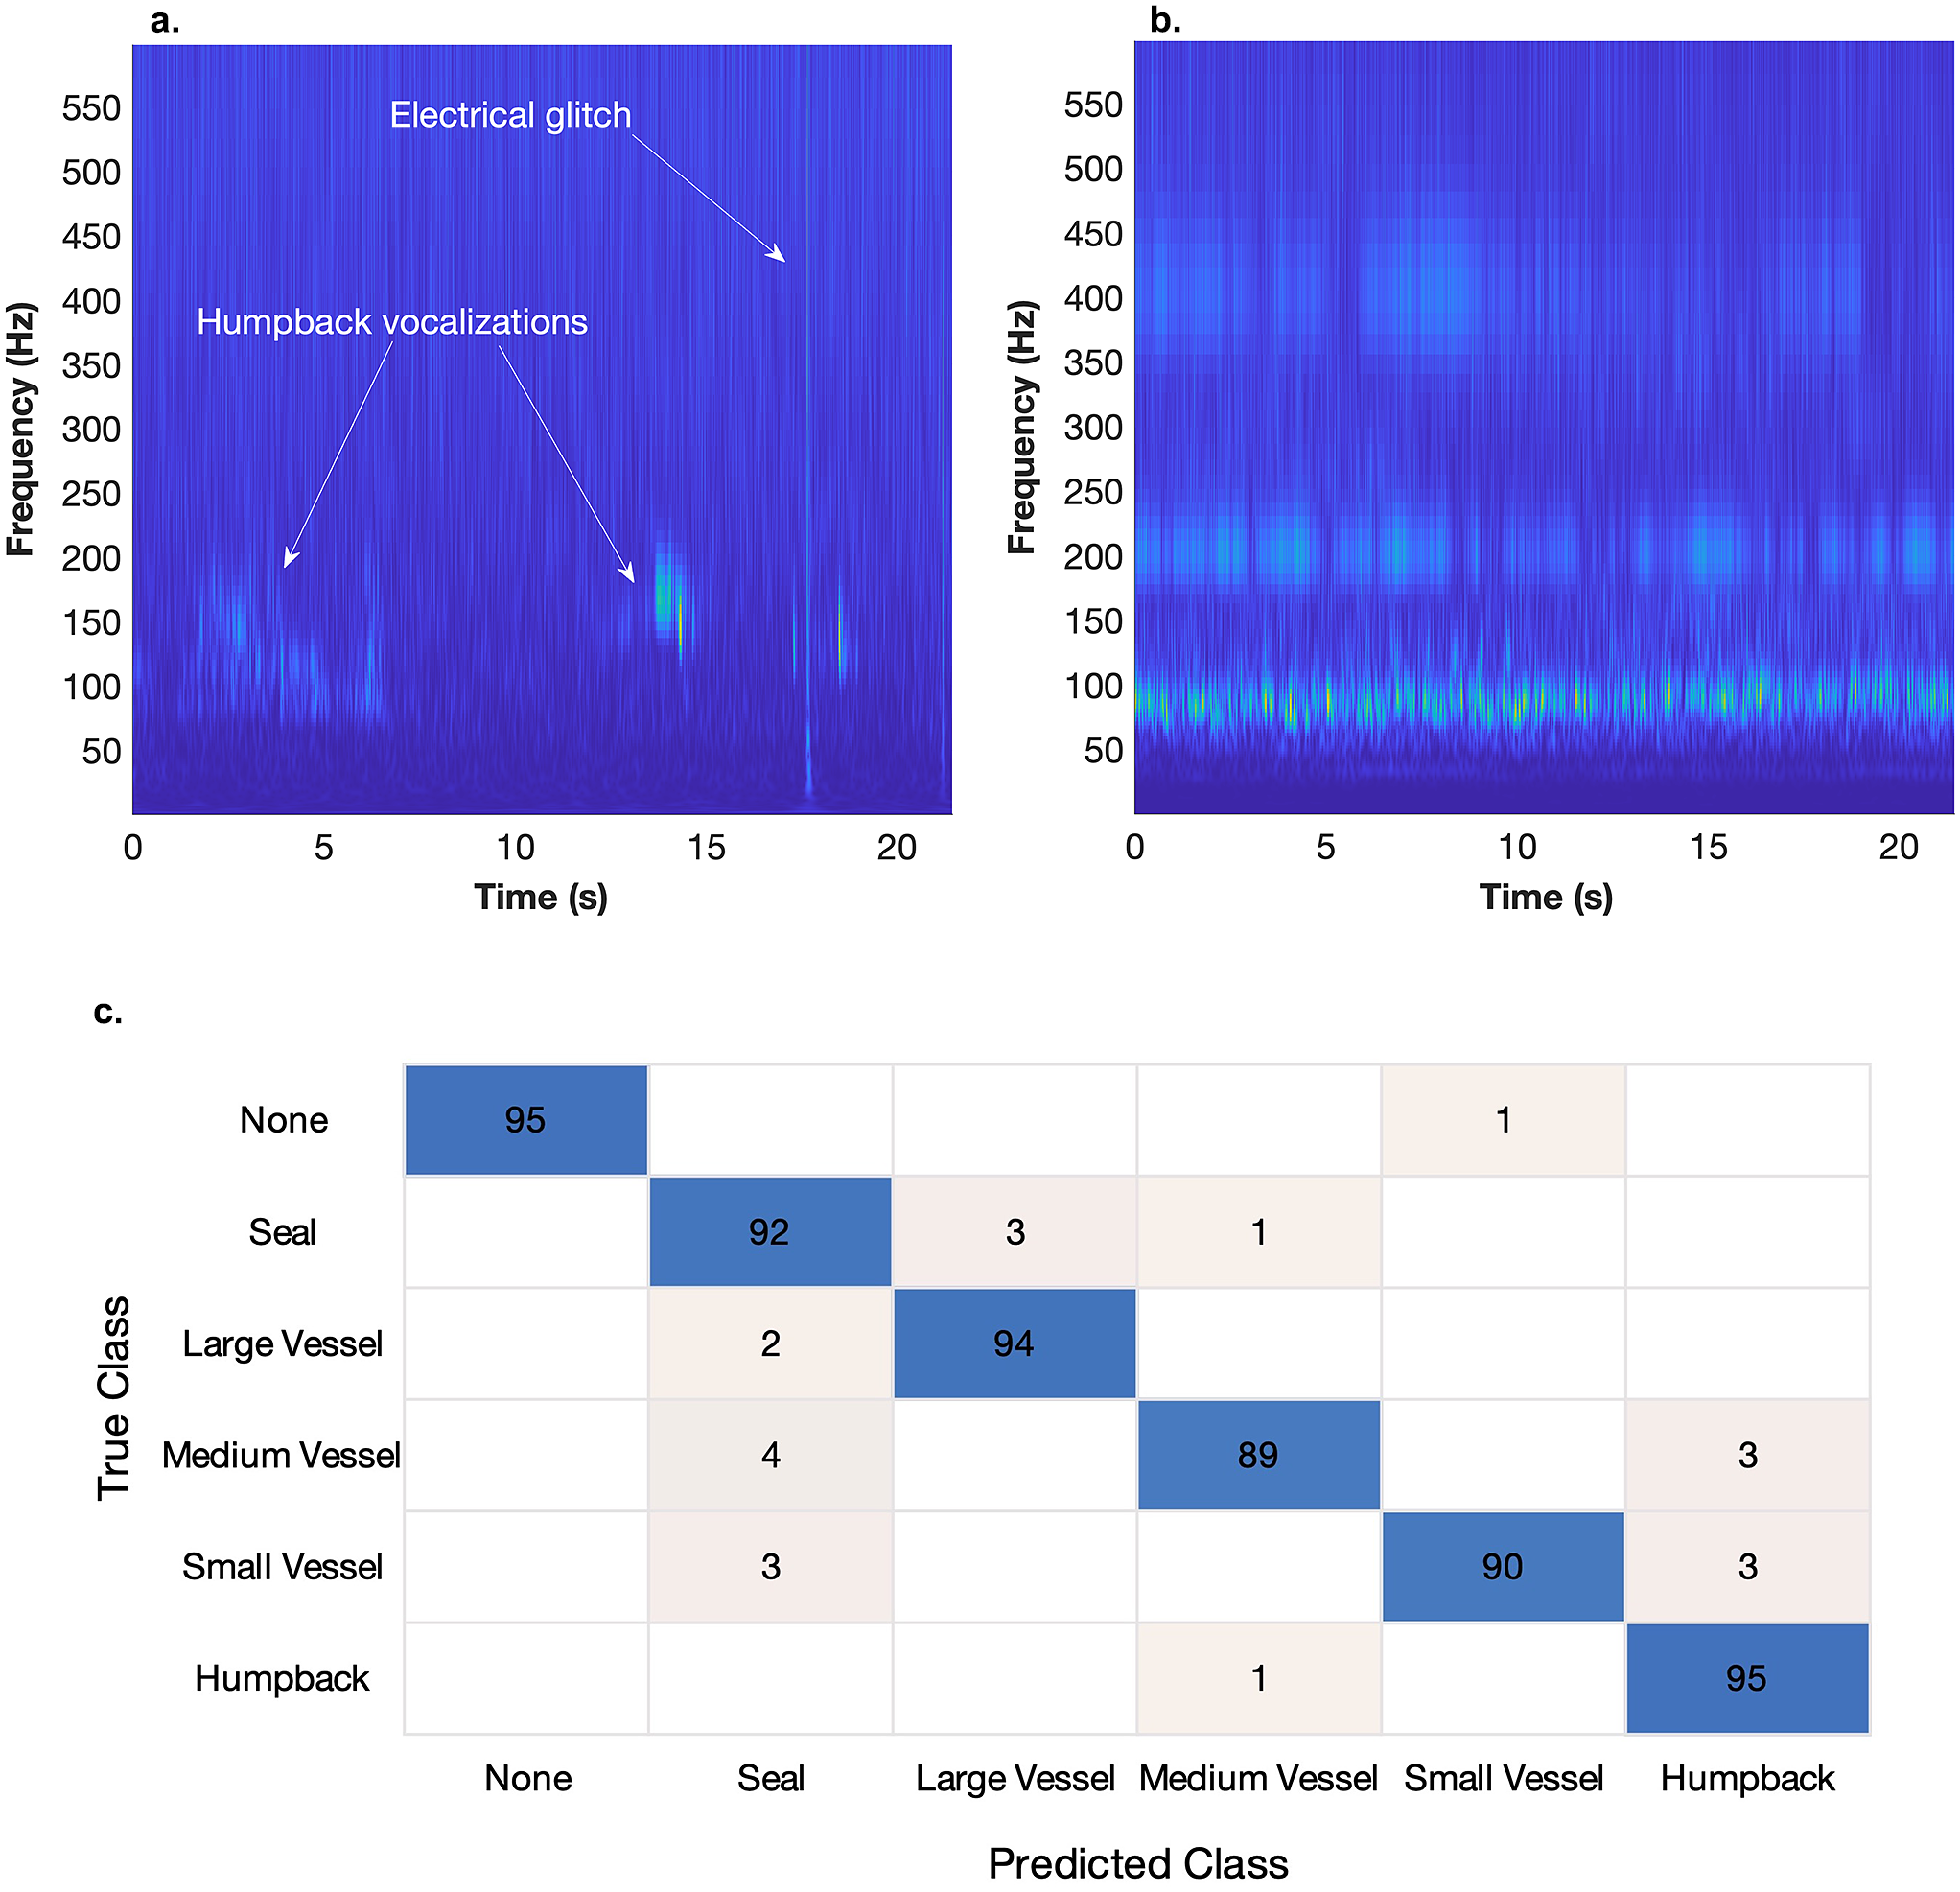
Figure 3. (a) A wavelet scalogram from a 22.3 s clip recorded from the Bartlett Cove GBNP hydrophone taken in August 2020. This sample was manually annotated by an experienced analyst to contain a humpback vocalization. It also contained a very short electrical glitch. There was no audible vessel noise in this clip. (b) A wavelet scalogram of a hydrophone recording taken on June 1, 2020. An experienced analyst determined that this sample contained vessel noise without audible biological noise. The vessel signal is visible as nearly continuous sound at 100 and 200 Hz. However, the CNN model scored this as a biological signal, apparently due to the intermittency that is similar to vocalizations. This image was generated identically to Figure 3a using Matlab. (c) Cross-validation performance of the AlexNet transfer-learned model on the hold-out six-category expert-labeled data from Bartlett Cove reported as raw numbers (N = 576 total samples, n = 96 from six categories). Overall accuracy of the model on this cross-validation data was 96%, though nearly 10% of the harbor seal sounds are misclassified as vessels. Here, we see that both harbor seals and humpback whales can be misclassified as vessels.
We transferred AlexNet into a new model in Matlab (MathWorks Inc., 2018) by replacing the last three layers of AlexNet. The entire AlexNet CNN was then retrained with the six-category sound source scalograms until the cross-validation accuracy plateaued with balanced high performance (Figure 3c). For each category, 20% of the data (n = 96 from each category) were held out as independent samples for cross-validation.
This new transfer AlexNet scalogram model for the Bartlett Cove hydrophone (GBNP-CNN) was then used to classify continuous recordings using the same methodology at a larger scale (Figure 2c). Continuous audio files from previously recorded but unanalyzed GBNP data were split into 22.3 s, non-overlapping segments for consistency with the previously labeled data used for training the GBNP-CNN. Using the same method as described above to create scalograms, each contiguous 22.3 s segment was classified using the Matlab classify() function with the GBNP-CNN as the input model. This returned a score for each of the six categories, such that we assigned the highest scoring categorical label to the audio clip. While multiple sources are sometimes present in each clip, and each source can have a distinct duration, the GBNP-CNN top score is used simply to select a single putative source for each clip. As described next, for the purposes of this study, we then separated the labels into vessel and non-vessel (Figure 2d). We also tested a three-class (vessel/no-vessel/none) model using the same AlexNet transfer method on scalograms and found similar cross-validation results. We also attempted to use Fourier spectrograms for the data processing, but the spectrograms were much less accurate for the transient biological sources.
2.3.2. Verification
Time-stamped audio clips of 22.3 s duration labeled by the GBNP-CNN model as humpback whale (3,091 clips), seal (2,112 clips), and grouped vessel type (4,278 clips) classification categories were randomly selected for manual review and verification. An experienced observer (S.M.H.) individually reviewed the 9,481 audio clips (58 hr of data) for classification accuracy as a spectrogram image with playback in Raven Pro software (Version 1.6, Cornell University). Each sound source classification was visually and aurally checked to verify accuracy, and clips were manually rated according to precision including if a different and/or additional sound source was audible (Figure 2c).
In total, GBNP-CNN classified 1,407,907 sound clips (8,672 hr) from the 3 years of recent GBNP data. We then combined all vessel classes into a single vessel group and specifically focused on the classification results for the grouped vessel category. Clips for which the GBNP-CNN classified sound sources that were not vessels (whale, seal, or none) were grouped as “vessel noise-free” (Figure 2d). GBNP-CNN performance was quantified by comparing classification of 3,103 audio clips (selected randomly from all classified clips) to an experienced analyst’s annotated observations of the presence of all sound sources within the same time-stamped file, as described in Section 3.1. In some instances, the analyst detected multiple sound sources, though we constrained GBNP-CNN to choose a single classification for each sound clip. In all cases, the test clip ML label was scored as correct if the analyst noted the same sound source.
2.4. Quantifying vessel noise-free intervals
We calculated the proportion of each hour that contained vessel noise (hourly proportion, HP) and defined the duration of vessel NFIs as continuous timespans uninterrupted by putative vessel noise. All non-vessel categorizations (ambient and biologic) were grouped together as NFI. NFIs were computed by concatenating the total length of consecutive sound clips uninterrupted by vessel noise. HPs were quantified by calculating the total number of audio clips with vessel noise detected as a percentage of all classified audio clips in hourly bins. For each year, diel patterns of vessel noise-free samples were calculated for each month of data collection (May–September) and by time of day (daytime defined as 06:00–20:00 AKDT and nighttime defined as 20:00–06:00 AKDT; Gabriele et al., Reference Gabriele, Ponirakis and Klinck2021).
NFI duration measurements were also used to calculate cumulative probability curves for NFI between 22.3 s to over an hour for each individual month from May to September, separated by daytime and nighttime hours. The empirical cumulative distribution curve for each month and time grouping was calculated using the Statistics and Machine Learning Toolbox in Matlab 2021b (MathWorks Inc., 2021).
3. Results
3.1. Machine-learning model performance
Performance of the GBNP-CNN on the new test set of continuous recordings was evaluated by comparing the GBNP-CNN classification (predicted class) to new analyst-verified data annotations (true class) of time-aligned acoustic data files (Table 1). Based on comparison of 3,103 random clips throughout the data set, precision, recall, and F1 metrics for vessel noise detections were calculated. Precision was 77%, meaning that of all clips classified as vessel, only 77% of those clips contained vessel noise (and the other 23% were false positives). The recall of GBNP-CNN was slightly lower (73%), meaning that only 73% of the clips containing vessel noise were identified (the other 27% were false negatives). The F1 score, which combines precision and recall scores, was 75%. Generally, GBNP-CNN was slightly more likely to underestimate vessel detections, but the bias is not substantially different from the 75% F1 score.
Table 1. Comparison of vessel noise detections between the ML predicted output and human-analyst data annotations of 3,103 random 22.3 s sound clips.
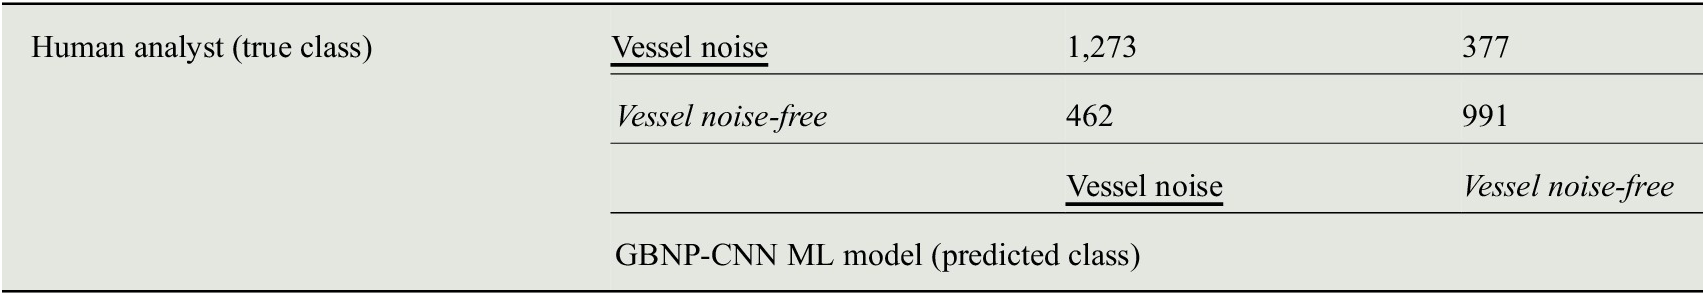
Note. The ML classifier correctly identified 77% of positive occurrences of vessel noise in the test samples, and correctly identified 68% vessel noise-free sound clips (true negative rate). The F1 score for GBNP-NPP, which combines the precision (77.2%) and recall (73.4%), was 75%.
While this performance is not as finely tuned as a facial recognition model, for example, it is sufficient to inform the following statistics for noise-free percentage and longitudinal changes in vessel noise patterns. Test performance was significantly lower than cross-validation on due to several factors. For one, there is variability in the quality of the data from year to year as the hydrophone data acquisition system requires maintenance. Another point is that the detected vessels are likely to vary from year to year. These non-controlled noise factors lead to a larger variance in the signals that correspond to a broadly applied label. We must also consider that the labels applied to the test set came from a different analyst compared to the training and cross-validation.
3.2. Quantifying frequency and interval duration of vessel noise-free conditions
3.2.1. Patterns of occurrence
GBNP-CNN results for the presence or absence of vessel noise in each sample were tabulated as a percentage of the entire hour for all complete hours of recorded data without recording gaps (HP, Figure 4). Between May and September (June to August in 2017) a consistent diel pattern of more vessel noise-free samples was observed during nighttime (20:00–06:00 AKDT), compared to daytime hours (06:00–20:00 AKDT). In 2017 and 2018, many nighttime hours were mostly or entirely vessel noise-free, but daytime hours were vessel noise-free typically only 50% or less of all daytime hours combined. Comparatively, in 2020, many daytime hours were vessel noise-free and were similar to nighttime hours in 2017 and 2018. During the peak-tourism months in June–August in all years, less than half of the time within each hour was vessel noise-free (HP) during morning (06:00–09:00) and afternoon (15:00–18:00) peak times. In 2018, HP during the months of June, July, and August (~42% of all hours) was higher compared to the shoulder season months of May and September (37% and 24% of all hours, respectively). In June, July, and August 2017, 36% of hours contained at least one sound clip with vessel noise, which is a ~6% decrease of HP compared to what we observed in 2018. Not surprisingly, HP were reduced in 2020 (~25% in June, July, and August) as compared with 2017 and 2018. This difference across years is slightly more pronounced in the daytime hours, compared to nighttime.
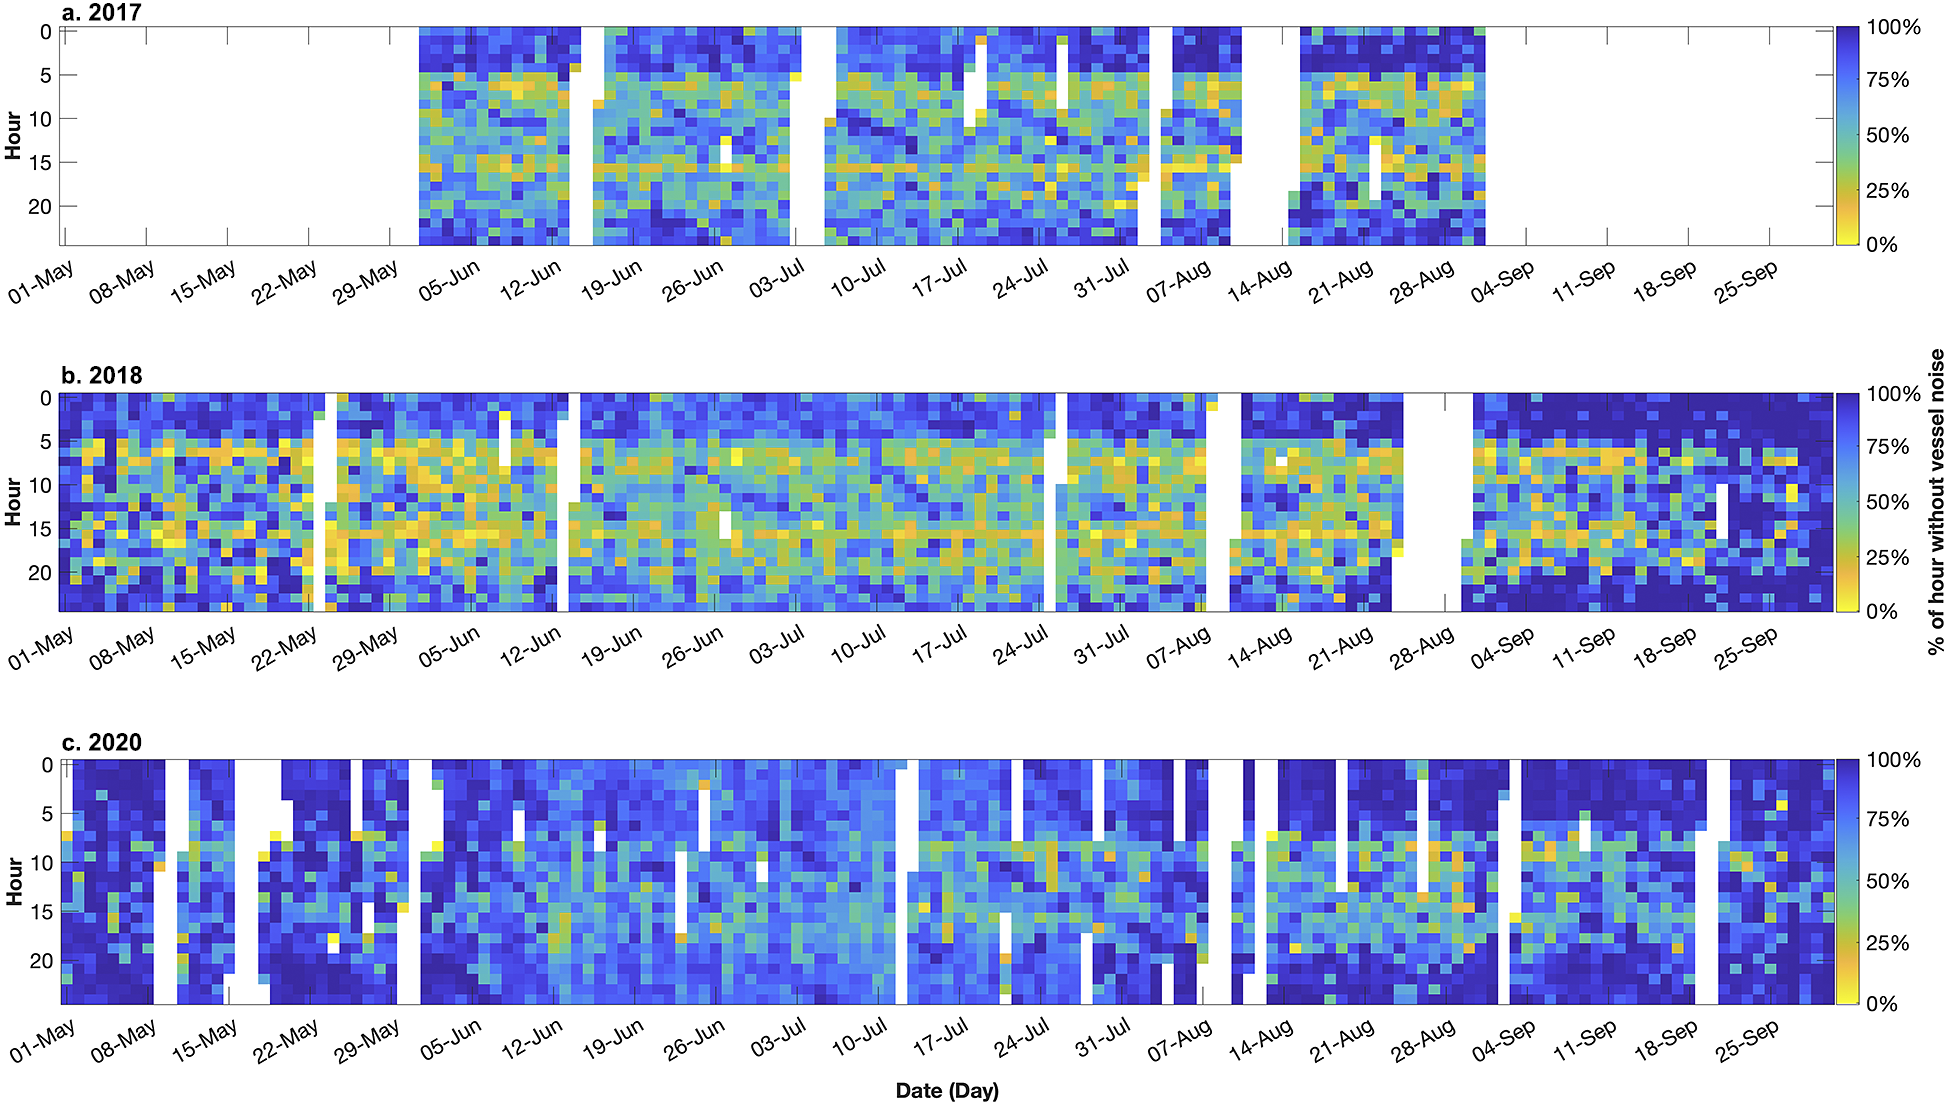
Figure 4. Temporal summary of GBNP-CNN ML classifier detections of vessel noise free intervals for 2017 (a), 2018 (b), and 2020 (c), plotted by day (May–September) and hour (0–23). Color (yellow–green–blue) indicates the aggregated duration of vessel NFIs per hour; hours with the fewest vessel NFIs (i.e., constant vessel noise) are bright yellow and hours with minimal to no vessel noise are dark blue. White sections are data gaps. 2020 (c) was an anomalous year with much lower vessel traffic due to COVID-19 lockdown.
Across all years, more vessel noise-free samples were detected during nighttime hours. The largest percentage of HP was detected in June, July, and August 2018 during daytime hours (~53%; Figure 5). In contrast, the same months in 2020 had the lowest percentage of HP (32–27%). During the shoulder season months of May and September in 2020, only 10% of nighttime samples contained vessel noise. In the peak season months of June, July, and August in 2020, 7–21% of nighttime samples contained vessel noise (Figure 5). In comparison, in 2018, 21–27% of nighttime samples from June through August contained vessel noise.
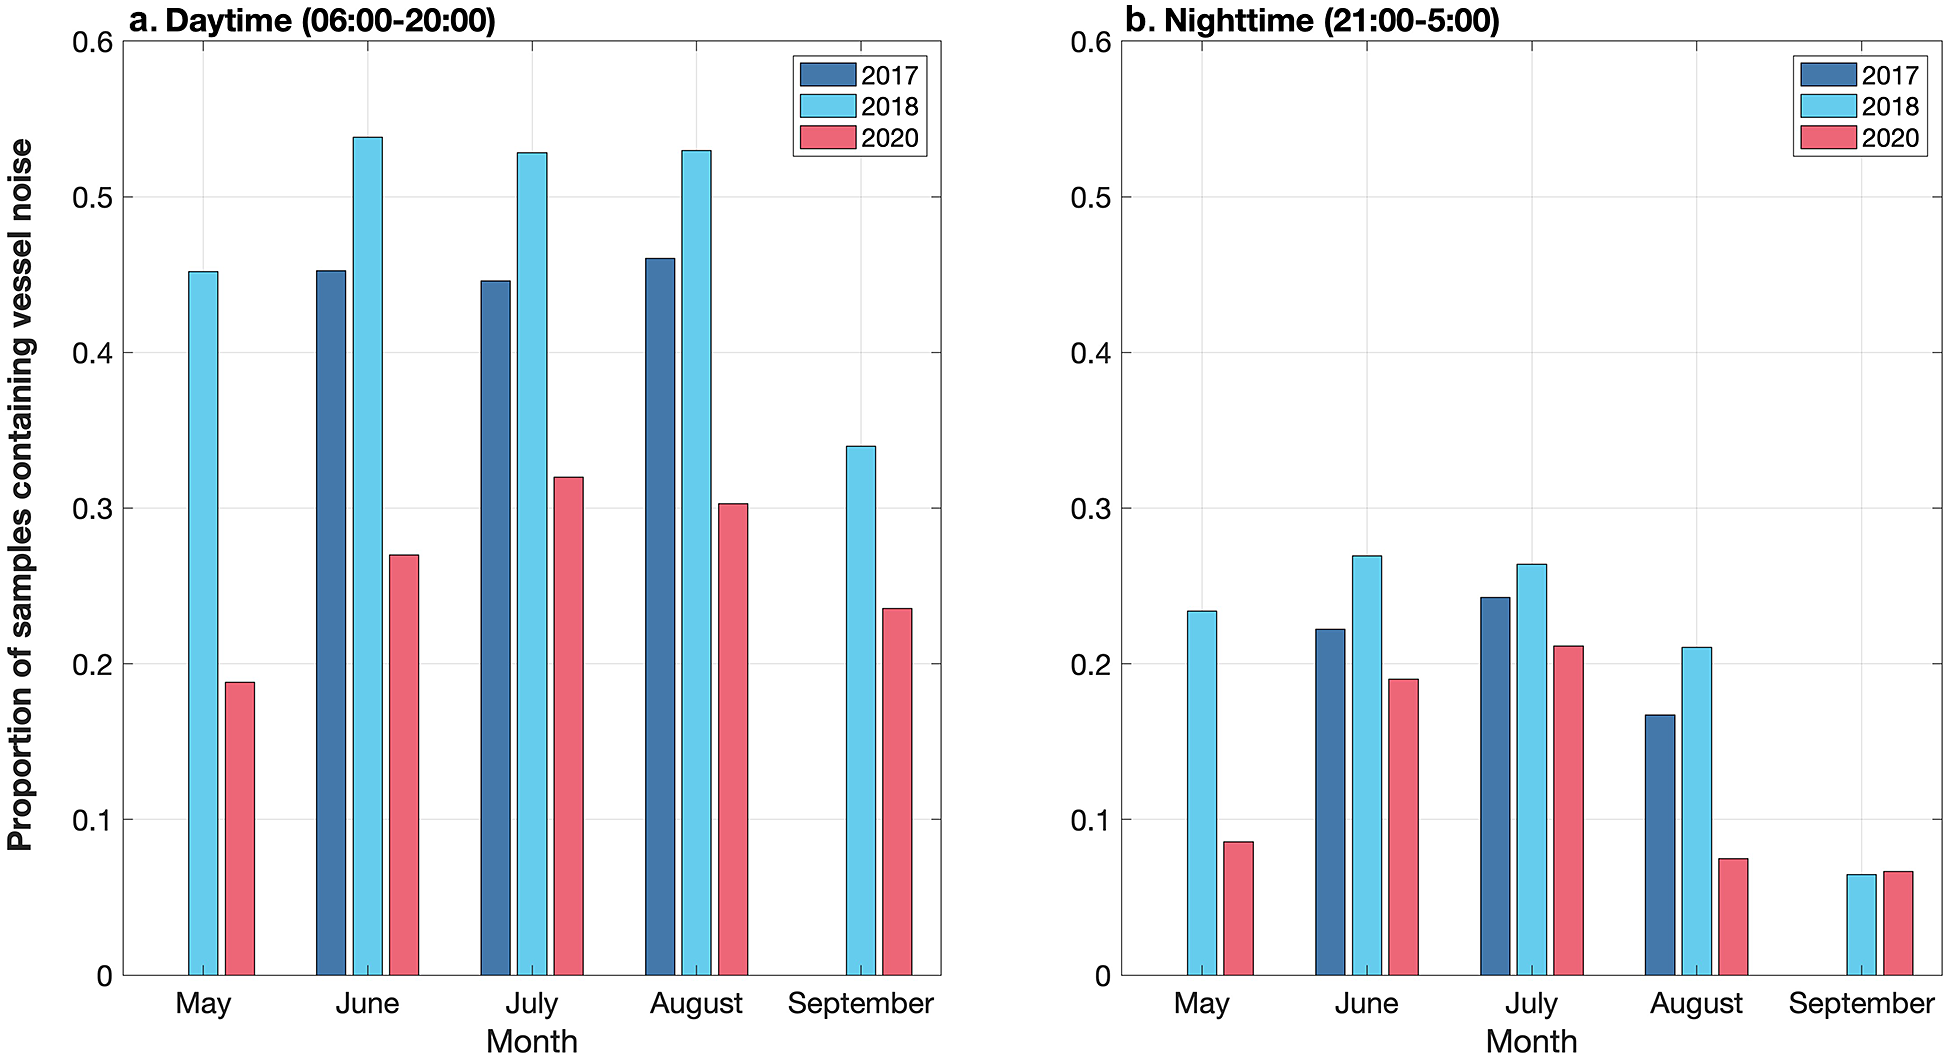
Figure 5. Monthly proportion of samples containing vessel noise calculated from hourly proportions (HP) as a percentage of all acoustic samples in each month from May to September for both daytime (a) and nighttime (b) time periods.
3.2.2. Durations of vessel noise-free intervals
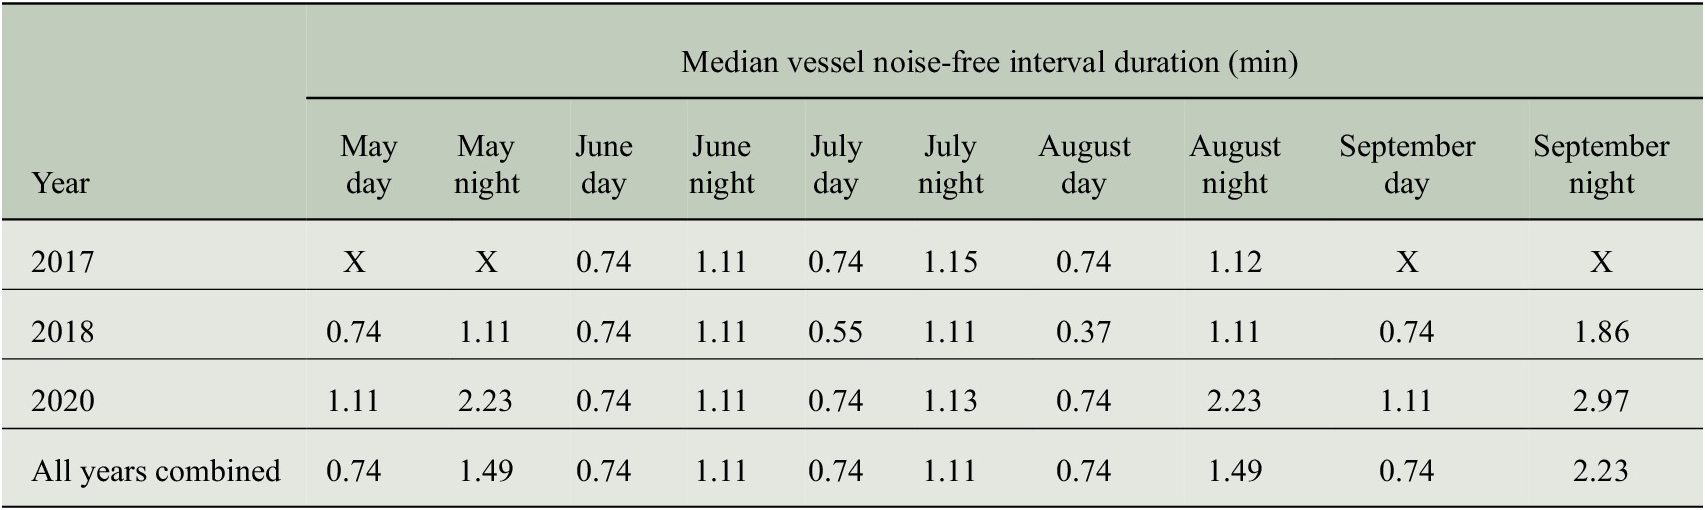
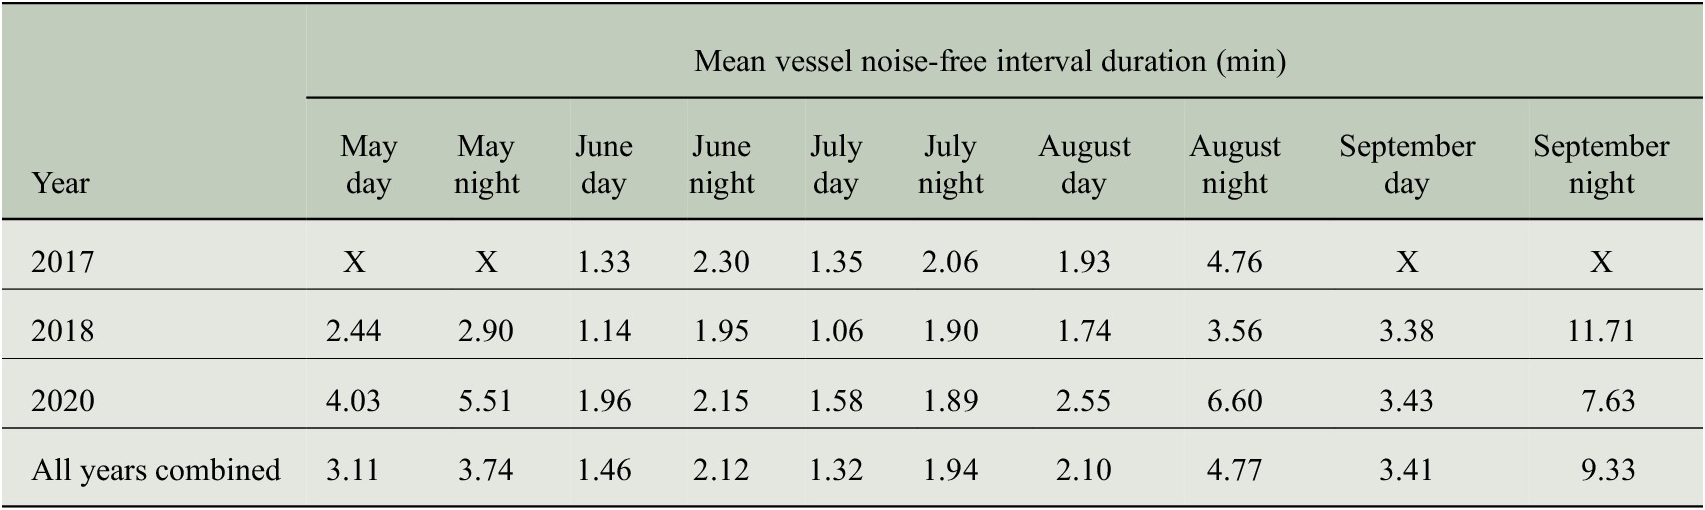
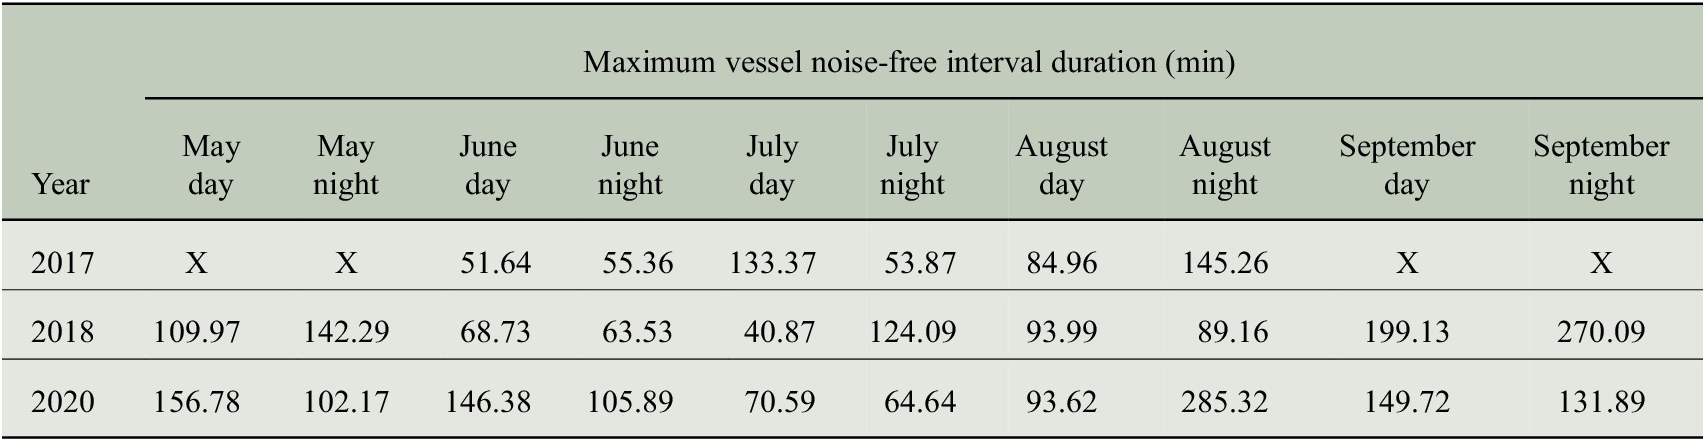
Duration of vessel NFIs was measured as continuous timespans uninterrupted by vessel noise (Figure 6). NFI during daylight hours was shorter (mean 7.18 min and median 0.22 min) than nighttime (mean 7.40 min and median 1.15 min). Across the 5 months, mean NFI during the main tourism season in June, July, and August, were shorter than NFI in May and September (Figure 7 and Appendix A). The longest mean NFI durations were observed in 2020 during nighttime hours (mean 7.5 min and max 4.76 hr), and between June and August in all years approximately 100 NFI of greater than 60 min duration were observed in nighttime hours (Figures 6 and 7).
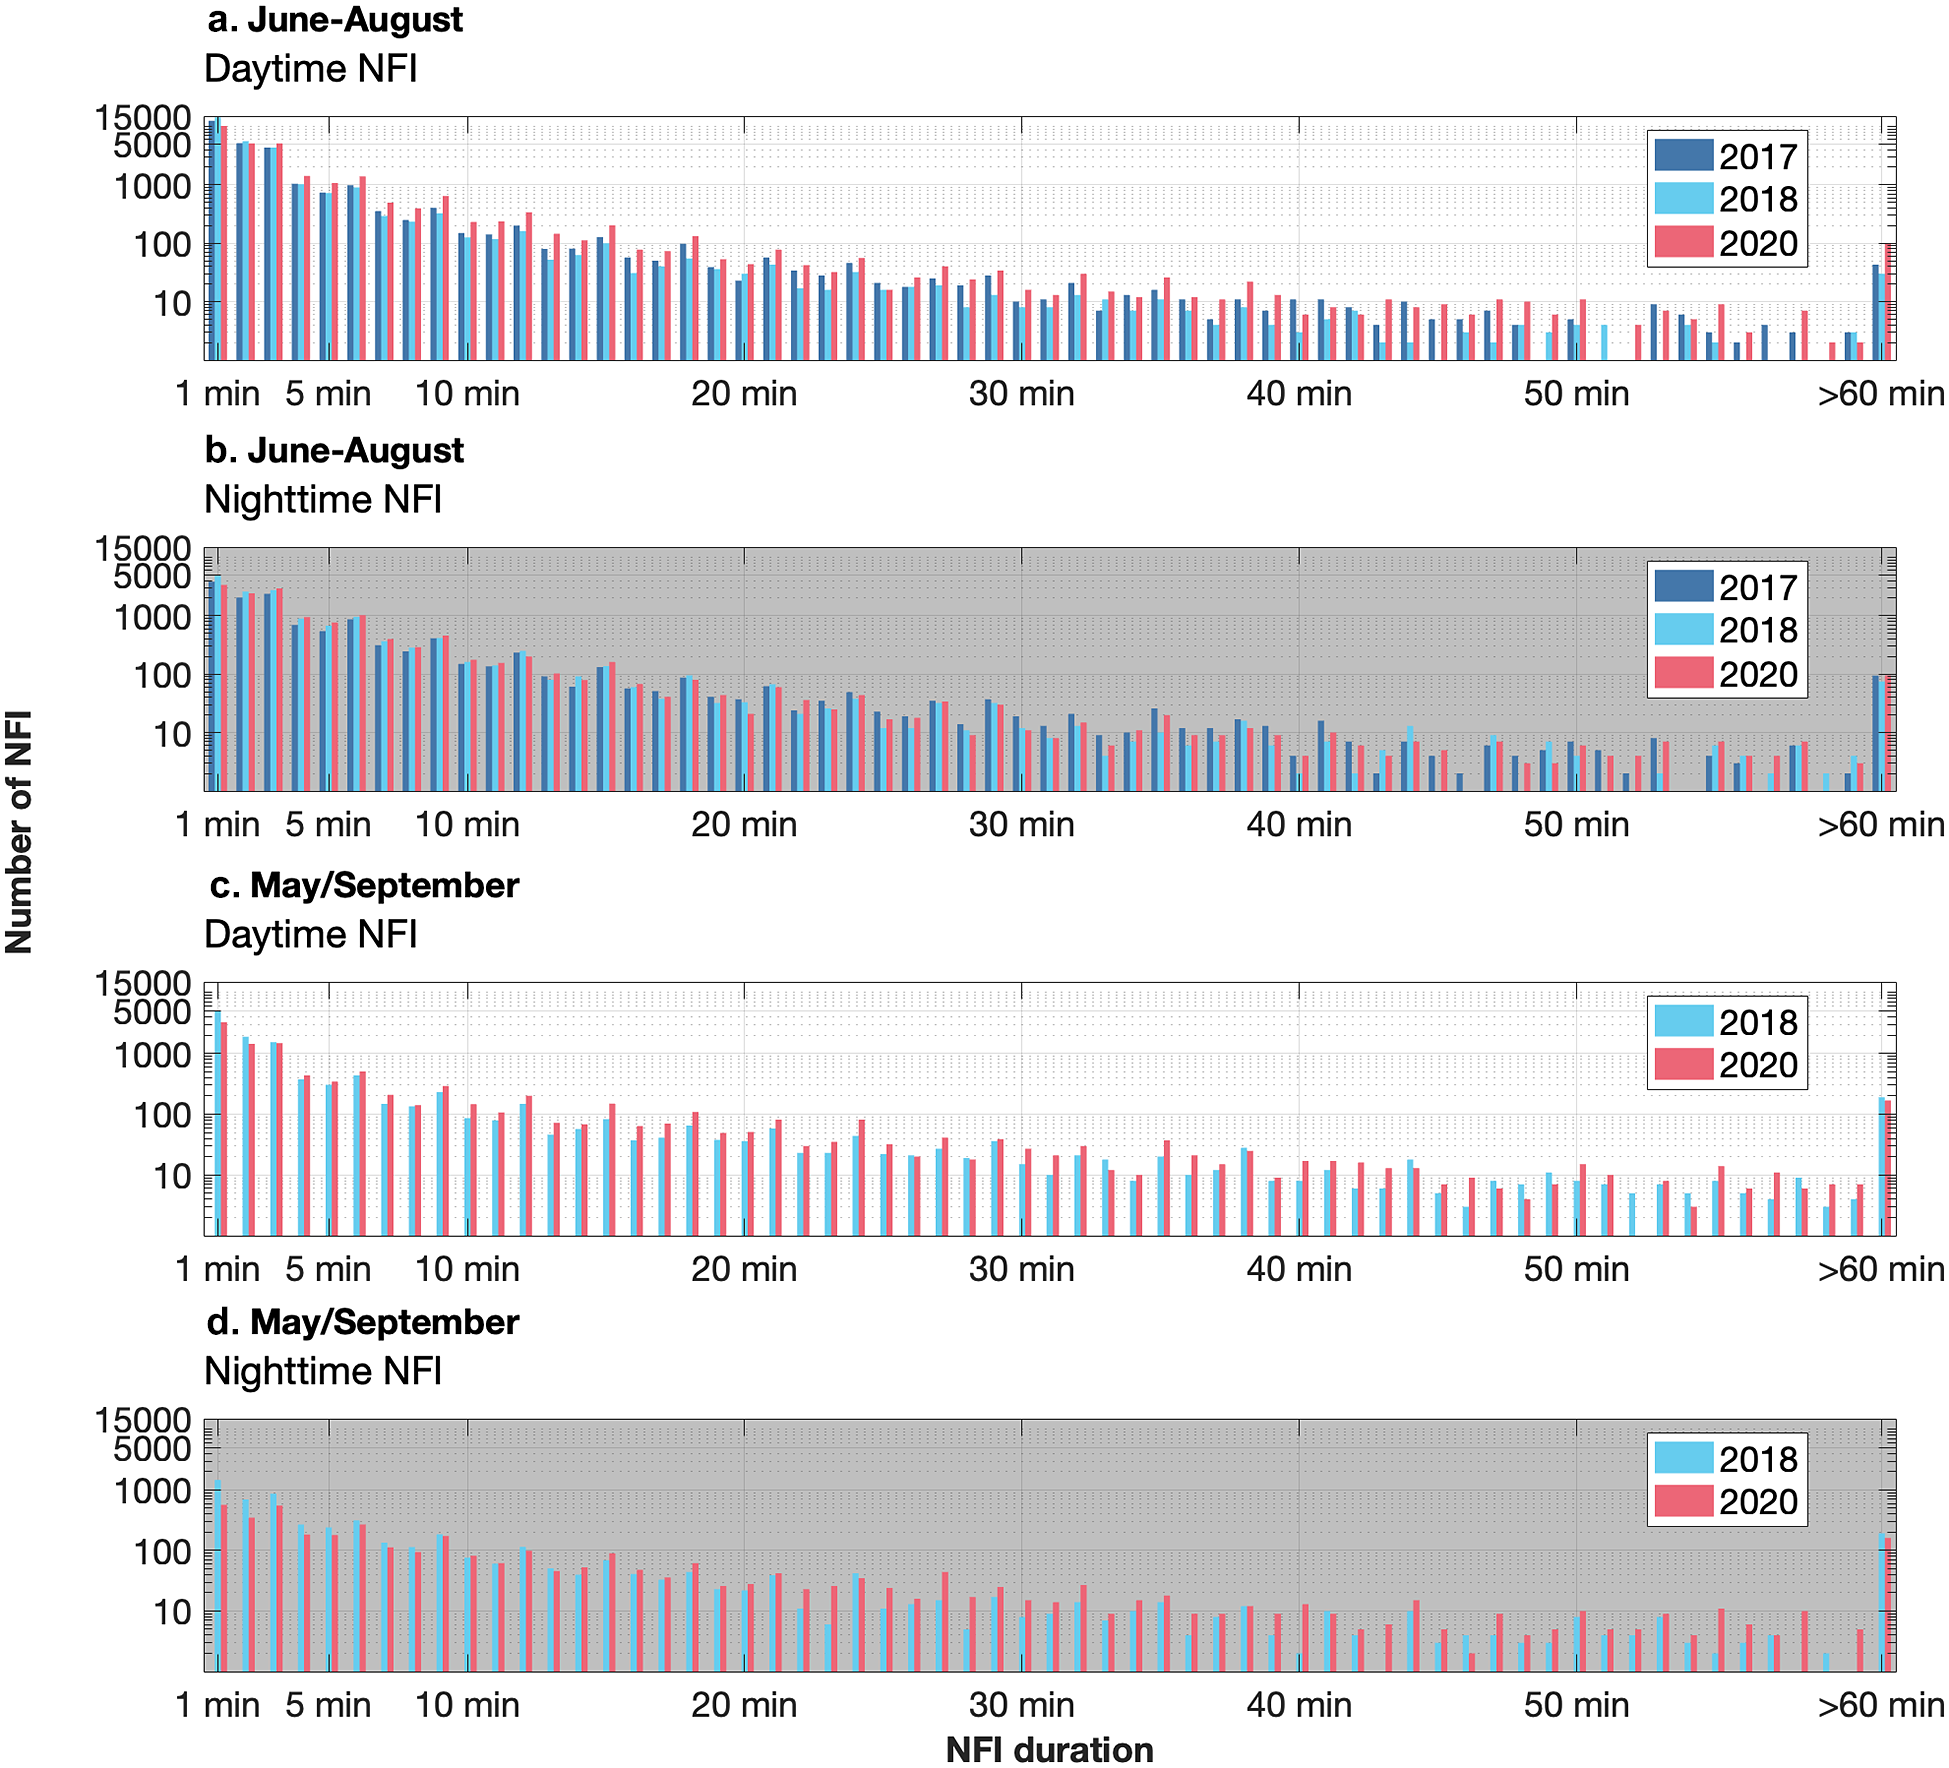
Figure 6. Occurrence of vessel noise-free interval (NFI) durations in the peak months of recreational vessel activity in June through August (a,b), and shoulder season months of May and September (c,d). In all months, durations of vessel NFIs were longer during nighttime hours (b,d). The shortest vessel NFIs were observed during the daytime in June–August (a).
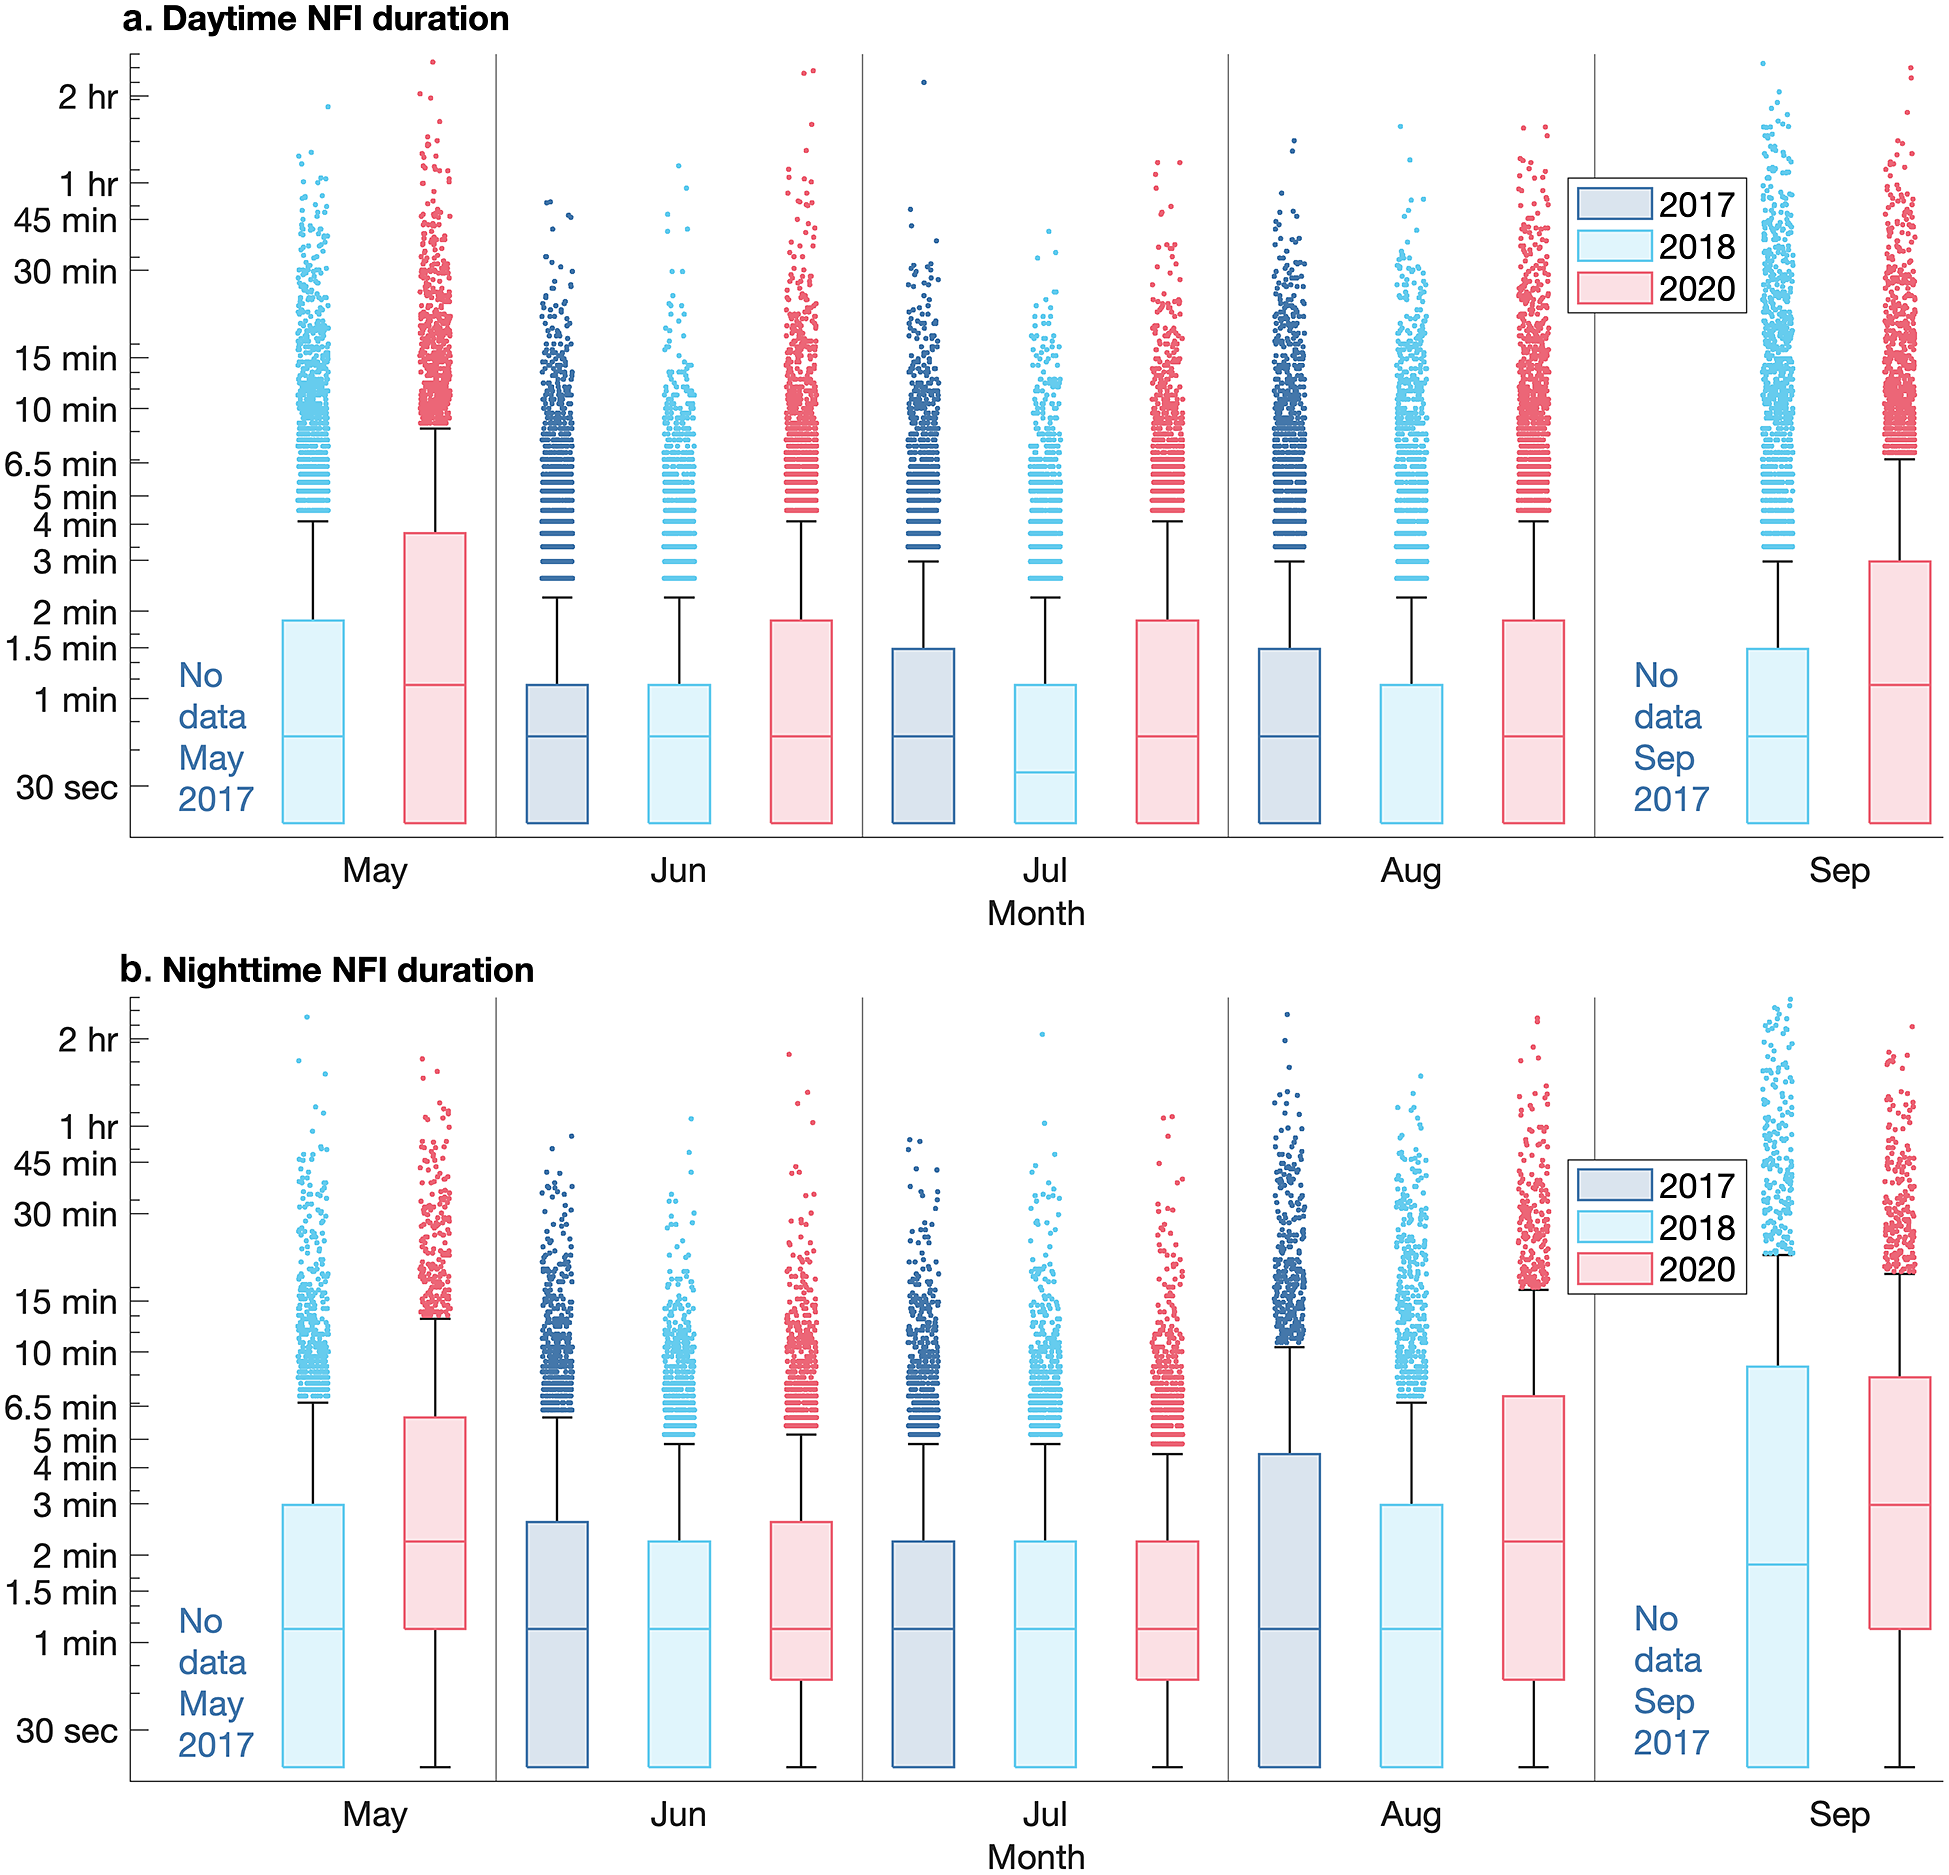
Figure 7. Boxplots of summary statistics for vessel noise-free interval (NFI) length (min) in each month and year of data, separated by daytime (a) and nighttime (b) hours. The median duration is indicated by the midline in each box, and the dots above are all outlier values. Median values that are not centered in the boxplot indicate skewness. Each 22.3 s sample evaluated by the GBNP-CNN is equal to ~0.37 min. Due to data gaps in May and September 2017, the May and September comparisons only include data from 2018 and 2020.
NFI was more likely to be longer at nighttime, particularly at the end of the tourist season in September (Figure 8). Nighttime NFI in September was 50% likely to be greater than a minute and a half long, and 10% likely to be greater than 30 min. During May, June, July, and August nighttime NFI were ~50% likely to be greater than a minute. June and July nighttime NFI were ~10% likely to be greater than 5 min, May nighttime NFI were 10% likely to be greater than 6.5 min, and August nighttime NFI were 10% likely to be greater than 11 min. During daytime hours in all months, NFI was 50–60% likely to be less than 1 min long. During September and May, daytime NFI were 10% likely to be greater than 6.5 min long. In August daytime NFI were 10% likely to be greater than 4 min long, and in June and July, daytime NFI were only 10% likely to be greater than 2.5 min long (Figure 8).
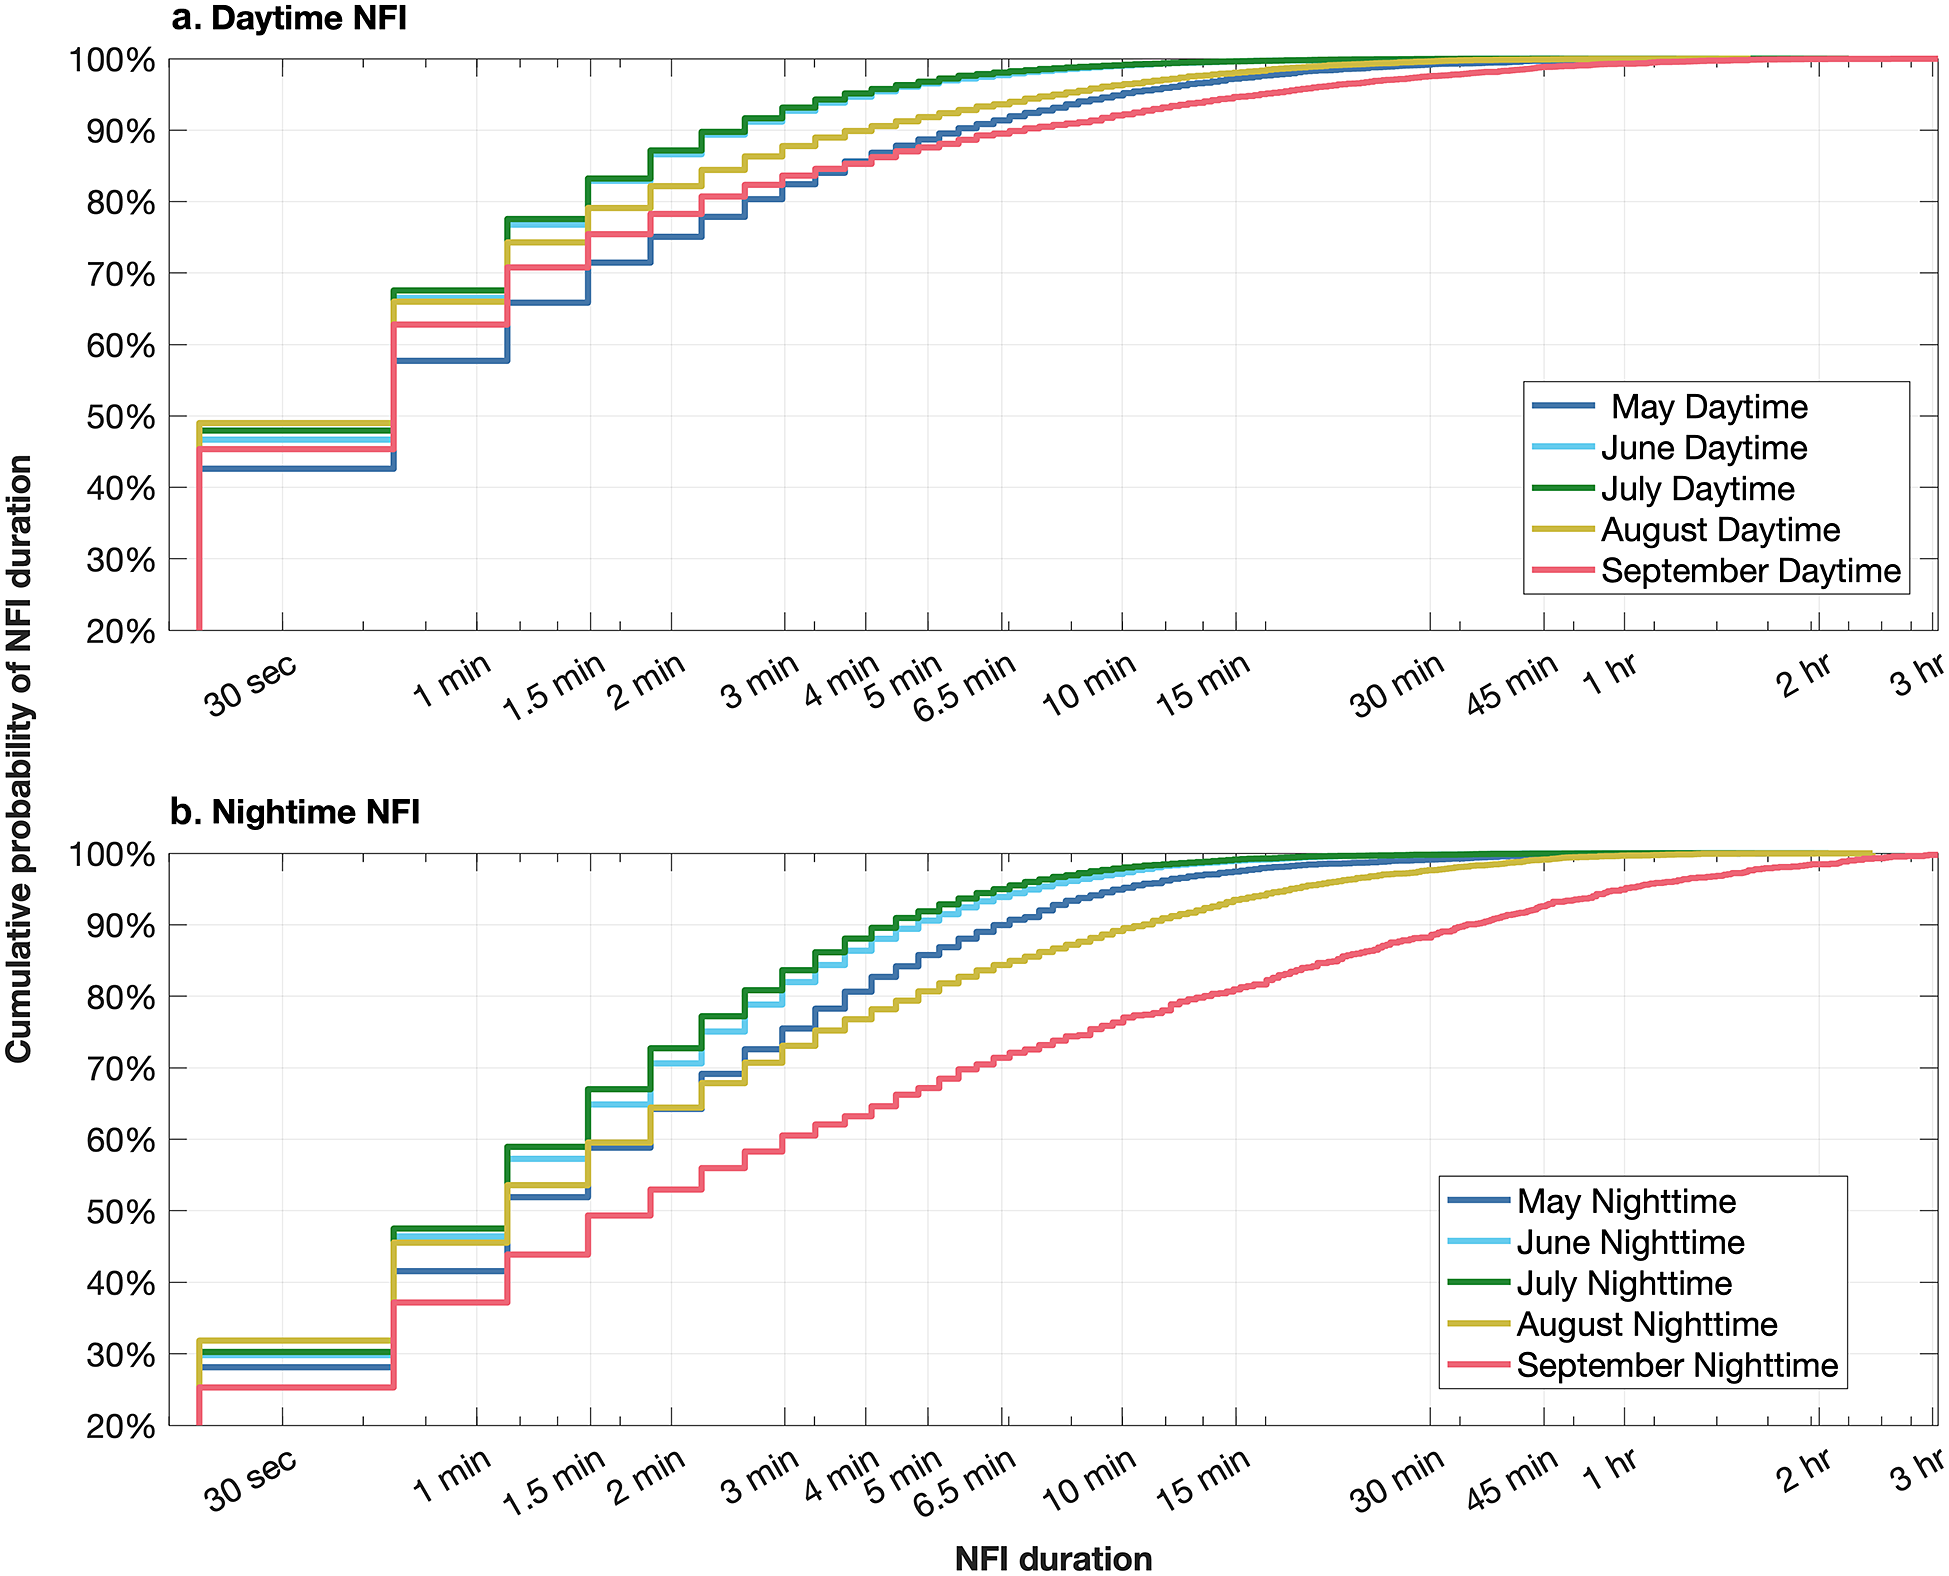
Figure 8. Cumulative probability distributions for the duration of vessel noise-free intervals for both (a) daytime and (b) nighttime hours from May to September. June, July, and August probabilities include data from 2017 and 2018. Due to data gaps, May and September probability distributions only include data from 2018.
4. Discussion
During the peak season for tourism in Glacier Bay National Park, vessel noise was more prominent in both total the total amount of time and the duration of continuous intervals of vessel noise. During the shoulder season months of May and September, intervals of vessel noise were comparatively shorter and the hourly proportion of samples containing vessel noise was lower.
Aside from wind noise, tourism-related vessel noise is a primary component of the GBNP underwater soundscape (McKenna et al., Reference McKenna, Gabriele and Kipple2017; Gabriele et al., Reference Gabriele, Ponirakis, Clark, Womble and Vanselow2018). Because tourism currently concentrates in summer, conditions during the shoulder season months of May and September are less noisy compared to peak months of June, July, and August. Similarly, diel sound levels parallel vessel activity patterns with higher occurrence of vessel noise during daytime hours (relative to nighttime) when most vessel activity occurs. This observation is consistent with previous soundscape observations of comparatively more vessel noise during daytime hours (06:00–20:00 AKDT), compared to nighttime hours (20:00–06:00 AKDT; Gabriele et al., Reference Gabriele, Ponirakis, Clark, Womble and Vanselow2018, Reference Gabriele, Ponirakis and Klinck2021). It is possible for other sound sources such as weather or animals to contribute to sound levels, but both abiotic and biotic natural sources are unlikely to follow the precise patterns of vessel-based human activities during the peak tourism season.
4.1. ML model misclassification errors
We suspect that many GBNP-CNN classification errors were due to confusion of vessel noise with harbor seal roars, although in 20% (255/1,272) of correctly classified clips with vessel noise presence, there was also a harbor seal roar in the recording. In instances where there was vessel noise in a clip, but misclassified as vessel noise-free, harbor seal roars were also found 15% (59/377) of the time. In contrast, 52% (243/462) of clips without vessel noise that were erroneously classified as containing vessel noise contained only harbor seal roars. Thus, we surmise that the GBNP-CNN confusion of vessel noise with harbor seal roars was a major source of false positives and a smaller number of false negatives. This biases the duration of NFI, but is unlikely to affect the diurnal or seasonal patterns of NFI.
The GBNP-CNN classification errors related to confusion between harbor seals and vessel noise may have been due to the similar frequency range of the sounds. Although harbor seal roars are more entropic than vessel noise, the sound-pressure level at the hydrophone and consistent repetition throughout the breeding season may have resulted in additional misclassifications of vessel noise. For the full season, performance for detecting vessel noise-free samples was precision (77% false positive rate), recall (73% false negative rate), and F1 score (75%). Isolating only the passive acoustic data collected during August and September, when harbor seals rarely vocalize, the precision (79%), recall (79%), and F1 score (79%) improved modestly. In May, June, and July, when harbor seals are most vocally active, GBNP-CNN fails to find as much vessel noise (73% F1 score) compared to the full season. In areas without a harbor seal population, this apparently significant misclassification issue would be less of a problem.
While harbor seals might be a substantial source of misclassification, other confounding factors may also be significant as the GBNP-CNN F1 score in the absence of harbor seal vocalizations was 79%. Other potential instances for error include when vessel noise is intermittent and in the same frequency range as a whale, which may occur when the vessel is far away from the hydrophone, and as a result the GBNP-CNN classifies the sound as a whale. Alternatively, misclassification may also occur in instances where there is significant whale and vessel noise coincident, and the GBNP-CNN determination is mixed. While revisions to the GBNP-CNN model are outside the scope of this initial investigation of data summarization methods, developing strategies to deal with these coincidences is an excellent subject for future work.
While misclassifications are not desirable, the resulting seasonal and diurnal patterns of vessel noise we found based on continuous acoustic sampling are comparable to previous observations of underwater sound levels in GBNP (Gabriele et al., Reference Gabriele, Ponirakis and Klinck2021). Previous results from the same hydrophone and location, based on over 10,000 hourly 30-s acoustic samples collected in June–August 2000–2008, reviewed by an experienced human analyst indicated that in 2000–2002, 51% of samples were free of vessel noise, which fell to 49% in 2007–2008 (McKenna et al., Reference McKenna, Gabriele and Kipple2017). To compare GBNP-CNN results of hourly samples from full 24-hr periods in June–August with the same years in the current study: 2017 indicated that 37% of samples were free of vessel noise, whereas in 2018, 41% of samples were vessel noise-free (GBNP, unpublished data). In 2020 during the initial COVID-19 lockdown, the proportion of vessel noise-free samples was 68%. In contrast, our GBNP-CNN model results suggest that for all hours of the day in June, July, and August 2017, 64% of hours were free of vessel noise (HP), and 59% in 2018, and ~75% in 2020.
Underwater NFI was shorter than we had anticipated based on results from terrestrial soundscape monitoring stations in GBNP (D. Betchkal, pers. comm.), which may reflect that sound travels faster and farther underwater than in the air. Alternatively, it may also reflect that our results represent minimum NFI estimates because vessel and vessel-noise-free classification errors at the resolution of 22.3 s are likely to break longer intervals into smaller pieces. Furthermore, since the errors tend to be scattered in time, they are more likely to break intervals as opposed to combining them, even though the false positive and false negative rates are similar.
4.2. Shorter vessel noise-free intervals may negatively impact animal communication
The duration of NFIs is highly relevant to humpback whale conservation. A commonly observed humpback whale vocalization in GBNP is a contact call known as the “whup” (Wild and Gabriele, Reference Wild and Gabriele2014; Gabriele et al., Reference Gabriele, Ponirakis, Clark, Womble and Vanselow2018). Each whup call is on average less than 1 s in duration, however a 3-year study in GBNP found that the majority of observed whup calls are grouped (61%) with half of the subsequent calls occurring within 1 min of the last whup (Wild and Gabriele, Reference Wild and Gabriele2014). Bouts of whup calling were observed to include as many as 34 calls over a duration of nearly 6.5 min. In this analysis, NFI only averaged (mean) over 6.5 min in the nighttime shoulder season hours in 2020 (Appendix 1). In our results, NFI was mostly likely to be greater than 6.5 min during nighttime hours in August and September (16% and 29% likely, respectively; Figure 8). In May–July during nighttime and all months during daytime hours, NFI was 10% or less likely to be greater than 6.5 min (Figure 8). During the peak season daytime hours, the average NFI was 1.4 min which may not even be long enough for two successive whup calls. Thus, even though GBNP-CNN likely underestimated NFI, our results suggest that vessel noise appears to be frequent enough to interfere with bouts of humpback whale “whup” contact calls, and that the best timing for humpback whale acoustic communication is during nighttime hours when NFI is more likely to be long enough for the full vocal exchange to occur.
Monitoring NFI in supplement to sound level monitoring can provide additional information about acoustic environment conditions during time periods of increased vessel traffic. Furthermore, using automated tools such as GBNP-CNN to identify NFI can potentially provide near real-time results as data are available. A significant caveat of automated methods is the potential for incorrect classification (false positive or false negative), but intermittent human-verification and model re-training can reduce errors. During peak season and other times of increased vessel activity, utilizing automated methods can provide information about soundscape anthropogenic disturbance to managers on short timelines that may enable timely management action, fostering better acoustic habitat preservation.
For example, NFI monitoring could be utilized in conjunction with other bioacoustic analysis methods (e.g., human listener and ML models) to evaluate whale vocalization behavior in the absence and presence of vessel noise over specific intervals (e.g., 1 min, 5 min, 1 hr). Quantifying the duration and patterns of NFI and humpback whale vocalizations may provide information about how humpback whales adapt their acoustic communication in a spectrum of vessel noise conditions. For example, it is possible that under certain ambient conditions, humpback whales may employ a behavioral strategy of waiting for quieter periods to communicate with conspecifics for presumably more effective communication with less expended effort. Coordinated monitoring of NFI and humpback whale communication may also reveal instances of communication masking or cessation of vocalizations due to vessel noise overlapping humpback whale vocalizations. Using a 4-element hydrophone array, this phenomenon has been documented in the Beardslee Island entrance location within GBNP (Fournet et al., Reference Fournet, Matthews, Gabriele, Haver, Mellinger and Klinck2018), and would be valuable to compare with conditions at the single hydrophone location in Bartlett Cove where there is comparably more vessel traffic. Integrating whale movement observations from either visual or tag-based methods may also reveal potential impacts of the patterns and durations of NFI on whale behavior.
5. Conclusion
Developing methods to quantify NFI in the marine soundscape of GBNP is a valuable tool to supplement other passive acoustic and marine mammal observation methods for evaluating management needs. The NFI is an established metric in terrestrial soundscape monitoring, and its extension to underwater data can provide important information and enable valuable comparisons for evaluating overall soundscape conditions in GBNP. The GBNP-CNN ML model applied here to quantify NFI is a starting point for future iterations that could be used to detect humpback whales, harbor seals, and other sensitive marine species almost as quickly as the passive acoustic data are available. Using this multiclass model allows the ML classification results to be interpreted and explained in terms of the supposed sound source, rather than simply “vessel” or “no-vessel.” The next steps are to improve our vessel noise model with additional training data, develop methods that allow the GBNP-CNN to identify reliably more than one sound source per clip, and potentially use decidecade bands to compress the model and increase speed.
Acknowledgments
The authors would like to acknowledge that numerous people at Naval Surface Warfare Center and Glacier Bay National Park and Preserve contributed to long-term data collection and previous studies of Glacier Bay’s underwater sound environment leading to the success of this project. Special thanks to Blair Kipple, Russ Dukek, and Larry Arndt at the Naval Surface Warfare Center Carderock Division and Mantech Incorporated for their efforts to sustain data collection and analysis tools necessary for this continued research. Many people at Glacier Bay National Park and Preserve and Naval Surface Warfare Center including the Southeast Alaska Acoustic Measurement Facility have contributed valuable work toward system maintenance and data management. The authors also thank Shane Watson, Pat Madden, Bob Supino, Joe Demko, Jeff Williams, and Kevin Koppenhaver at the Naval Surface Warfare Center Carderock Division for data processing and analysis support, and Davyd Betchkal at the National Park Service for guidance on NFI reporting. The authors also acknowledge two anonymous reviewers, Julien Brajard (the editor), and Cathleen Balantic at the National Park Service for their thoughtful review and suggestions to improve this manuscript.
Author contribution
Conceptualization: C.M.G., K.G.; Data visualization: S.M.H.; Formal analysis: S.M.H.; Methodology: C.M.G., K.G.; Resources: C.M.G.; Software: K.G.; Validation: C.M.G., K.G., S.M.H., Shane Watson at NSWC; Writing original draft: C.M.G., K.G., S.M.H. All authors approved the final submitted draft.
Competing interest
The authors declare no competing interests exist.
Data availability statement
Passive acoustic data are available upon request and will be made available online via the NOAA NCEI Passive Acoustic Archive: https://www.ncei.noaa.gov/maps/passive_acoustic_data/. Matlab code for the GBNP-CNN ML model training and application will be available upon request and online according to U.S. Government public release regulations.
Ethics statement
The research meets all ethical guidelines, including adherence to the legal requirements of the United States.
Funding statement
This research was supported by Glacier Bay National Park and Preserve and grants from the National Park Service Inventory and Monitoring Program’s Focused Condition Assessment Program, Natural Sounds and Night Skies Division, and Water Resources Division. K.G. was funded for this work by the Naval Innovative Science and Engineering (NISE) program, managed under the NSWC Carderock Chief Technology Office. This is PMEL contribution #5375.
Appendix A
Tables of the median, mean, and maximum vessel noise-free interval (NFI) length (min) for each year, month, and time of day. Each 22.3 s sample evaluated by the GBNP-CNN is equal to ~0.37 min. Due to data gaps (indicated by “X”), May and September measurements only include data from 2018 and 2020. Data were not available for May or September in 2017. Median values were consistently lower than mean values, indicating that the data distribution is positively skewed toward longer NFI.


 Open access