


Introduction
The advancement in protein structure determination and protein structure prediction from amino acid sequences has made the two initially independent paths more interconnected. On the one hand, experimental techniques, such as X-ray crystallography, NMR, and cryo-electron microscopy (cryo-EM), have driven the rapid growth of atomic structures deposited in the Protein Data Bank (PDB). The large number of high-quality 3D structures is an important asset in the investigation of functional mechanisms in biochemistry and structural biology. On the other hand, accurate atomic details have also fed a wealth of data to machine learning approaches in computational protein structure prediction. The quality of such predicted models has now sufficiently improved to have a real impact in imaging-based structure determination, such as in cryo-EM, where the resolution of the experimental maps is often too low to resolve individual atoms.
As of April 2022, 8,029 atomic structures have been solved from 9,752 cryo-EM maps with better than 4 Å resolution. Even in those high-resolution maps, there are often local regions of lesser quality that are challenging to interpret, but for the better-defined regions, the atomic structures are reliable down to the position of individual atoms. In addition, 2,195 models have been predicted from 3,344 cryo-EM maps with 4–6 Å resolution. It is still challenging to determine structures accurately in this ‘twilight zone’ of resolution due to the ambiguities of interpreting the shapes of amino acid side chains (Cheng, Reference Cheng2015; Casañal et al., Reference Casañal, Shakeel and Passmore2019; Malhotra et al., Reference Malhotra, Träger, Dal Peraro and Topf2019; He et al., Reference He, Lin, Chen, Cao and Huang2022; Zhang et al., Reference Zhang, Zhang, Freddolino and Zhang2022). Recent studies have shown that the 3D prediction of atomic structures of proteins for which only the amino acid sequence is known can assist in the interpretation of cryo-EM maps when the quality of maps is insufficient to resolve atoms and amino acid side chains (Jiang et al., Reference Jiang, Baker, Ludtke and Chiu2001; Topf et al., Reference Topf, Baker, Marti-Renom, Chiu and Sali2006; DiMaio et al., Reference DiMaio, Tyka, Baker, Chiu and Baker2009, Reference DiMaio, Song, Li, Brunner, Xu, Conticello, Egelman, Marlovits, Cheng and Baker2015; Baker et al., Reference Baker, Abeysinghe, Schuh, Coleman, Abrams, Marsh, Hryc, Ruths, Chiu and Ju2011; Lindert et al., Reference Lindert, Alexander, Wotzel, Karaka, Stewart and Meiler2012; Wang et al., Reference Wang, Kudryashev, Li, Egelman, Basler, Cheng, Baker and DiMaio2015; Chen et al., Reference Chen, Baldwin, Ludtke and Baker2016; Afonine et al., Reference Afonine, Poon, Read, Sobolev, Terwilliger, Urzhumtsev and Adams2018; Terashi and Kihara, Reference Terashi and Kihara2018; Zhang et al., Reference Zhang, Zhang, Pearce, Shen and Zhang2020). Finally, there are also 1,066 atomic models in the PDB that were derived from 2,573 maps of medium resolution (6–10 Å), where the backbone of the polypeptide chain is generally no longer visible in the map. These models are predominantly derived by fitting known template structures into the maps (Wriggers et al., Reference Wriggers, Milligan, Schulten and McCammon1998, Reference Wriggers, Agrawal, Drew, McCammon and Frank2000; Tama et al., Reference Tama, Wriggers and Brooks2002; Chacon et al., Reference Chacon, Tama and Wriggers2003; Wriggers, Reference Wriggers2010, Reference Wriggers2012; Kovacs et al., Reference Kovacs, Galkin and Wriggers2018). A template structure can be an existing protein structure of a closely related protein or a model that is modified from an existing structure. The initial model must be similar to the structure of the target protein for fitting to low-resolution maps to be reliable (Egelman, Reference Egelman2008). Due to the limitations of such fitting, 6–10 Å resolution cryo-EM maps are also increasingly deposited without associated PDB models (95 in 2002–2009, 223 in 2010–2014, 645 in 2015–2019, and 567 since 2020). These recent trends in medium-resolution prolificacy call for new computational tools that enable such cryo-EM maps to bear atomic resolution fruit at a later time.
The rise of deep learning methods capable of producing highly accurate structures has recently revolutionised the computational protein structure prediction field. In the first 12 Critical Assessment of Protein Structure Prediction (CASP) meetings, the prediction accuracy for difficult targets was generally poor, with an overall less than 50 Global Distance Test − Total Score (GDT_TS) (Martz, Reference Martzn.d.), above which a model generally represents a correct fold (Kryshtafovych et al., Reference Kryshtafovych, Schwede, Topf, Fidelis and Moult2021). This was due to the challenge of handling proteins with previously unknown folds and to insufficient knowledge extracted from existing sequences and structures. However, the debut of deep learning led to a marked improvement in prediction accuracy. By CASP14 in 2020, AlphaFold2 had become the best-performing method across all levels of target difficulty (Kryshtafovych et al., Reference Kryshtafovych, Schwede, Topf, Fidelis and Moult2021). Ranked by increasing difficulty, the challenge levels are Template-Based Modelling-easy (TBM-easy), Template-Based Modelling-hard (TBM-hard), Free Modelling/Template-Based Modelling (FM/TBM), and Free Modelling (FM). For 87 of the 92 domain targets, the best of five models submitted by the AlphaFold2 group of DeepMind achieved near experimental accuracy, with GDT_TS above 70 (Jumper et al., Reference Jumper, Evans, Pritzel, Green, Figurnov, Ronneberger, Tunyasuvunakool, Bates, Žídek and Potapenko2021a). The marked improvement of accuracy for the most difficult targets in Free Modelling represents a significant improvement in the state of the art in protein structure prediction (Jumper et al., Reference Jumper, Evans, Pritzel, Green, Figurnov, Ronneberger, Tunyasuvunakool, Bates, Žídek and Potapenko2021a; Kryshtafovych et al., Reference Kryshtafovych, Schwede, Topf, Fidelis and Moult2021).
The success in predicting Free Modelling targets at CASP was largely due to the improved prediction of residue contact distances, beyond a yes or no answer (Hou et al., Reference Hou, Wu, Cao and Cheng2019; Xu, Reference Xu2019). Coevolution can be related to statistical dependencies that encode the contact between two residues. For example, if one changes from a positively charged residue, the other is likely to change to a negatively charged residue. Deep learning methods, such as MULTICOM, TripletRes, DeepPotential, tFold, and RaptorX, have been shown effective in uncovering residue coevolutionary patterns among homologous sequences (Guo et al., Reference Guo, Wu, Liu, Hou and Cheng2021; Li et al., Reference Li, Zhang, Bell, Zheng, Zhou, Yu and Zhang2021a, Reference Li, Zhang, Zheng, Zhou, Bell, Yu and Zhang2021b; Shen et al., Reference Shen, Wu, Lan, Zheng, Pei, Wang, Liu and Huang2021; Xu et al., Reference Xu, Mcpartlon and Li2021). Due to such improvements, other structure prediction methods, such as RoseTTAFold, QUARK, and MULTICOM, have also recently shown improved model accuracy (Yang et al., Reference Yang, Anishchenko, Park, Peng, Ovchinnikov and Baker2020; Baek et al., Reference Baek, DiMaio, Anishchenko, Dauparas, Ovchinnikov, Lee, Wang, Cong, Kinch and Schaeffer2021; Zheng et al., Reference Zheng, Li, Zhang, Pearce, Mortuza and Zhang2019, Reference Zheng, Li, Zhang, Zhou, Pearce, Bell, Huang and Zhang2021; Hou et al., Reference Hou, Wu, Guo, Quadir and Cheng2020; Wu et al., Reference Wu, Liu, Guo, Hou and Cheng2021).
The availability of highly accurate predicted models potentially transforms many studies in structural biology, but the impact of AlphaFold2 models remains to be studied in more detail in various specific applications. In the related Molecular Replacement problem in X-ray crystallography (which relies upon the existence of a model that is similar to the unknown structure from which the diffraction data is derived), a recent study shows that 30 of 32 models produced by AlphaFold2 in CASP14 can be successfully used as search models (Pereira et al., Reference Pereira, Simpkin, Hartmann, Rigden, Keegan and Lupas2021). In cryo-EM, a recent study showed that 22 of 25 AlphaFold2 models can be used as initial models to produce models with over 90% alpha-carbon accuracy when they are refined using high-resolution cryo-EM maps up to about 4 Å resolution (Terwilliger et al., Reference Terwilliger, Poon, Afonine, Schlicksup, Croll, Millan-Nebot, Richardson, Read and Adams2022). However, as of yet, little is known about the benefit of AlphaFold2 for interpreting cryo-EM maps of lower resolution, where certain chains and regions do not have a known available template structure that could be fitted.
One of the difficulties in the evaluation of computational methods that apply to lower-quality maps is the lack of sufficient benchmark data. Although many atomic models have been derived from cryo-EM maps between 4 and 10 Å resolution, it is challenging to validate those models. For example, a misalignment of corresponding atomic structures has been reported for helix regions (Wriggers and He, Reference Wriggers and He2015; Sazzed et al., Reference Sazzed, Scheible, Alshammari, Wriggers and He2020) of lower-resolution cryo-EM maps. Due to challenges in obtaining reliable (experimentally derived) map-model pairs at lower resolutions, the simulation of cryo-EM density maps has become important.
Existing methods for simulating density maps (either in direct space or Fourier space) are based on the convolution of atom points with a resolution-lowering point-spread function. In the pdb2mrc of EMAN, the molmap function in Chimera, and the pdb2vol function of Situs, a 3D density map is produced using a Gaussian point-spread function whose real-space dimension corresponds to a desired resolution value, depending on the specific resolution convention of the packages (Ludtke et al., Reference Ludtke, Baldwin and Chiu1999; Pettersen et al., Reference Pettersen, Goddard, Huang, Couch, Greenblatt, Meng and Ferrin2004; Wriggers, Reference Wriggers2012). In this study, we propose a new way to produce a hybrid density map based on a Gaussian convolution of an experimental cryo-EM map (instead of an atomic structure). The variable resolution value adds a new dimension to the method validation. As a bonus, the approach also incorporates any quality variation within the parent high-resolution cryo-EM map into the hybrid map, resulting in a more realistic low-resolution density model.
Using hybrid maps, we can monitor any change in the effect of the refinement of AlphaFold2 models when Phenix software is applied at specific resolution values. Phenix is a Python-based refinement suite that was historically developed for X-ray crystallography and is therefore most suitable for high-resolution cryo-EM density maps (better than 4.5Å, according to Terwilliger et al. (Reference Terwilliger, Poon, Afonine, Schlicksup, Croll, Millan-Nebot, Richardson, Read and Adams2022)). The Phenix refinement protocols we used here were tightly integrated with AlphaFold2 and rely on specific outcomes of the AlphaFold2 prediction process (see Methods). An earlier study by Terwilliger et al. (Reference Terwilliger, Poon, Afonine, Schlicksup, Croll, Millan-Nebot, Richardson, Read and Adams2022) already demonstrated that AlphaFold2 models can be refined against high-resolution cryo-EM density maps, but the utility of the approach was not conclusive for cryo-EM maps with lower than 4 Å resolution, since only three such cases were tested and they achieved mixed success. In the present work, we tested a revised set of experimental high-resolution maps, and we also explored the impact of the refinement of AlphaFold2 models using hybrid maps of progressively sampled lower resolutions of 5, 6, 8, 10, and 12 Å. The refinement against such lower resolution maps is not the original scope of Phenix, but it is important to us and to many other groups that focus on modelling cryo-EM maps across a wider resolution range. Our results demonstrate the potential for AlphaFold2 models to be applied in lower than 4 Å resolution maps through refinement.
Methods
Both experimental cryo-EM maps between 2 and 4.5 Å resolution (see section ‘The data’) and hybrid maps (see section ‘Hybrid experimental-simulated density maps’) between 5 and 12 Å were used in the study. AlphaFold2 is accessible from both its standalone copy, which can be downloaded and installed locally, as well as web services established by both DeepMind and third-party groups (Jumper et al., Reference Jumper, Evans, Pritzel, Green, Figurnov, Ronneberger, Tunyasuvunakool, Bates, Žídek and Potapenko2021b; Mirdita et al., Reference Mirdita, Schütze, Moriwaki, Heo, Ovchinnikov and Steinegger2021). The refinement function of Phenix for AlphaFold2 models is also accessible both from a locally installed Phenix distribution and from its cloud service through Google Colab. In this study, most of the refinements of AlphaFold2 models were conducted using the free-membership Colab server of Phenix because of their tight integration, but a few cases were conducted using the local copy of Phenix for a fine-tuning of parameters (see details in section ‘Structure prediction using AlphaFold2 and refinement using Phenix’).
The data
Since the goal of the work was to study the effect of an existing refinement procedure on density maps of different resolutions, a data set of 13 cases was created. Of these, 12 were used in the study of Terwilliger et al. (Reference Terwilliger, Poon, Afonine, Schlicksup, Croll, Millan-Nebot, Richardson, Read and Adams2022), and one was added. The newly added case is a Free Modelling case in CASP14 (T1047S1D1, CASP ID) and it has a cryo-EM map (EMDB 12183, PDB 7BGL chain A) associated with it. The atomic structure of this case was downloaded from the PDB in March 2022. The other 12 structures listed in Table 1 were provided from the depository of Terwilliger et al. (Reference Terwilliger, Poon, Afonine, Schlicksup, Croll, Millan-Nebot, Richardson, Read and Adams2022), representing the structures downloaded in August 2021 with recent unique size structures between 100 and 1,000 amino acids and a cryo-EM map of 4.5 Å or better. Each case consisted of a sequence of amino acids, its corresponding density map, and an atomic structure (Table 1). Cryo-EM maps were downloaded from Electron Microscopy Data Bank (EMDB), as indicated by the ID number in Table 1.
Table 1. Accuracy of models before and after refinement using high-resolution cryo-EM maps and hybrid density maps of 5, 6, and 8 Å resolutions
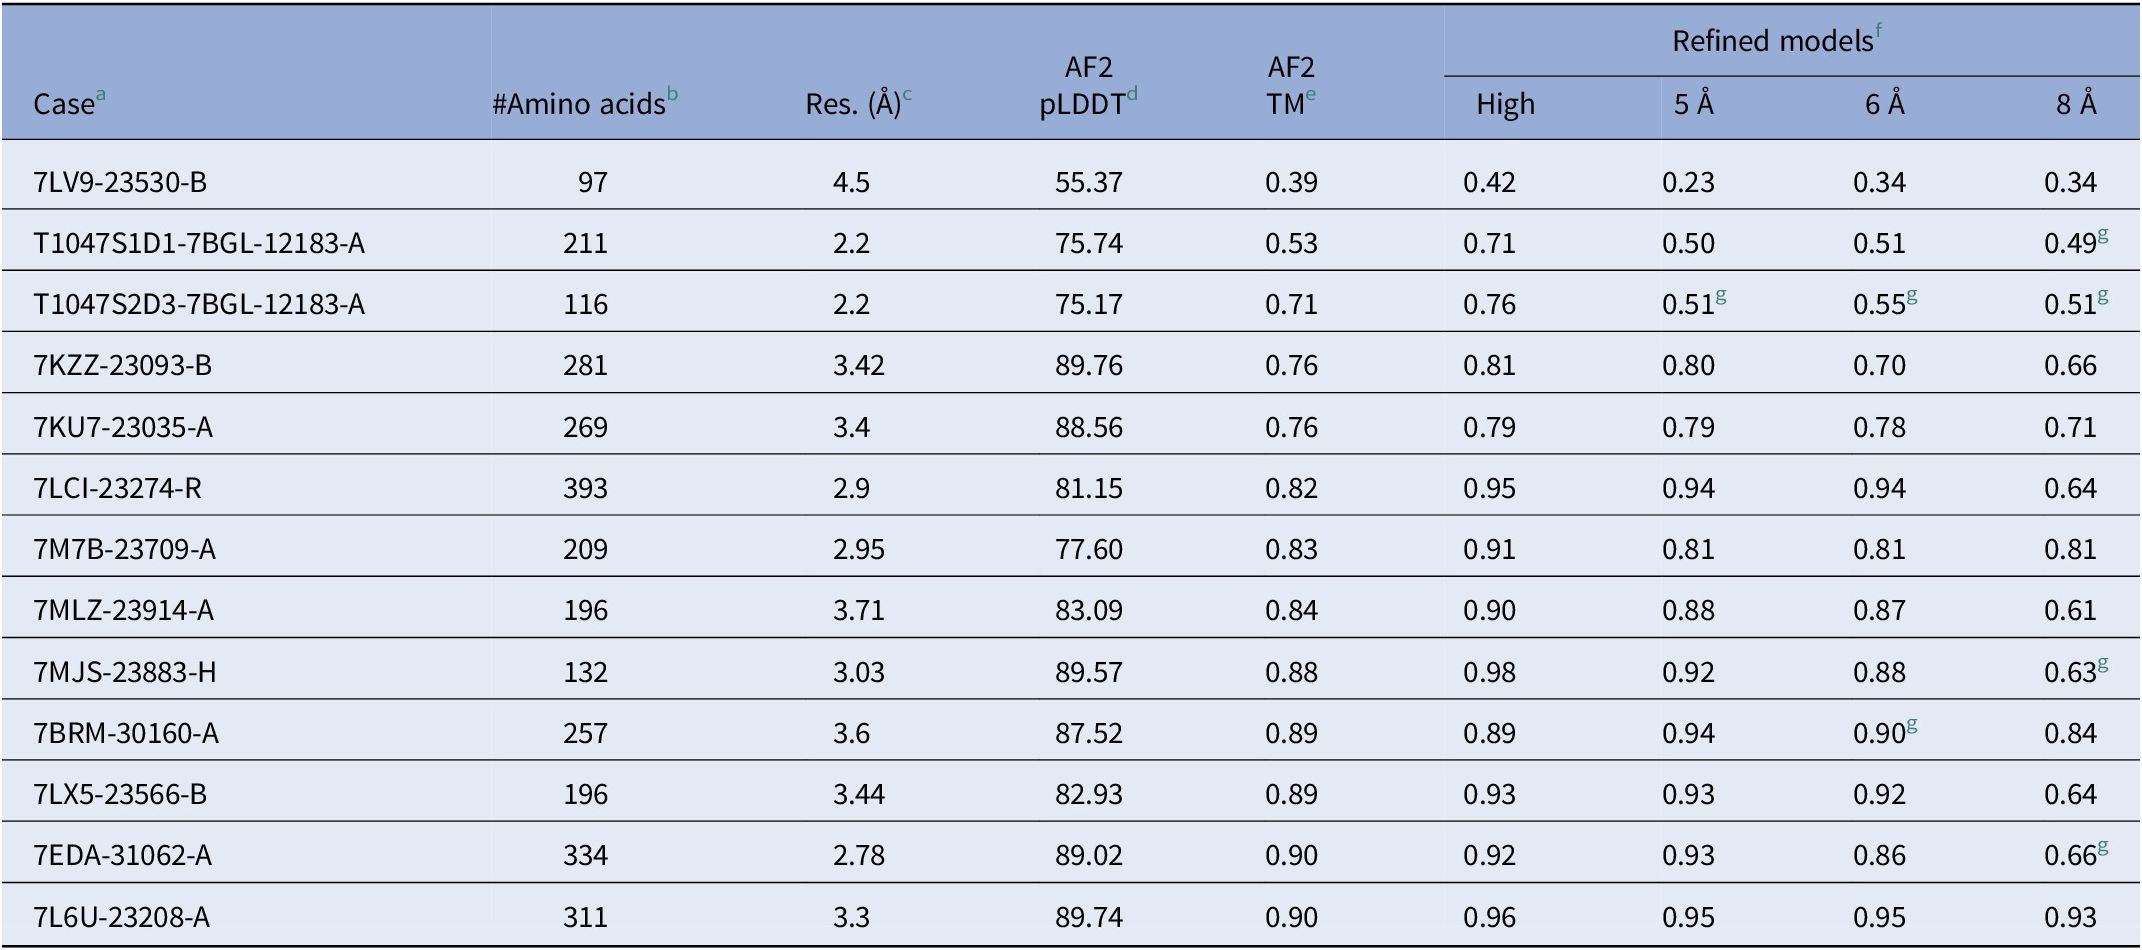
a Protein IDs (PDB ID_EMDB ID_Chain ID). For the two chains involved in CASP challenges, CASP target IDs are indicated.
b The number of amino acids in the protein.
c The resolution of cryo-EM maps.
d The average pLDDT scores of AlphaFold2 models.
e The accuracy is indicated as TM scores for models obtained from AlphaFold2.
f TM scores for models refined using Phenix (Terwilliger et al., Reference Terwilliger, Poon, Afonine, Schlicksup, Croll, Millan-Nebot, Richardson, Read and Adams2022), the cryo-EM maps (High) and the hybrid density maps at 5, 6, and 8 Å, respectively.
g The Phenix resolution parameter was tuned 2–3 Å lower than the nominal resolution of the density map to ensure completion of the refinement protocol (see text).
Hybrid experimental-simulated density maps
In this work, there was a need to adjust the resolution of cryo-EM maps used in the validation of the Phenix refinement of the AlphaFold2 models. The adjustment had to be done on specific maps, since our tests below show that the performance of the refinement varies greatly between systems. Traditionally, there have been methods, in EM modelling, that lower the resolution of atomic structures to create ‘simulated’ cryo-EM maps, such as the pdb2vol tool of Situs (Wriggers, Reference Wriggers2012). However, such simulated maps would not mimic the unique features of experimental cryo-EM maps, such as structural deviations, uneven local resolution, noise, structural flexibility and disorder, or the specific image processing effects of the 3D reconstruction process. Therefore, we designed a novel hybrid experimental-simulated density map, using a high-resolution experimental map as a basis for the resolution lowering instead of an atomic structure. To re-use the existing resolution lowering code (pdb2vol) in Situs, the cryo-EM density format was first converted with the vol2pdb tool, with each density voxel represented by a PDB ATOM record that stores the voxel density in the PDB occupancy field. Each density voxel was then convoluted with a Gaussian filter using a modified version of pdb2vol, with a filter size determined by the desired resolution of the hybrid map. The final resolution of the hybrid map depends on both the pre-existing (fixed) resolution $ {R}_e $
of the experimental map, and the user-controlled resolution parameter
$ {R}_e $
of the experimental map, and the user-controlled resolution parameter $ {R}_s $
of the pdb2vol convolution. The relationship is straightforward because the resolution point spread of the experimental map can itself be approximated by a Gaussian of resolution
$ {R}_s $
of the pdb2vol convolution. The relationship is straightforward because the resolution point spread of the experimental map can itself be approximated by a Gaussian of resolution $ {R}_e $
. In this case, the convolution of two Gaussians is simply a Gaussian with a larger resolution value
$ {R}_e $
. In this case, the convolution of two Gaussians is simply a Gaussian with a larger resolution value $ {R}_h\hskip0.35em =\hskip0.35em \sqrt{R_e^2+{R}_s^2\;} $
(Bromiley, Reference Bromiley2003). For a desired hybrid target resolution
$ {R}_h\hskip0.35em =\hskip0.35em \sqrt{R_e^2+{R}_s^2\;} $
(Bromiley, Reference Bromiley2003). For a desired hybrid target resolution $ {R}_h $
, and a cryo-EM map with pre-existing resolution
$ {R}_h $
, and a cryo-EM map with pre-existing resolution $ {R}_e $
, the required resolution parameter
$ {R}_e $
, the required resolution parameter $ {R}_s $
of the Gaussian filter can be computed this way. Hybrid density maps of
$ {R}_s $
of the Gaussian filter can be computed this way. Hybrid density maps of $ {R}_h $
= 5, 6, 8, 10, and 12 Å resolution were created for each case in this fashion.
$ {R}_h $
= 5, 6, 8, 10, and 12 Å resolution were created for each case in this fashion.
The detailed relationship between resolution values and dimensions of the Gaussian for various methods, including Situs, are described in section ‘Discussion and conclusion’ of Wriggers (Reference Wriggers2012). There is a significant difference between resolution conventions between software tools, since no uniform standards exist in the experimental and theoretical communities (Wriggers, Reference Wriggers2012). The Situs resolution convention (double the 3D standard deviation of the Gaussian) is different from EMAN2 and UCSF Chimera and was designed to show features at comparable levels of detail with published experimental maps, so we expect that the $ {R}_e $
and
$ {R}_e $
and $ {R}_s $
values in the above formula are compatible. However, users should be aware that this assumption should ideally be tested with a detailed resolution analysis, especially if different packages are used for the calculation of
$ {R}_s $
values in the above formula are compatible. However, users should be aware that this assumption should ideally be tested with a detailed resolution analysis, especially if different packages are used for the calculation of $ {R}_s $
.
$ {R}_s $
.
Structure prediction using AlphaFold2 and refinement using Phenix
The overall idea in refinement is to first identify the most consistent model among a set of suggested models from AlphaFold2. The selected model was then processed to trim unreliable residues using the per-residue confidence scores produced from AlphaFold2. The resulting more reliable regions of the model are broken up into domains and docked in the density map, whilst maintaining the connectivity relationship among domains. The model is then morphed and rebuilt using a density map (Terwilliger, Reference Terwilligern.d.). Briefly, this involves the fitting of the segments and the modelling of connecting loops using various techniques such as refinement, tracing, loop building, and chain growing. Detailed Phenix instructions for refining AlphaFold2 models are available online (Thomas, Reference Thomasn.d.).
Although AlphaFold2 software can be downloaded and installed on local machines, a simple way to obtain a predicted model is to use its service set up on the Google Cloud Platform. Recently, a convenient web interface was established on Google Cloud that initiates a task to run AlphaFold2 and then refines the model using the functions of Phenix software and a density map (Jumper et al., Reference Jumper, Evans, Pritzel, Green, Figurnov, Ronneberger, Tunyasuvunakool, Bates, Žídek and Potapenko2021b; Mirdita et al., Reference Mirdita, Schütze, Moriwaki, Heo, Ovchinnikov and Steinegger2021; Terwilliger et al., Reference Terwilliger, Poon, Afonine, Schlicksup, Croll, Millan-Nebot, Richardson, Read and Adams2022). We utilised such cloud services for 11 of the 13 cases to collect models generated from AlphaFold2 and to conduct subsequent refinement using Phenix. Specifically, models were obtained from a Google Colab Notebook ‘AlphaFold with a density map’, a Python code environment for Google Cloud services (Google Colab Notebook, n.d.). Default parameters were used, except for the number of iterations of refinement. Only one iteration of refinement was performed, rather than four iterations performed in the study of Terwilliger et al. (Reference Terwilliger, Poon, Afonine, Schlicksup, Croll, Millan-Nebot, Richardson, Read and Adams2022) because our tests showed that the conclusions of this paper did not depend on the number of iterations. For two cases (7LV9–23530-B and T1047S1D1–7BGL-12183-A), the downloaded Phenix software, instead of the Colab server, was used. Regarding the lower-confidence prediction 7LV9–23530-B, the maximum_rmsd parameter was fine-tuned in the local copy to 2.5 Å, instead of the default of 1.5 Å provided by the Colab server, for enhanced sampling. In the case of T1047S1D1–7BGL-12183-A, a local run was necessary because the trial on the Colab server exceeded the time limit of the free account. The same version of Phenix, dev-4536, was used in either the Colab server or the local copy.
To prepare the density map for refinement, we followed the Phenix documentation and applied the tools phenix.local_aniso_sharpen and phenix.map_box. The map resulting from these steps was a sharpened, rectangular cropped region containing the chain of interest. The nominal density map resolution was used as an upper bound for the Phenix ‘high-resolution limit’ of the main search. The documentation recommends trying the nominal resolution, but to lower the parameter as needed for a ‘quicker search’ or to compensate for model quality. We found that the Phenix refinement against the experimental cryo-EM maps was completed without any lowering of this parameter. However, for some of the lower resolution hybrid density maps (Table 1), the refinement failed at the docking stage. Therefore, as recommended by the instructions, a 2–3 Å larger resolution parameter than the nominal map resolution was used in these cases.
Results
This study aims to evaluate the accuracy of models obtained using the AlphaFold2 method and those refined using both cryo-EM maps of high resolutions and hybrid maps of lower resolutions. Among the models produced from AlphaFold2, the model selected by Phenix software was used in the evaluation of accuracy and subsequent refinement. The selected model represents the one with the best confidence based on the average predicted local distance difference test (pLDDT) among the list of suggested models from AlphaFold2 (Terwilliger et al., Reference Terwilliger, Poon, Afonine, Schlicksup, Croll, Millan-Nebot, Richardson, Read and Adams2022). The pLDDT (Jumper et al., Reference Jumper, Evans, Pritzel, Green, Figurnov, Ronneberger, Tunyasuvunakool, Bates, Žídek and Potapenko2021b) is a per-residue confidence metric on a scale from 0 to 100, and it estimates how well a prediction would agree with the true structure based on the local distance difference test Cα (Mariani et al., Reference Mariani, Biasini, Barbato and Schwede2013). The TM-align method calculates actual structural similarity using heuristic dynamic programming iterations, and it allows the comparison of two models that are not similar in certain regions (Zhang and Skolnick, Reference Zhang and Skolnick2005). Each model was aligned with the true structure using TM-align, and the TM-score was used for an estimation of the accuracy of the model. (Note that the amino acid sequence submitted to the AlphaFold2 server is longer if the corresponding atomic structure misses a segment of the sequence in structure determination; we used the length of the true structure for TM score normalisation). In the following, we describe our validation studies on experimental high-resolution cryo-EM maps (section ‘AlphaFold2 models and improved accuracy using high-resolution cryo-EM maps’) and on lower-resolution hybrid maps (section ‘Refinement of AlphaFold2 models using hybrid maps’). This is followed by a secondary structure analysis (section ‘Secondary structure analysis of refinement performance’) to characterise the observed performance.
AlphaFold2 models and improved accuracy using high-resolution cryo-EM maps
For the 13 cases tested, the accuracy of models obtained from AlphaFold2 is quite good, since 11 of them show higher than 0.7 TM-score, and eight models have higher than 0.8 TM-score (Table 1). The TM scores correlated with average pLDDT values (Table 1), suggesting that AlphaFold2 pLDDT scores predict the refinement success to some extent. (However, small local errors that are undetected by the pLDDT averaging can have global structural consequences, so the TM score was used as a standard for the validation against the true structures.)
An example with a 0.82 TM-score shows that the overall fold and secondary structure elements, such as helices and β-strands, are correct (Fig. 1a). Minor inaccuracies remain in the model in terms of the length of the secondary structures, the loop, and the relative positioning of the two secondary structures. For a case with a TM score of 0.53, one of the two cases with a score less than 0.7, the fold of the model is still correct, and the secondary structures are well-predicted (Fig. 2a). This chain was a target in the difficult Free Modelling category of CASP14. Although our current AlphaFold2 model was obtained from the Colab server of AlphaFold2, it is similar to the model submitted in CASP14 (data not shown). One of the 13 test cases showed poor model accuracy, with a TM-score of 0.39 (Table 1). The main deficiency of the model is that two shorter helices were predicted as one long helix, which affected the overall fold of the chain (Fig. 3a).
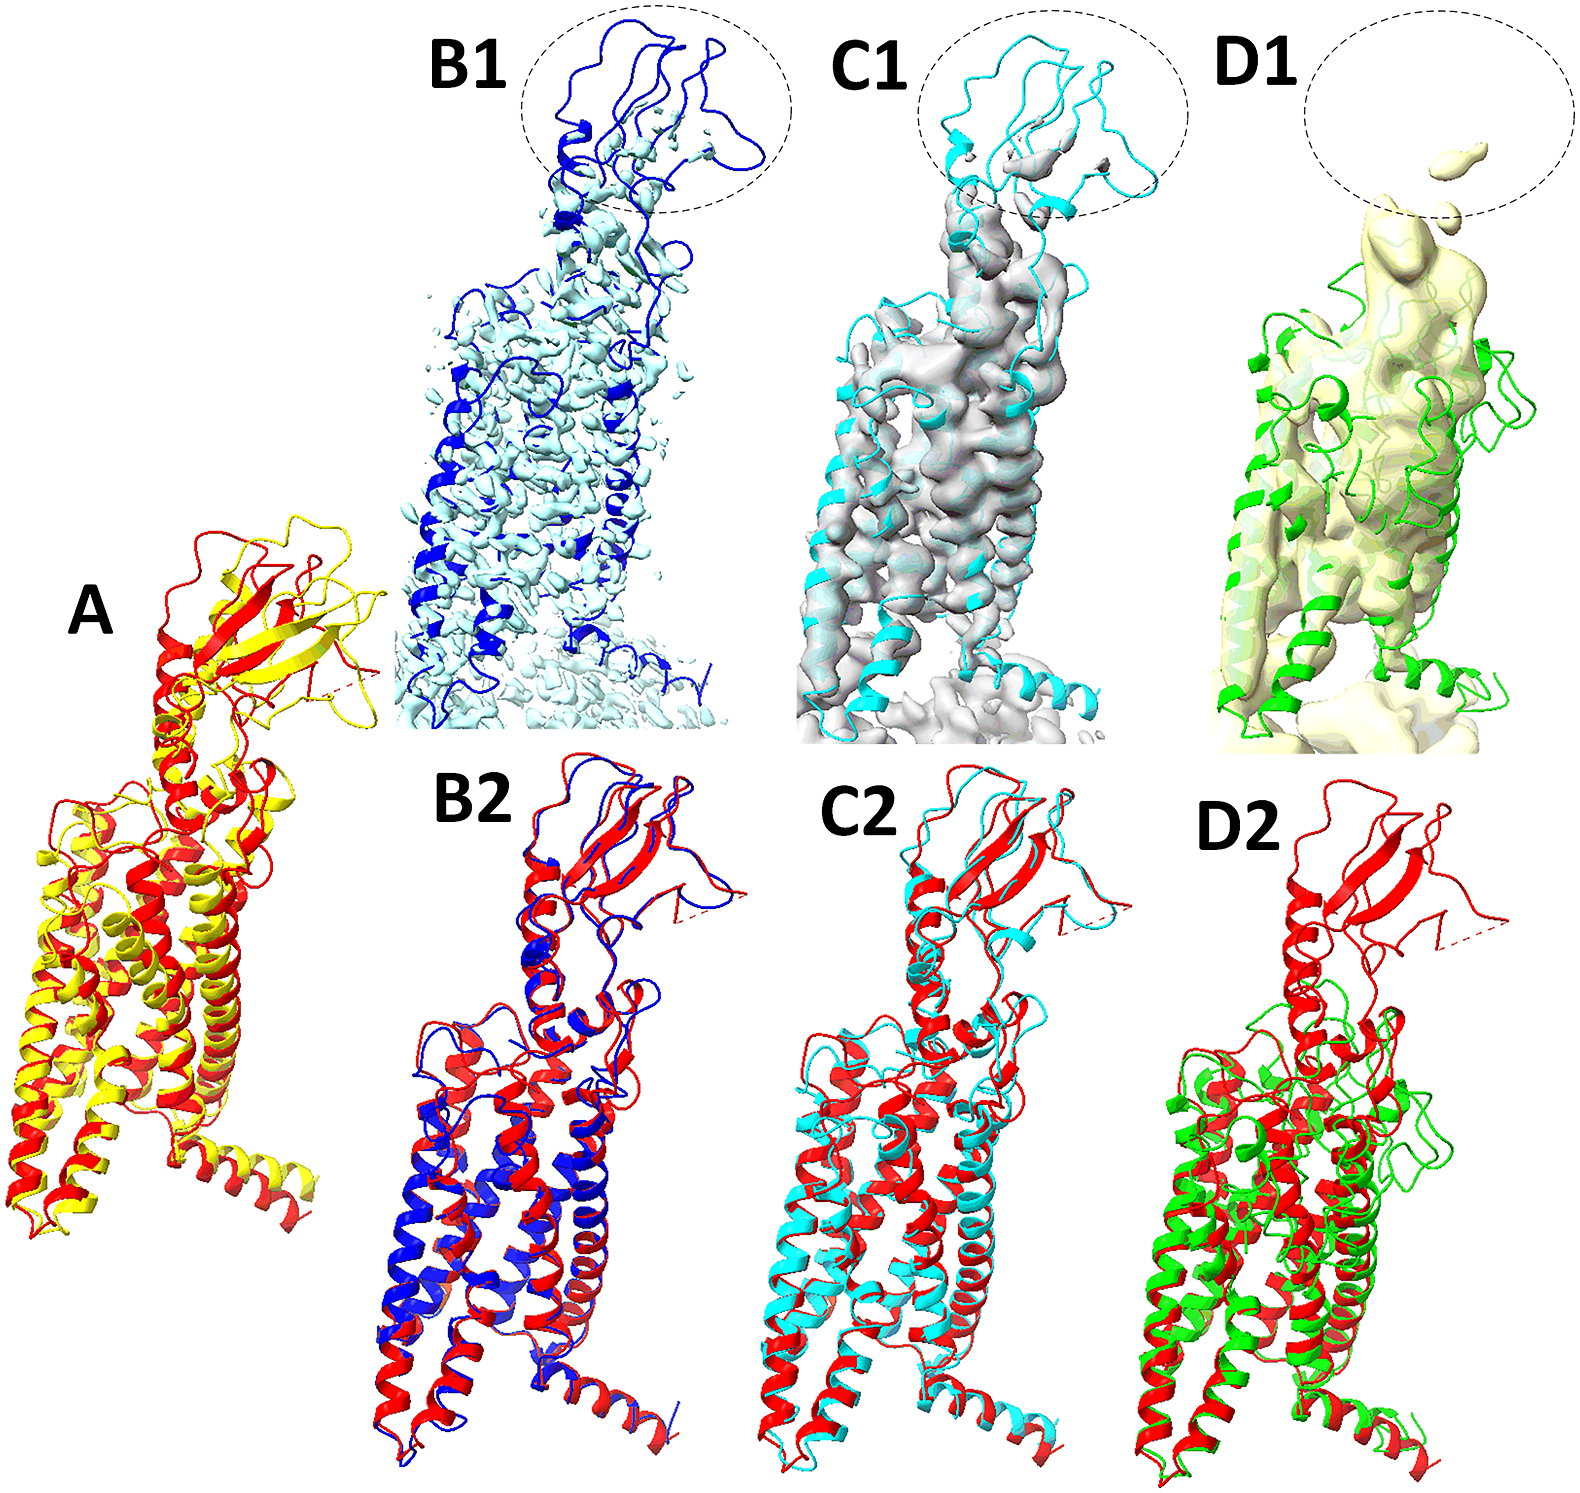
Fig. 1. Models obtained from AlphaFold2 and the refinements using Cryo-EM map 23274–7LCI-R (EMDB-PDB-chain ID) and hybrid density maps at 6 and 8 Å resolutions. (a) Superposition of the protein structure (red, chain R of 7LCI) and the model obtained from AlphaFold2. (b1) The box-cropped region of cryo-EM map 23274 (EMDB ID, cyan) superimposed with the model (blue) refined using Phenix and the cryo-EM map. (b2) Superposition of the structure (red, chain R of 7LCI) and the refined model (blue) using Phenix and the box-cropped cryo-EM map in b1. Hybrid density maps of 6 Å (grey in c1) and 8 Å (yellow in d1) resolutions are superimposed with the corresponding models refined from the maps, respectively. The 6 Å-map-refined model (Cyan ribbon in c1, c2) and 8 Å-map-refined model (green in d1, d2) are superimposed with the structure (red) in c2 and d2. The superposition of two atomic models was performed with TM-align (Zhang and Skolnick, Reference Zhang and Skolnick2005) in all figures. The superposition of a density map and a model was performed using Phenix (Terwilliger et al., Reference Terwilliger, Poon, Afonine, Schlicksup, Croll, Millan-Nebot, Richardson, Read and Adams2022) in all figures. An example of a weaker density region in the cryo-EM map and in the corresponding hybrid maps is indicated by an ellipse in b1, c1, and d1.
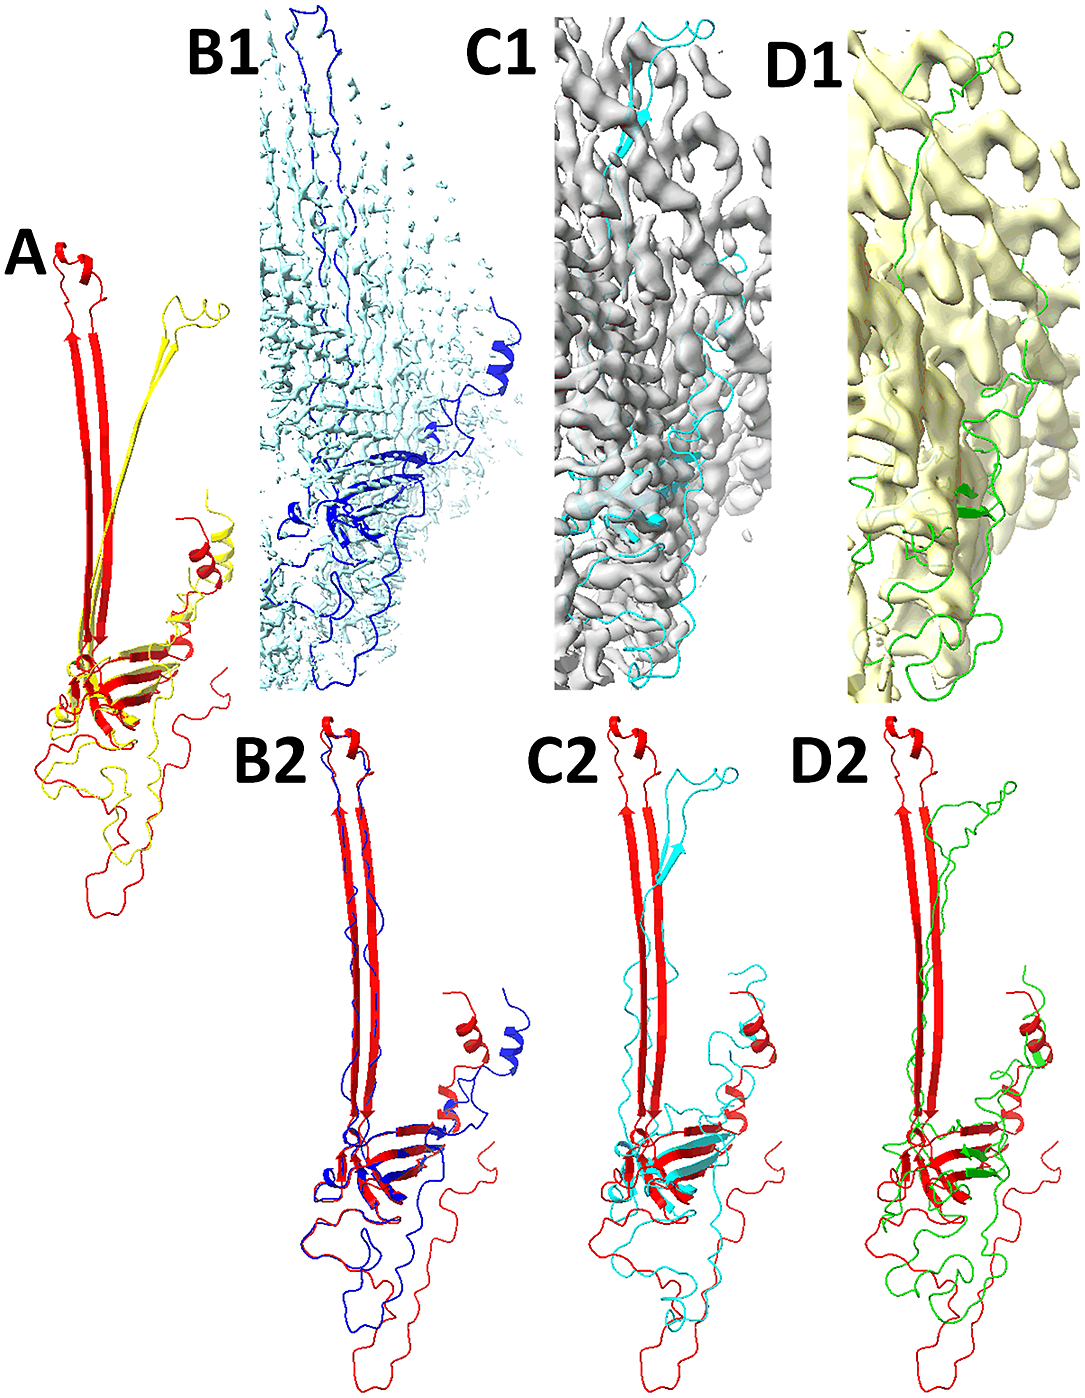
Fig. 2. Models obtained from AlphaFold2 and the refinements using Cryo-EM map 12183–7BGL-A-T1047S1D1 (EMDB-PDB-chain ID-CASP14 target ID) and hybrid density maps at 6 and 8 Å resolutions. (a) Superposition of the protein structure (red, chain A of 7BGL) and the model obtained from AlphaFold2 (yellow). This chain is one of the free modelling targets in CASP14 with ID T1047S1D1. (b1) The box-cropped region of cryo-EM map 12183 (EMDB ID, cyan) superimposed with the model (blue) refined using Phenix and the cryo-EM map. (b2) Superposition of the structure (red, chain A of 7BGL) and the refined model (blue) using Phenix and the box-cropped cryo-EM map in b1. Hybrid maps of 6 Å (grey in c1) and 8 Å (yellow in d1) resolutions are superimposed with the model refined from the corresponding map. The 6 Å-map-refined model (Cyan ribbon in c1, c2) and 8 Å-map-refined model (green in d1, d2) are superimposed with the structure (red) in c2 and d2.
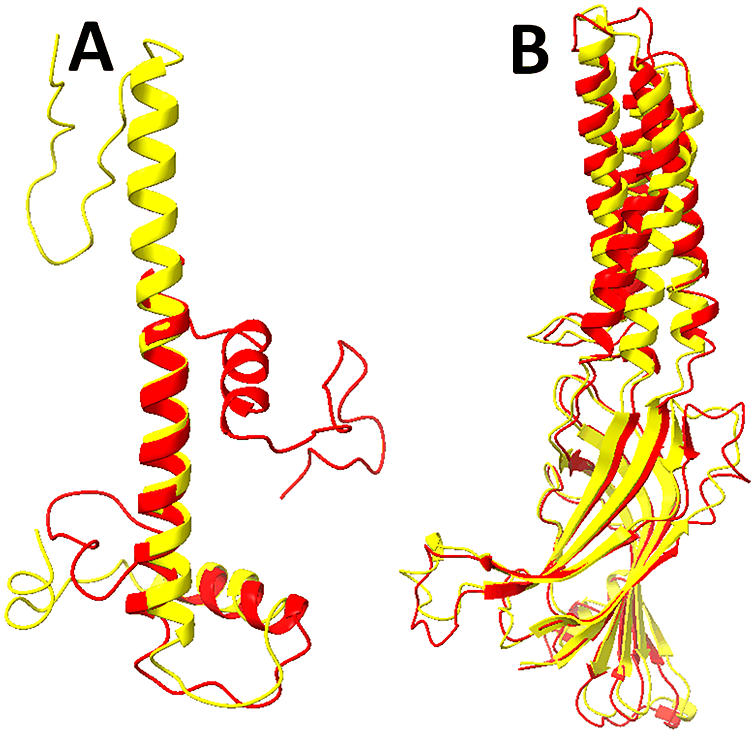
Fig. 3. Predicted models using AlphaFold2 for 7LV9-B and 7L6U-A (PDB ID–Chain ID). The structures (red) and models predicted using AlphaFold2 (yellow) are superimposed for chain B of 7LV9 (a) and chain A of 7L6U (b). See the Supplementary Material for more details about the two cases.
The refinement of AlphaFold2 models using Phenix and high-resolution cryo-EM maps was successful, since an improvement in accuracy was observed for all the 13 cases (Table 1). This observation is similar to the results of Terwilliger et al., even though there are minor differences in the data, the number of iterations of refinement, and the evaluation of model accuracy. The evaluation of model accuracy was performed using TM scores instead of the percentage of alpha-carbons, and a new CASP target was added to the test data. Our results show that the high-resolution cryo-EM maps and the refinement method proposed by Terwilliger et al. are capable of correcting model errors. In particular, for the eight best models with over 0.8 TM scores obtained from AlphaFold2, the refinement consistently enhanced them to near experimental accuracy models with near or over 0.9 TM scores (Table 1). For the three models of TM score between 0.7 and 0.8, the enhancement is modest, producing models of near 0.8 TM score after refinement. For the poor model that has a TM score of 0.39, the enhancement is limited, since the refined model has a TM score of 0.42. Our results show that the level of enhancement is related to the quality of the initial model. Those initial models with better than 0.8 TM scores consistently produce near-experimental accuracy. It is worth mentioning that the refinement was conducted using a box-cropped region of the cryo-EM map near the protein chain. Without using the knowledge of the boundary of the chain, a box-cropped region often contains partial density of neighbouring chains; therefore, the refinement of such a boxed region is harder than using a region masked by the envelope of the chain. If certain knowledge about neighbouring chains is available, it might be easier for the refinement process. The experiment in this study tests the original power of the density map in refinement without any knowledge of neighbouring chains, and we observe that the high-resolution cryo-EM maps have such power to refine initial models obtained from AlphaFold2. The limited enhancement in refinement of the model in the case of 7LV9 may be related to a combination of factors, such as the small size of the chain, the accuracy of the model, and the resolution of the density map (Table 1). This case has the lowest accuracy for the initial model obtained from AlphaFold2 and the lowest resolution of 4.5 Å among the data set.
Refinement of AlphaFold2 models using hybrid maps
For each experimental cryo-EM map in the previous section, hybrid density maps were generated at specific resolution values of 5, 6, 8, 10, and 12 Å. The same refinement procedure in Phenix was applied to hybrid maps at different resolution values, as in the previous section. When the resolution of maps was progressively lowered from 5 to 12 Å, the refinement procedure generally degraded in performance. Among the 13 cases, the number of cases with enhanced model accuracy after refinement (Fig. 4) is 13 for all high-resolution cryo-EM maps, but it drops to 9, 6, 1, 0, and 0 when hybrid density maps of 5, 6, 8, 10, and 12 Å resolutions were used, respectively (Fig. 4 and Table 1). Our results show that the current refinement method is most suitable for maps with resolutions higher than 6 Å.

Fig. 4. Accuracy of models measured using TM-align. The TM score of each model was calculated against the protein structure downloaded from the PDB for 13 cases. In each case, the accuracy is shown from left to right for the model obtained using AlphaFold2 (black), refinement using Phenix and cryo-EM maps (green), refinement using hybrid map of 5 Å (red), 6 Å (blue), 8 Å (yellow), 10 Å (grey), and 12 Å (light blue) resolutions.
We observed that 6 Å was a breakeven point, below which the refinement predominantly degrades the AlphaFold2 models, and above which most of them are improved. Therefore, we analysed the breakeven point in more detail in the following. When hybrid density maps at 6 Å were used in refinement, almost half (6 of the 13 cases) exhibited improved model accuracy (Table 1 and Fig. 4). This shows that the hybrid maps at 6 Å still have the potential to correct the initial models obtained from AlphaFold2. We also observed that all six cases started from already reasonable initial models with 0.76 to 0.90 TM scores. The three most enhanced cases are 7LCI (enhanced from a TM-score of 0.82 to 0.94), 7L6U (from 0.90 to 0.95), and 7LX5 (from 0.89 to 0.92). In the case of 7LCI, the enhancement appears to be mostly in the β-sheet region of the chain (Fig. 1a, c2).
In the remaining seven cases, the model accuracy at 6 Å decreased. The performance for all cases also degrades significantly at 8 or 10 Å resolution (Fig. 4) due to our refining outside the high-resolution design parameters of Phenix (note that when high-resolution cryo-EM maps were used in refinement, the model accuracy was enhanced for all 13 cases). Fig. 1b1, c1, d1 shows one example where weak density in the cryo-EM and related hybrid maps (ellipse) diminishes the refinement accuracy at 8 Å resolution.
The number of successful (improved) cases increased from six to nine when hybrid maps of 5 Å instead of 6 Å resolution were used in the refinement (Fig. 4, red bars vs. black bars). Our results, therefore, show that the majority of cases at 5 Å can still benefit from Phenix, although a previous study (conducted predominantly with 2–4 Å resolution cryo-EM maps) suggested a 4.5 Å limit (Terwilliger et al., Reference Terwilliger, Poon, Afonine, Schlicksup, Croll, Millan-Nebot, Richardson, Read and Adams2022).
Secondary structure analysis of refinement performance
As an example of the refinement performance, and to provide a demonstration of the challenges involved, we show one case, 7KZZ (PDB ID), in more detail. The model accuracy was increased from a TM score of 0.76 to 0.81 after refinement using the cryo-EM map of 3.42 Å resolution, but decreased to 0.70 using the hybrid map of 6 Å resolution (Table 1 and Fig. 4). This chain has an upper domain and a lower domain. The upper domain was predicted accurately using AlphaFold2, but the lower domain was not accurately predicted, as seen in either the superposition of the entire chain (Fig. 5a1) or the central axes of secondary structures (Fig. 5a2) (Stephanie et al., Reference Stephanie, Julio, Willy and Jing2017). The lower domain contains six long helices with lengths between 21 and 30 amino acids. In fact, the sequence segments of the six helices are well-predicted, with the maximum shift of any of the 12 ends of the 6 helices within 4 amino acids when compared to the true structure.
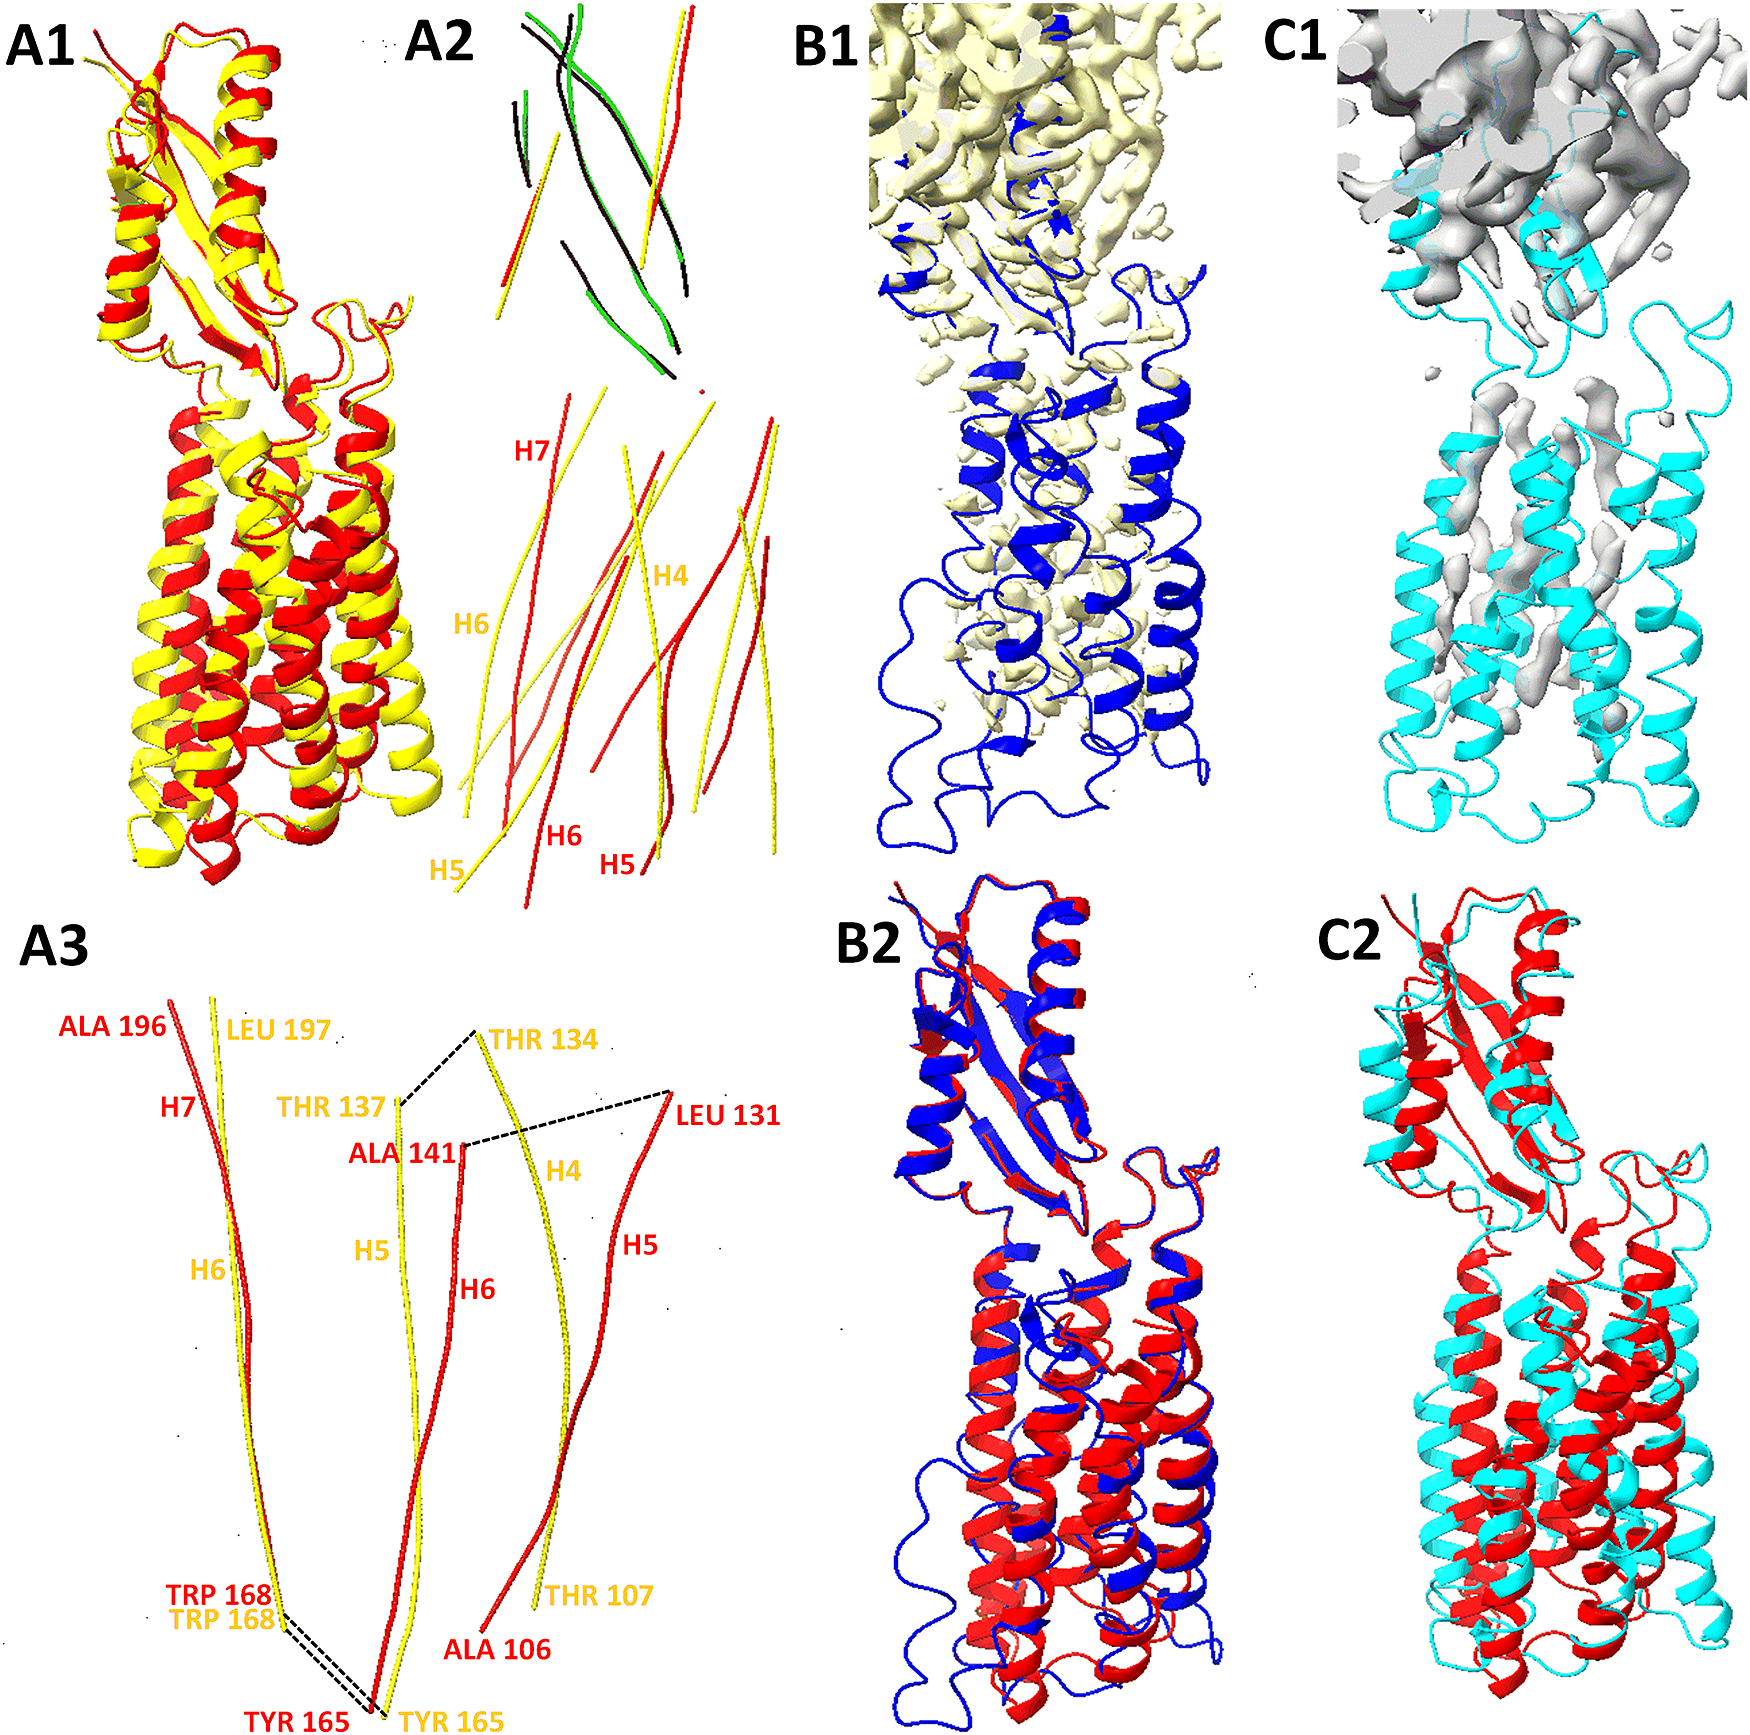
Fig. 5. The intersecondary structure geometry for long helices in the predicted and refined models of 7KZZ chain B. (a1) The superposition of the protein structure (red, chain B of 7KZZ) and the model obtained from AlphaFold2 (yellow). (a2) Secondary structures of those superimposed models in a1 are represented by their central axes using AxisComparison (Haslam et al., Reference Haslam, Sazzed, Wriggers, Kovcas, Song, Auer, He, Zhang, Cai, Skums and Zhang2018); The central axes of helices (red) and beta-strand (green) in the structure; the central axes of helices (yellow) and beta-strands (black) in the model obtained from AlphaFold2. (a3) The axes of three consecutive long helices (H5, H6, and H7) of the structure are overlaid with the corresponding axes of three helices (H4, H5, and H6) of the model using two vectors, the vector of the central axes between Trp168 and Ala196, and the vector of the turn between Trp168 and Tyr165. Amino acids are labelled at the start and end of a helix. (b1) The box-cropped region of cryo-EM map 23093 (EMDB ID, yellow) superimposed with the model (blue) refined using Phenix and the cryo-EM map. (b2) Superposition of the structure (red) and the refined model (blue) obtained using Phenix and the box-cropped cryo-EM map in b1. (c1) Box-cropped hybrid density map of 6 Å resolution (grey in c1) superimposed with the model refined from it. (c2) Superposition of the structure (red) and the model (cyan) refined using Phenix and the box-cropped cryo-EM map of 6 Å resolution. Annotation of secondary structures and molecular graphics was conducted with ChimeraX (Pettersen et al., Reference Pettersen, Goddard, Huang, Meng, Couch, Croll, Morris and Ferrin2021).
Although the individual helix segments are well-predicted, the arrangement of the six long helices deviates from the true structure. Therefore, it is impossible to fit the predicted model well with either the cryo-EM map or the hybrid density map (Fig. 5a2). Since fitting the initial model is a step before refinement, the incorrect arrangement of the six long helices presents a challenge that refinement needs to overcome. This might contribute partially to the limited enhancement from 0.76 to 0.81, not surpassing 0.9 in the TM score, even after refinement using the high-resolution cryo-EM map.
To illustrate the arrangement of the helices, we used three consecutive long helices and manually superimposed one of them (H7 in the true structure and H6 in the predicted model) so that the two vectors were approximately aligned (Fig. 5a3). The first vector represents the central axis of the helix between Trp168 and Ala196, and the second vector represents the turn between Trp168 and Tyr 165 (Fig. 5a3). This demonstration of a subset of helices shows that the relative orientations of the other two helices in the model (yellow lines) differ from those in the true structure (red lines).
Fig. 5 shows that the knowledge of secondary structure locations in a density map can be important for refinement against lower-resolution maps. Due to the spacing of β-strands of about 5 Å, individual strands are not detectable in density maps with a resolution lower than 6 Å. However, β-sheets are still detectable above about 8 Å, and α-helices are detectable above about 10 Å resolution. Therefore, it might be possible to improve the refinement strategy to handle down to 8 Å resolution maps if secondary structure information is integrated. In practice, however, detection accuracy is affected by the local quality of a map and the complexity of a structure. A recent study presented a novel flexible fitting method for cryo-EM maps at intermediate resolutions (4–10 Å). The key idea was to guide the fitting by the correspondence between the α-helices in the cryo-EM map and those in the model (Dou et al., Reference Dou, Burrows, Baker and Ju2017).
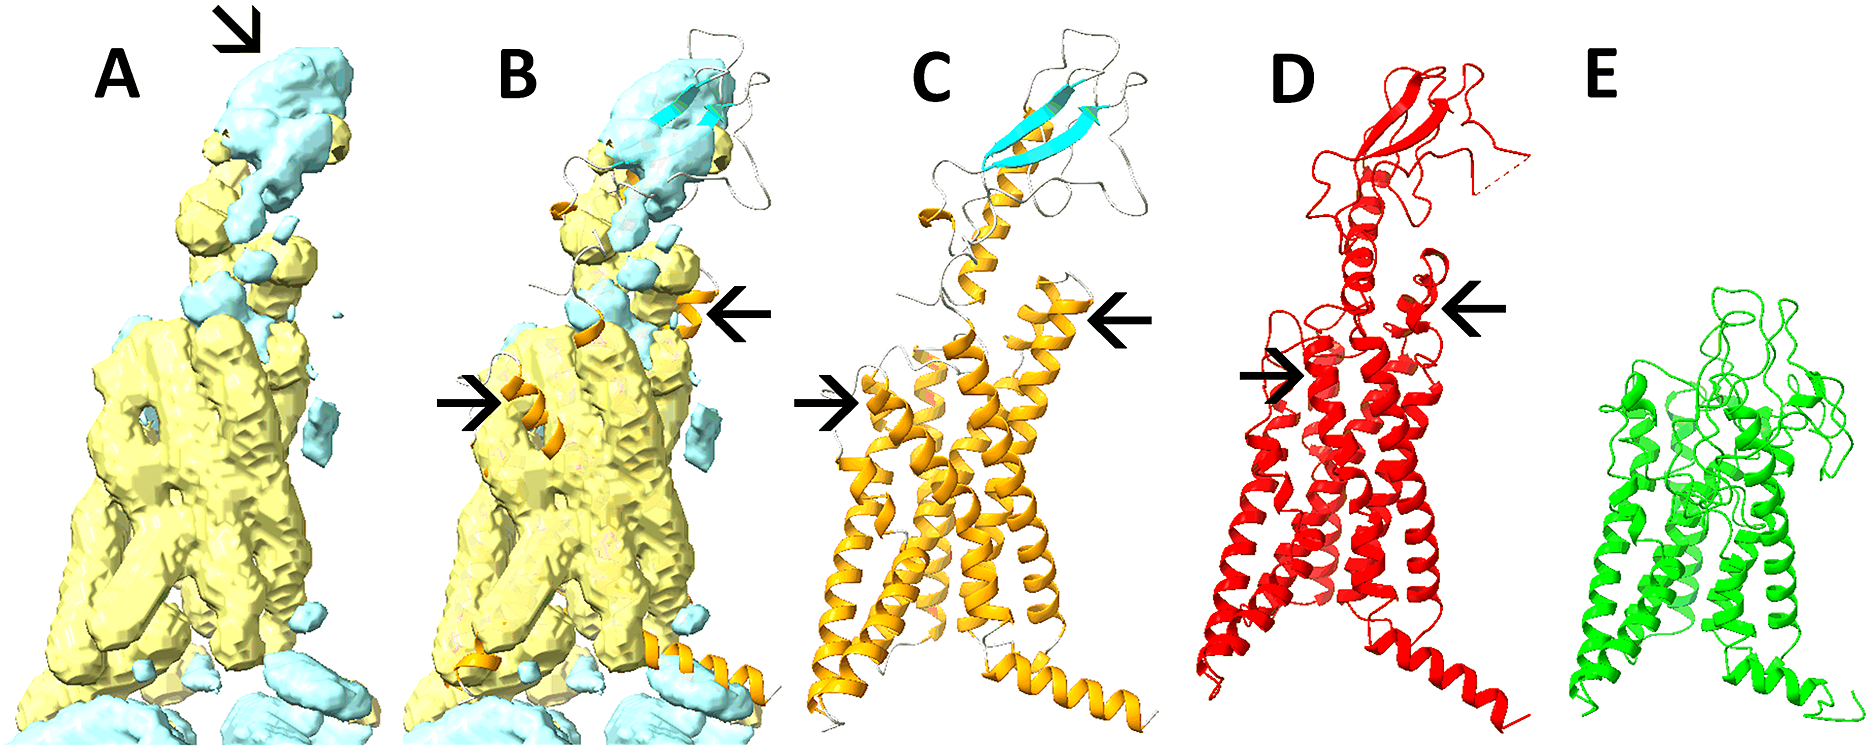
To explore the potential benefit of secondary structure detection, we used DeepSSETracer (Mu et al., Reference Mu, Sazzed, Alshammari, Sun and He2021), a deep learning-based method that can be plugged into ChimeraX to segment volumes belonging to test case 23274–7LCI-R. In this example, the β-sheet region (cyan) can be approximately segmented in the 8 Å resolution hybrid map (Fig. 6b vs. c or d). In addition, most of the helices (yellow) were detectable (Fig. 6b vs. c or d). Note that the detection was performed on a box-cropped map, so the assignment of features in Fig. 6 might include neighbouring chains. When the AlphaFold2 model was aligned with the detected secondary structure regions, the secondary structure regions were visually in good agreement (Fig. 6b). This is encouraging since it suggests an overall validity of the AlphaFold2 model. However, minor disagreement was observed between the model and the segmented secondary structure regions, as indicated by two arrows for the helix regions (Fig. 6b). At these two spots, the detected helix regions agree more with the atomic structure (Fig. 6b, d) and less with the AlphaFold2 model (Fig. 6b, c), and they point to locations for potential improvement in the AlphaFold2 model.

Fig. 6. Secondary structure regions detected from the box-cropped hybrid map of 8 Å resolution for 23274–7LCI-R (EMDB-PDB-chain ID). The helix (yellow) and β-sheet (cyan) regions in (a) and (b) were segmented from the hybrid map at 8 Å using the DeepSSETracer (Mu et al., Reference Mu, Sazzed, Alshammari, Sun and He2021). The model obtained from AlphaFold2 is coloured by the secondary structure type for helices (orange), β-sheet (cyan), coil (grey) in (c, b), and superimposed in (b). The atomic structure (red) and the model refined (green) from the hybrid map are shown in (d) and (e), respectively.
One of the challenges of incorporating any secondary structure information into refinement is the tradeoff between density and secondary structure fitting. Although Phenix was developed for high-resolution maps and emphasises density and structure fitting, enforcing secondary structure alignment with the map could prevent catastrophic failures at low resolution, such as the melting and misfolding of the β-sheet domain (cyan in Fig. 6c), prominently depicted in Fig. 6e.
Discussion and conclusion
This validation study provided new evidence that AlphaFold2 models can be enhanced by exploiting cryo-EM density maps. Our results using hybrid maps suggest that the 4.5 Å resolution limit in Terwilliger et al. (Reference Terwilliger, Poon, Afonine, Schlicksup, Croll, Millan-Nebot, Richardson, Read and Adams2022) was perhaps a bit too conservative, and good quality AlphaFold2 models might benefit from a refinement against density maps as low as 6 Å resolution.
The accurate determination of atomic structures from cryo-EM maps of 4–6 Å resolution is, of course, still challenging. Understanding the strengths and weaknesses of refinement of initial models provides insights into developing more effective methods. The success of refinement depends on the quality of an initial model, the quality of the density map, the complexity of the structure, and, last but not least, the specific refinement approach. In general, one would not expect an effective refinement method for high-resolution maps to work well for lower-resolution maps, and vice versa.
Our tests have shown that secondary structure information can be beneficial in a future medium-resolution refinement approach. Secondary structures can be detected in cryo-EM maps from 5 to 10 Å resolution (Jiang et al., Reference Jiang, Baker, Ludtke and Chiu2001). Many methods have been developed for the detection of both helices and β-sheets (Baker et al., Reference Baker, Ju and Chiu2007; Si and He, Reference Si and He2013; Li et al., Reference Li, Si, Zeng, Ji and He2016; Maddhuri Venkata Subramaniya et al., Reference Maddhuri Venkata Subramaniya, Terashi and Kihara2019; Wang et al., Reference Wang, Alnabati, Aderinwale, Subramaniya, Terashi and Kihara2021). Despite recent progress in the development of deep learning detection methods, accurate detection is still challenging. Our test at 8 Å was generally at the limit of detectability for β-sheets, and close to the limit for α-helices, although the complexity of a structure also affects the accuracy of detection. In the example, the length of the detected helices was approximate, and there was also a certain amount of false positive β detection density (Fig. 6a, d). To utilise the strength of such predicted but imperfect secondary structure locations, the refinement method needs to take into account various factors, such as the likelihood of correct detection, local quality of the map, and local structural complexity. A well-predicted initial AlphaFold2 model could complement the secondary structure prediction, as well as the density matching. However, even the AlphaFold2 models are not perfect. As was the case in the bygone era of low-resolution cryo-EM maps, there remains the risk of a compounding of errors when fitting imperfect models to imperfect densities (Egelman, Reference Egelman2008).
A more tangible benefit of the present work is a new real-space tool for filtering experimental cryo-EM maps to an arbitrary lower resolution value without requiring an atomic structure. The simulation of density maps is an important computational approach to validating methods. Traditionally, a simulated density map of a protein structure is created using the atomic structure of a protein (Ludtke et al., Reference Ludtke, Baldwin and Chiu1999; Pettersen et al., Reference Pettersen, Goddard, Huang, Couch, Greenblatt, Meng and Ferrin2004; Wriggers, Reference Wriggers2012). However, it has been challenging to create simulated data that mimic experimental data in all aspects, such as resolution, noise, and artefacts, due to the 3D reconstruction process. In the current method, more realistic data in a high-resolution cryo-EM map, rather than ideal atomic positions, were included in the simulation. An interesting side effect is that the resulting hybrid maps are expected to retain some features of the original experimental EM density [such as inhomogeneous density distribution and local resolution variations (Swint-Kruse and Brown, Reference Swint-Kruse and Brown2005; de la Rosa-Trevin et al., Reference de la Rosa-Trevin, Quintana, Del Cano, Zaldivar, Foche, Gutierrez, Gomez-Blanco, Burguet-Castell, Cuenca-Alba, Abrishami, Vargas, Oton, Sharov, Vilas, Navas, Conesa, Kazemi, Marabini, Sorzano and Carazo2016; Vilas et al., Reference Vilas, Gómez-Blanco, Conesa, Melero, Miguel de la Rosa-Trevín, Otón, Cuenca, Marabini, Carazo, Vargas and Sorzano2018)]. In other ways, the hybrid maps are also dominated by the effect of the Gaussian filter (i.e. high frequencies are attenuated rather than cut off or hidden in the noise). Thus, the hybrid maps could, in principle, exhibit a wide range of spatial frequencies, from low frequencies resulting from sample heterogeneity or variability (Leschziner and Nogales, Reference Leschziner and Nogales2007; Cardone et al., Reference Cardone, Heymann and Steven2013; Katsevich et al., Reference Katsevich, Katsevich and Singer2015; Naydenova and Russo, Reference Naydenova and Russo2017; Lyumkis, Reference Lyumkis2019; Méndez et al., Reference Méndez, Garduno, Carazo and Sorzano2021; Punjani and Fleet, Reference Punjani and Fleet2021), ranging all the way to the high frequencies in the experimental map (albeit attenuated). In future work, we will explore how well such hybrid maps mimic true low-resolution cryo-EM maps.
An intriguing effect of the resolution lowering afforded by hybrid maps is exemplified by the two cases – 7BRM and 7EDA – where Phenix refinement performance was unexpectedly improved when the resolution was lowered to 5 Å. This suggests that the refinement of AlphaFold2 models to high-resolution cryo-EM maps can get trapped in the local optima. The results also suggest that a more exhaustive sampling of conformations might be required, and that lowering resolution could be part of an annealing strategy to escape from local traps. This is yet another argument as to why it could make sense to develop a lower resolution refinement strategy even for high-resolution maps.
Acknowledgement
We thank Min Dong for IT support with the software installation.
Supplementary Materials
To view supplementary material for this article, please visit http://doi.org/10.1017/qrd.2022.13.
Data Availability Statement
Atomic models and maps used for testing are available at the public servers and databases (AlphaFold2, PDB, and EMDB; see section ‘Methods’), except for those of our refined models, which are available from the authors on reasonable request. The tools for creating hybrid experimental-simulated cryo-EM maps (see section ‘Methods’) will be available as part of the upcoming release of the Situs package at http://situs.biomachina.org.
Funding Statement
This work was supported by NIH Grant No. R01-GM062968, the ODU Batten Endowment to W.W., and a scholarship to M.A. by the Government of Saudi Arabia.
Open Peer Review
To view the open peer review materials for this article, please visit http://doi.org/10.1017/qrd.2022.13.


 Open access
Comments
Comments to Author: Alshammari et al. set to test whether AlphaFold2 models can be refined in the medium resolution cryo-EM maps (5-12 A). The test follows a recent work by Terwilliger et al. who implemented a refinement protocol in the Phenix program, which successfully refines AlphaFold2 models in high-resolution maps (better than 4.5 A). The Phenix protocol applies an iterative procedure of four cycles, in each AlphaFold2 models are fitted to the cryo-EM map, refined using a Phenix refinement, and then the resulting refined models are fed back to AlphaFold2 for another round of modeling. For their test, Alshammari et al. have run a single cycle of the procedure. To address the limited number of accurate structures for low-resolution EM maps, the authors used a good idea of "hybrid density maps", which are high-resolution maps blurred with a Gaussian, lowering the resolution but, supposedly (see below), preserving some of the noise and imperfections present in the original maps. Altogether, they found that the single cycle of the Phenix refinement can improve some models up to 6 A resolution. They explore examples and point out some of the specific reasons why refinement can fail.
The manuscript reads well and the study has been overall well conduced (but see below). For detailed claims like 4 A vs 6A resolution limit, one would like to see a bigger benchmark that 13 cases.
In contrast to the original Phenix procedure, where refined intermediate models are fed back to Alphafold2 so that the EM map and AlphaFold2 work together to improve the models, here only one cycle is run. With one iteration - so no moving back to AlphaFold - the authors test only the Phenix refinement procedure but not new procedure by Terwilliger et al. With four cycles, results might be even better pushing the resolution limit beyond 6 A or increasing success rate at 5-6 A. That said, this would not change the conclusions of this study, so repeating with four cycles does not seem necessary.
Overall, while the study represents merely a test of an existing method (or one fourth of it) on a small benchmark, the addressed question is important for the field and the manuscript can be useful and timely reference, and can inspire new developments.
Major comments:
- The authors simulate densities by first converting a high-resolution map to pseudo-atomic beads using vol2pdb and then convert the beads to a map at desired resolution. Why not blurring the map directly with a Gaussian? The authors say that their procedure "incorporates any quality variation within the parent high-resolution cryo-EM map into the hybrid map, resulting in a more realistic low-resolution density model" but are those "quality variations" preserved in the intermediate bead model? It must be tested or explained that the intermediate bead models preserve "quality variations" or those statements should be removed from the manuscript.
- I am not sure from the provided description whether the blurring with the intermediate bead models produces good estimation of the resolution of the resulting maps - is 6A from this "bead" procedure equivalent to a 6A map blurred directly? This equivalence must be demonstrated if authors want to claim absolute thresholds. Or, the work could be repeated with maps blurred directly, which might be better in general.
Minor comments:
- Abstract: "Resolutions better than 4.5A were reached" - resolution of models? What does this sentence mean?
- Introduction: The authors list how many PDB structures have been deposited in different resolution ranges but it would be much more informative to assess the impact of their work if they list how many cryoEM maps were deposited in these ranges, even if, or especially if, the PDB model was not deposited.
- In 2.2, the (letters?) in the formulas rendered as squares in my PDF, I assume they are fine and I could understand them, but should be made sure by the editors that it is corrected.
- Table 1: could you add columns with average pLDDT and pTM for comparison. Does the success correlate with pLDDT and pTM as it does with TM? It would be useful for the readers to assess to what extent they can rely on the predicted scores in assessing whether the refinement might succeed.
Figure 3 - why the EM map and refined model are not shown like in the other figures?