


INTRODUCTION
Although in temperate regions the incidence of some respiratory virus infections [e.g. influenza, respiratory syncytial virus (RSV), parainfluenza virus] appears to correlate well with seasonal weather conditions, in tropical countries this relationship has been much less well-defined with detectable respiratory virus activity all year round [Reference Chew1, Reference Shek and Lee2]. In fact, it has been suggested that the relationships between certain meteorological factors (e.g. temperature and relative humidity) and the incidence of some respiratory viruses are the converse of those found in temperate regions [Reference Noyola and Mandeville3, Reference Tang4], which may be due to the majority of virus transmission occurring within indoor, air-conditioned (i.e. cooler, lower humidity) environments that favour airborne virus survival and transmission [Reference Tang5, Reference Tellier6].
Yet there is still a need to understand more clearly the relationship between respiratory illness, respiratory virus incidence and meteorological factors in tropical countries, as this may assist in hospital services planning for paediatric admissions. This has become particularly relevant with the recent emergence of the pandemic influenza A/H1N1/2009 virus, which is likely to become the predominant circulating influenza strain for the next several years [Reference Dawood7, Reference Smith8].
Singapore is an equatorial island, situated in the monsoon rain belt of South East Asia. Being in the tropics, the climate remains relatively stable all year round. Mean daily temperatures are 23·9–32·3°C with a monthly rainfall of 107–329 mm. An annual wet season occurs from October to January when rainfall is above average followed by a relatively dry period from February to early March [9]. Although there has been one study relating meteorological conditions to respiratory virus incidence in Singapore [Reference Chew1], this used laboratory data only rather than data on clinical admissions for influenza-like illness.
Elsewhere, outside the tropics, there have been numerous studies examining the seasonality of influenza illness and its associated hospitalization burden and mortality [Reference Bhat10, Reference Chiu11]. However, these studies did not specifically attempt any correlations with meteorological parameters. Other researchers have questioned the relevance of such climate variables as a significant underlying contributor to the seasonality of respiratory virus infections in more temperate regions, citing other potentially significant contributing factors such as host immune responses and viral virulence [Reference Reichert12, Reference Lofgren13].
There has been a call for more studies to be conducted in tropical areas [Reference Viboud, Alonso and Simonsen14, Reference Tang15]. The present study was designed to explore the relationship between factors affecting the seasonality of five common presenting clinical conditions (i.e. asthma, upper and lower respiratory tract infections, urinary tract infections, acute gastroenteritis), the incidence of laboratory-confirmed respiratory viral infections and their correlation with various meteorological parameters in a tropical paediatric population.
MATERIALS AND METHODS
This is a retrospective study using previously collated data for the period 4 August 2003 to 28 December 2008. Approval from the Kadang Kerbau Women's and Children's Hospital institutional review board (reference no. RAU/2008/148) was given for this study.
Meteorological data
Daily meteorological parameters were obtained from the Meteorological Services Division, National Environment Agency of Singapore, for this period. The parameters included: maximum, average and minimum temperature, relative humidity, rainfall, amount of cloud and sunshine duration.
In addition, it has been suggested recently that absolute as opposed to relative humidity measurements may correlate more closely with influenza virus transmission and survival [Reference Shaman and Kohn16]. Vapour pressure (e) can be calculated from temperature and relative humidity using the following equations:
where e s(T 0) is saturation vapour pressure at reference temperature T 0 (6·11 mb), T 0 is the reference temperature (273·15 K), L is the latent heat of evaporation for water (2·27 MJ/kg), R v is the gas constant for water vapour (461·5 J/kg.K), T is temperature in degrees Kelvin (K); and RH is relative humidity [Reference Shaman and Kohn16].
Hence, in this study, the relationship between absolute humidity and the various clinical conditions was also investigated by using vapour pressure as the measure of absolute humidity.
Clinical data
The Kadang Kerbau Children and Women's Hospital (KKH) is an 830-bed healthcare facility dedicated to the care of women and children in Singapore. The Children's Emergency department (CE) at KKH employs an electronic healthcare recording system where a patient's clinical diagnosis is coded according to the International Classification of Diseases – 9th Clinical Modification (ICD-9-CM) upon discharge.
The weekly total number of patients for this study period, together with their demographic characteristics, who were diagnosed as having upper respiratory tract infection (URTI, ICD-9-CM codes: 461-465), lower respiratory tract infection (LRTI, ICD-9-CM 033, 466, 483, 486, 770), asthma (ICD-9-CM 493), urinary tract infection (UTI, ICD-9-CM 590, 595, 599) or acute gastritis/gastroenteritis (ICD-9-CM 002, 005, 009, 535, 787) was extracted from the electronic patient database. Note that the ICD-9-CM codes used by the KKH CE is an abridged version which does not contain all the clinical codes. This is to allow rapid and streamlined encoding by the physicians based on the patients' presenting symptoms. As such, the grouping of clinical conditions in this study were selected from all available ICD-9-CM codes used by KKH CE and verified independently by three physicians. Cases of UTIs and acute gastritis/gastroenteritis were included as clinical admission controls, with the assumption that there was no expected association between these illnesses and respiratory virus infections or any particular meteorological parameter.
Laboratory data
The respiratory samples (usually nasopharyngeal aspirates) that were tested for respiratory viruses were mainly obtained from younger paediatric patients (aged 0–5 years, with no other demographic restriction), who presented with respiratory illnesses, most of whom were admitted to the wards. The routine respiratory virus panel that was applied to all respiratory samples included: influenza A (unsubtyped), influenza B, RSV, parainfluenza virus (types 1–3), and adenoviruses. These viruses were detected with a commercial slide-based assay, using virus-specific fluorescence-labelled monoclonal antibodies (D3 Ultra™ DFA Respiratory Virus Screening & ID kit, Diagnostic Hybrids Inc., USA) and ultraviolet light microscopy. The weekly number of positives detected for each respiratory virus was routinely collated and archived. The data relevant to the period under study was extracted from this laboratory database for analysis.
Statistical analysis
We calculated the average time-series by week over the years between 4 August 2003 and 28 December 2008 and plotted these aggregated measures graphically to examine for the presence of seasonality. Multivariate time-series analysis was conducted to study the effect of meteorological factors on the paediatric admissions for asthma, URTIs, LRTIs, acute gastroenteritis and UTIs for this period.
First, an ARIMA (autoregressive integrated moving average) model was developed for each of these five weekly paediatric clinical conditions. ARIMA models predict the value of the target variable with a linear function of lag values (autoregressive part) plus an effect from random shock values (moving average part). The identification of the order of autoregressive and moving average followed the Box–Jenkins approach. The need for differencing was accessed by a visual inspection of the time-series plot as well as the autocorrelation plot of the time-series.
Second, meteorological parameters were inserted as explanatory variables into these ARIMA models. For URTIs, LRTIs and asthma, further models were explored to include the laboratory virological data (i.e. the positive respiratory virus immunofluorescence results) as explanatory variables. The selection of the explanatory variables was performed, based on a backward approach. Akaike's Information Criterion (AIC), which acts to penalize the number of parameters in the model, was used to guide the model selection, i.e. the lower the AIC, the better the model fit. The validity of the model was checked by examining the residuals with the modified portmanteau test. Statistical analyses were performed with SAS/ETS version 9.0 (SAS Inc., USA). A P value of <0·05 was considered as statistically significant.
RESULTS
Meteorological data
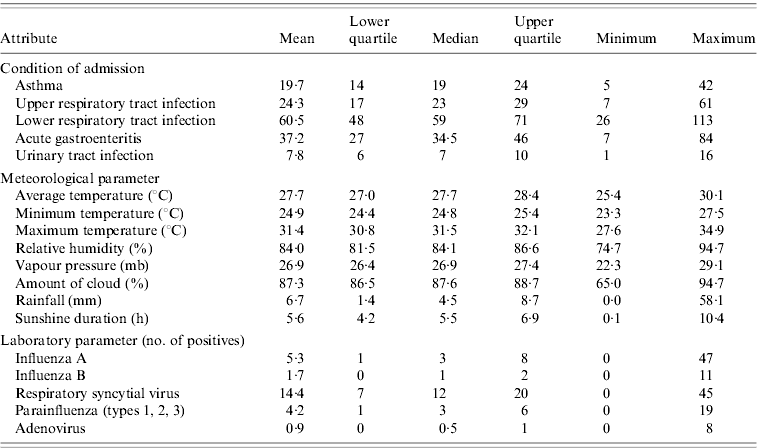
During this study period, the average temperature in Singapore ranged between 25°C and 30°C throughout the year with the highest during April–May (average temperature 28°C, average maximum temperature ~32°C) and the coolest during December and January (average temperature 26°C, average minimum temperature ~24°C). Relative humidity tends to be highest (average 85–87%) in December and January, when the most rainfall occurs. Vapour pressure, a measure for absolute humidity, tends to be lowest in January and February reaching its highest in and around May. February tends to be the driest month of the year with the lowest rainfall and a relative humidity of about 80%. Sunshine duration is highest in January–February (average 6–8 h) and lowest towards the end of the year (average 4 h). The amount of cloud is lowest in January–February (average 85%) and highest towards the end of the year (average 89%).
Over the study period these meteorological parameters were found to conform to a longer historical trend from 1982 to 2008, without significant deviation, i.e. for each year the mean daily temperature was warmest during weeks 16–28 (April–June) while the wettest months occurred during weeks 44 to 4 (November to January of the following year) [9]. Hence this study period can be considered to be typical of Singapore with regard to climate parameters.
Clinical data
Clinical data from a total of 42 155 hospital admissions were included in this study. Of these, 58% were males and 42% were females. Almost three quarters of the patients were aged <5 years, 25% were aged between 5 and 14 years and <1% were aged >14 years. Chinese were the biggest ethnic group, accounting for slightly more than half of the study population, followed by Malays (30%) and Indians (11%), the remaining 5·8% were from other races. A plot of the weekly average of the paediatric emergency admissions over the study period is shown in Figure 1.
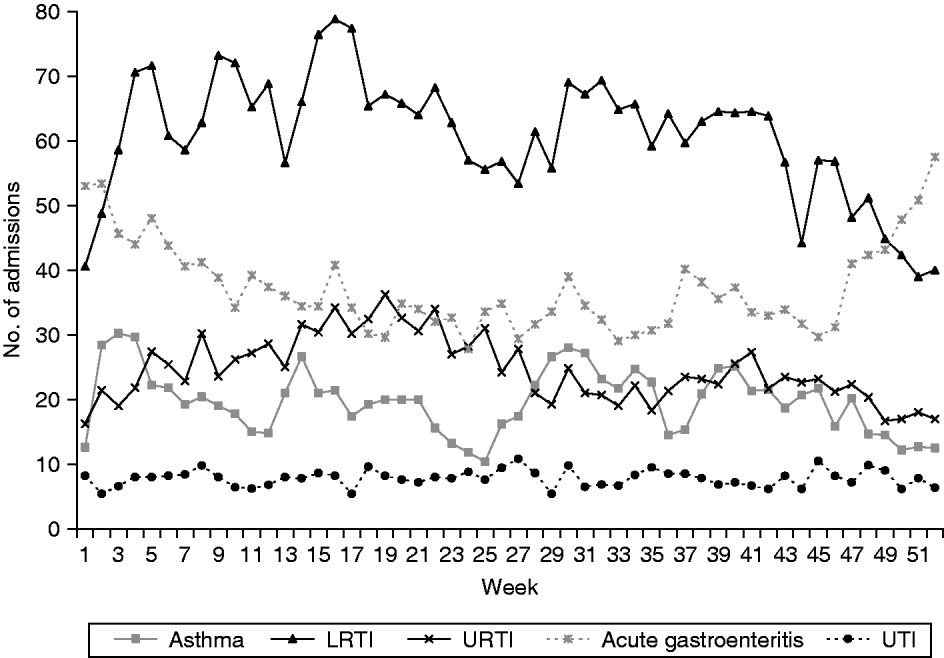
Fig. 1. Weekly average of various paediatric emergency admissions [asthma, lower respiratory tract infection (LRTI), upper respiratory tract infection (URTI), acute gastroenteritis and urinary tract infection (UTI)] in Singapore for the period August 2003 to December 2008.
Admissions for URTIs and LRTIs tend to be highest in April (32–35 URTI, 76–78 LRTI admissions a week) and reach their lowest in December (18 URTI, 40 LRTI admissions a week). Admissions for LRTIs also show a second, smaller peak in August (70 admissions a week). Admissions for gastroenteritis tend to be high at the beginning of a year (52 admissions a week), then decline gradually to reach their lowest in August (30 admissions a week) then rise again towards the end of the year (50–58 admissions a week).
The number of paediatric admissions due to asthma appears to show two cycles a year with the peaks occurring in January and July (with about 30 admissions a week), followed by smaller peaks in April and October (25–26 admissions a week), reaching the lowest in June and December, respectively (10–12 admissions a week). These peaks appear to coincide with school re-opening months (January and July of each year) while the troughs fall within the school holiday periods of >4 weeks during June and December.
Admissions for acute gastritis/gastroenteritis are highest in December and January (>50 admissions a week) and then gradually decrease to their lowest in May and June (30–35 admissions a week). Admissions for UTIs do not seem to exhibit any obvious seasonality pattern with the admissions varying from 6 to 10 per week, throughout the year.
Laboratory data
A total of 44 026 respiratory samples were analysed by the laboratory during this period, with 7487 specimens being positive for at least one respiratory virus (overall positive rate of 17·0%).
From those laboratory-confirmed incidence data, RSV tends to peak in early June and late July with influenza A peaking in between. Influenza B activity tends to be relatively higher in the earlier months of the year with the activity declining towards the end of the year. A similar pattern is observed for the parainfluenza viruses (all types, 1–3 combined) (Fig. 2). No consistent seasonality pattern was observed for adenovirus (data not shown, but available on request).
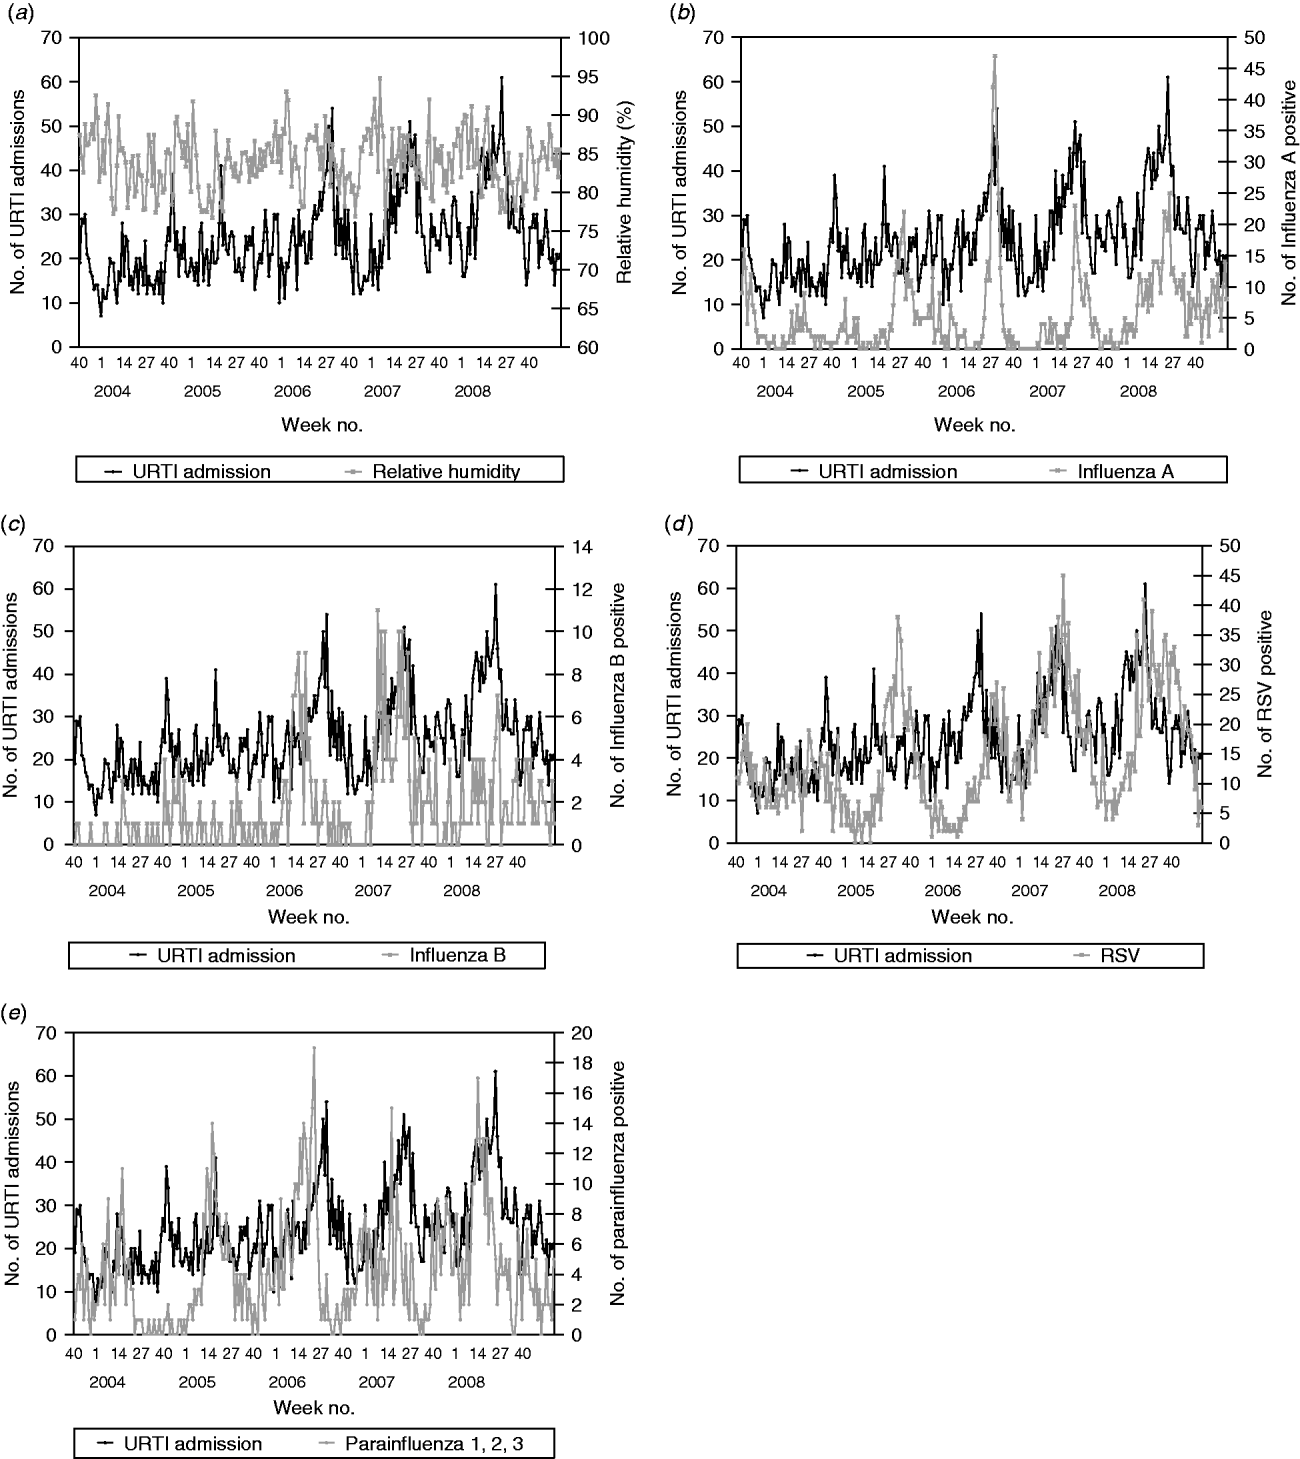
Fig. 2. (a) Weekly paediatric admissions for upper respiratory tract infection (URTI) against weekly average relative humidity and (b) weekly number of positives for influenza A, (c) influenza B, (d) respiratory syncytial virus (RSV) and (e) parainfluenza viruses (types 1–3).
A summary of the weekly statistics for the number of paediatric emergency admissions, meteorological parameters and laboratory virological data for Singapore during the study period is given in Table 1.
Table 1. Summary of weekly statistics for paediatric emergency admissions, meteorological parameters and laboratory virological data in Singapore during August 2003–December 2008
Data analysis
The multivariate time-series models for paediatric admissions for asthma, URTIs, LRTIs, gastroenteritis and UTIs are summarized in Table 2. For URTI and LRTI admissions, the best models were found to be ARIMA(3,0,0) and ARIMA(2,0,0), respectively. Both URTI and LRTI admissions decreased with rising relative humidity. However, calculated vapour pressure did not show any significant correlation with URTIs and LRTIs (P=0·0663 in the URTI model, P=0·2572 in the LRTI model). With respect to laboratory-confirmed respiratory virus infections, URTI admissions were found to increase with the number influenza A (β=0·355, P<0·0001), influenza B (β=0·845, P<0·0001), RSV (β=0·208, P=0·0012) and parainfluenza viruses (types 1–3 combined, β=0·512, P=0·0001) positive test results. The model also indicates that for this dataset, there is an increase of 0·355 URTI admissions for each additional influenza A positive, i.e. on average, 1/3 laboratory-confirmed influenza A infection is admitted for URTI. Similarly, there are an extra 0·845, 0·208 and 0·512 URTI admissions for each additional influenza B, RSV and parainfluenza virus (types 1–3) positive infections, respectively (Fig. 2). So, for example, for RSV, this would mean that on average, 1/5 laboratory-confirmed RSV infection is admitted for URTI.
Table 2. Multivariate time-series models for paediatric admissions due to asthma, upper respiratory tract infection (URTI), lower respiratory tract infection (LRTI), gastroenteritis and urinary tract infection (UTI) (August 2003–December 2008)
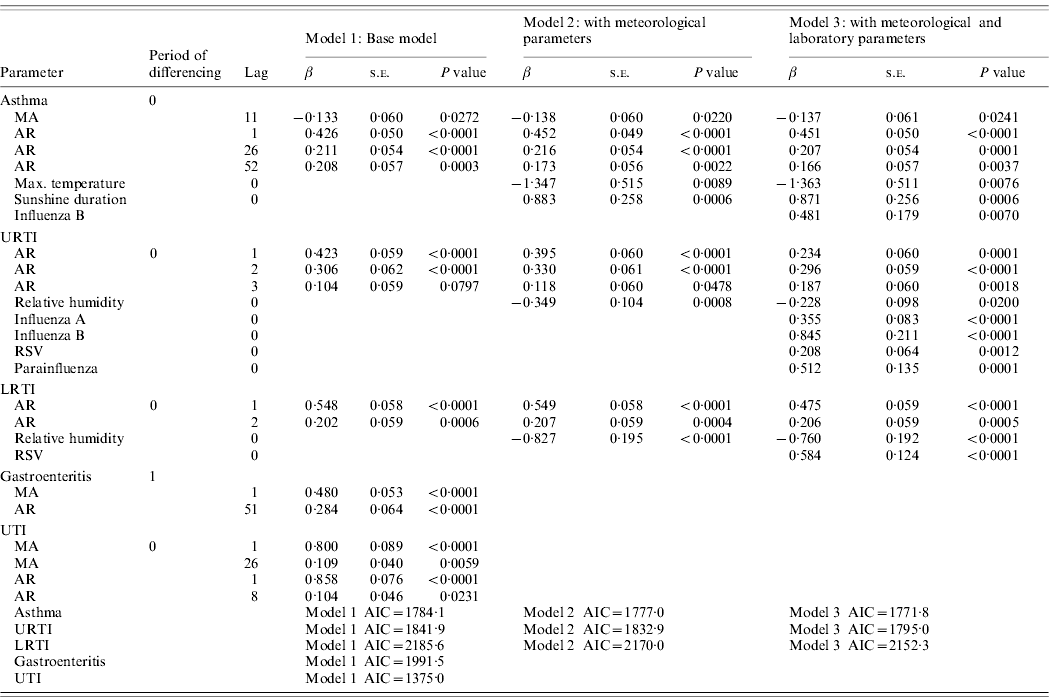
MA, Moving average; AR, autoregressive; RSV, respiratory syncytial virus; AIC, Akaike's Information Criterion.
For LRTI admissions, the series was found to be positively correlated with the number of RSV positive tests (β=0·584, P<0·0001), i.e. on average, 3/5 laboratory-confirmed RSV infections are admitted for LRTI (Fig. 3).
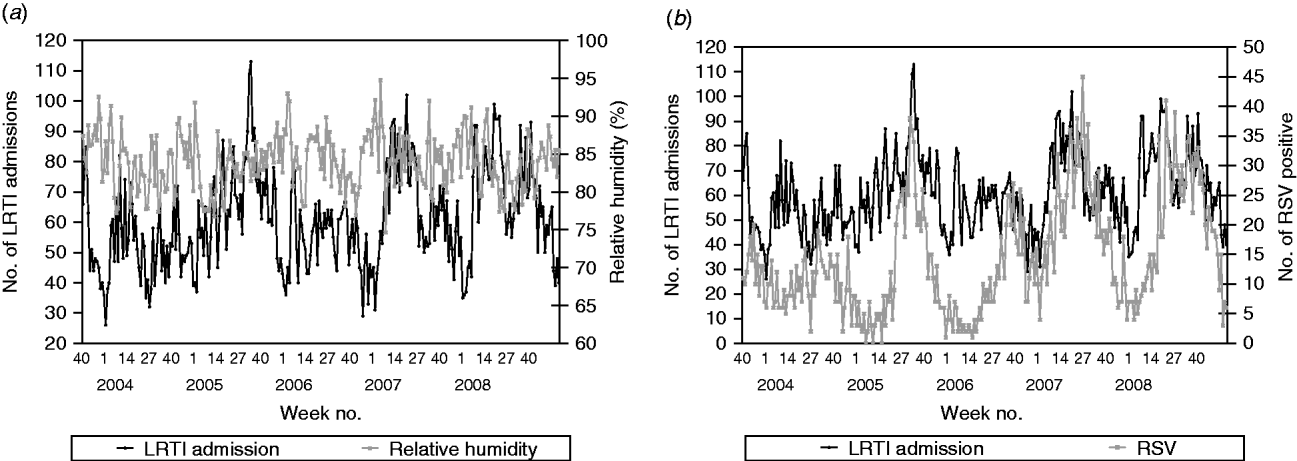
Fig. 3. (a) Weekly paediatric admissions for lower respiratory tract infection (LRTI) against weekly average relative humidity and (b) weekly number of positives for respiratory syncytial virus (RSV).
Admissions for asthma were found to be a time-series process with moving average terms at lags 11 and autoregressive terms at lags 1, 26 and 52 with maximum temperature negatively correlated (β=−1·363, P=0·0076) and sunshine duration positively correlated (β=0·871, P=0·0006) with asthma admissions (Fig. 4). This suggests that on average there is a decrease of 2·7 asthma admissions per week for an increase of 2°C maximum temperature. Conversely, there is an increase of 1·7 asthma admissions per week for an increase of 2 h sunshine duration. Asthma was also found to be positively correlated with the number of influenza B-positive samples (β=0·481, P=0·0070).
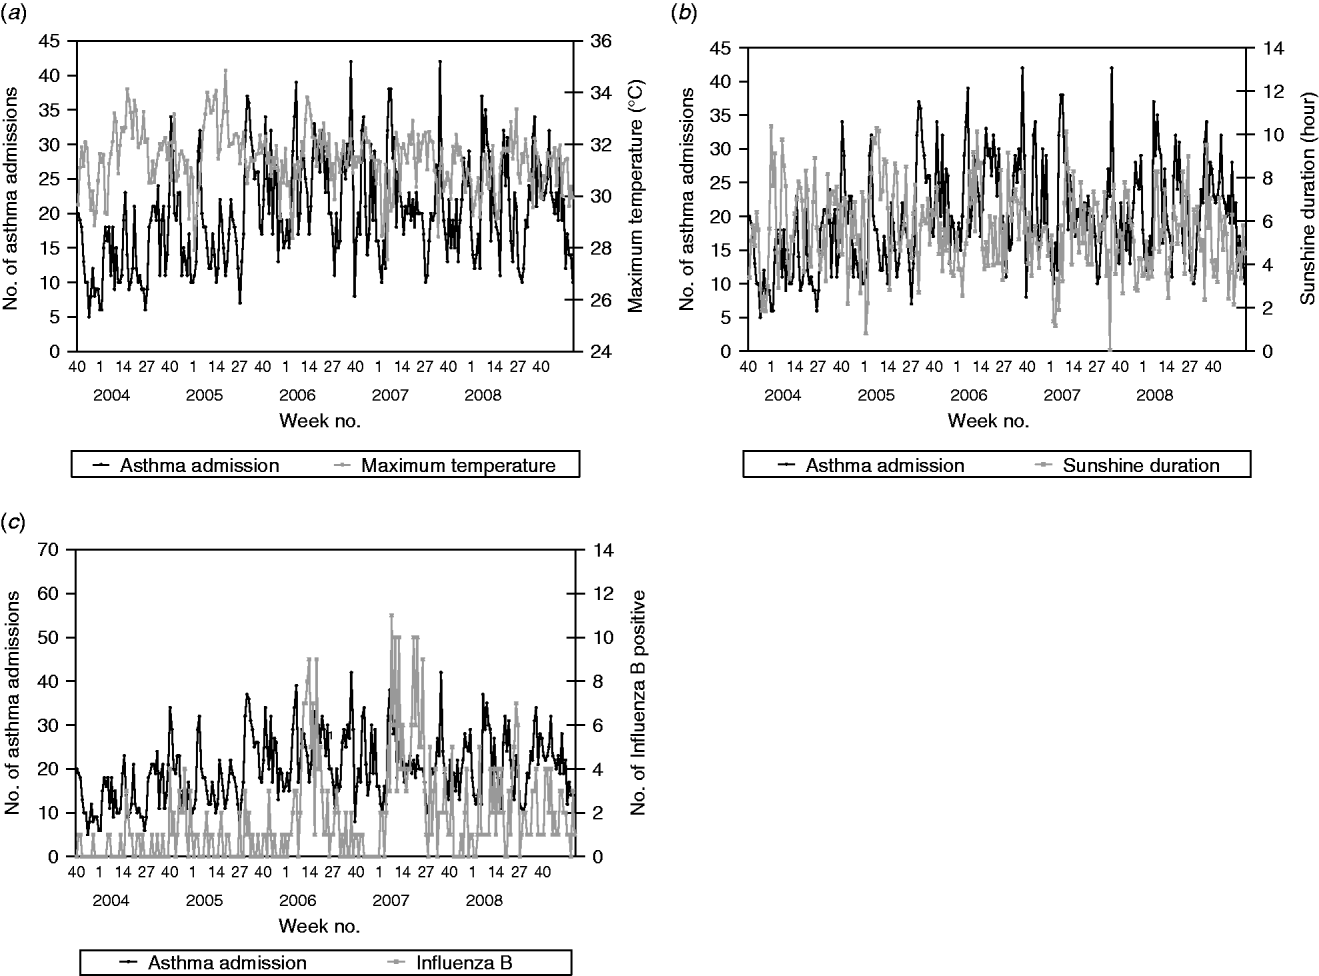
Fig. 4. Weekly paediatric admissions for asthma against (a) weekly average maximum temperature, (b) sunshine duration and (c) influenza B-positive samples.
For all these admission conditions (asthma, URTIs, LRTIs), the addition of the meteorological parameters and laboratory results into the models resulted in a smaller AIC. The models with the meteorological variable(s) and laboratory results indicated a better fit than those without.
The admission series for gastroenteritis and UTIs were not found to correlate with any meteorological parameters. For all models, the modified portmanteau test showed that the autocorrelation of the residuals at each lag was not significant, indicating that error structure of the resultant models exhibited as white noise.
DISCUSSION
In temperate regions, there are clear seasonal variations in the occurrence of influenza activity, with a marked peak in the cold winter months. However, tropical regions have a much less well-defined seasonality with detectable background activity throughout the year. In particular, the relationship between three different, but potentially related groups of variables: hospital admissions for respiratory illness (asthma, LRTIs, URTIs), laboratory-confirmed respiratory virus infections, and meteorological parameters, in such a tropical climate has not yet been investigated. This study has examined these three different groups of variables in the tropical climate of Singapore, using multivariate time-series analyses.
As a statistical tool ARIMA models are useful in modelling the stochastic dependence structure of a time-series. Through the modelling of the stochastic dependence, ARIMA models have been shown to provide more accurate predictions than those obtained by the traditional regression methods [Reference Choi and Thacker17, Reference Choi and Thacker18]. Time-series analyses have been increasingly used in seasonality studies of hospital admissions [Reference Chen, Xirasagar and Lin19, Reference Xirasagar, Lin and Liu20], and epidemiological studies of respiratory tract infections [Reference Chew1, Reference Tang4, Reference du Prel21–Reference Antunes23]. Hence, this statistical approach, as used in the present study, is an acceptable method to analyse this data to determine any resulting correlations between the various clinical, laboratory or meteorological parameters.
Thus, in this study, using time-series analysis, CE admission of both URTIs and LRTIs were found to be negatively related to relative humidity. This finding is consistent with existing knowledge as higher relative humidities are known to decrease the survival of lipid-enveloped viruses, which include the four virus species above: influenza A (unsubtyped), influenza B, RSV, parainfluenza virus (types 1–3), although not adenoviruses [Reference Tang5, Reference Tellier6, Reference Hemmes, Winkler and Kool24–Reference Tellier28].
Shaman & Kohn suggested that absolute humidity, as opposed to relative humidity, may better correlates with influenza virus survival and transmission [Reference Shaman and Kohn16]. In contrast, our study suggests that admissions for URTIs and LRTIs correlate better with relative humidity than absolute humidity. We have attempted to include vapour pressure, the surrogate measure of absolute humidity, instead of relative humidity in the LRTI and URTI models but neither model yielded a statistically significant correlation.
With respect to laboratory-confirmed data, URTI admissions were positively related to the incidences of influenza A and B, RSV, parainfluenza viruses (types 1–3, combined in this analysis), whereas LRTI admissions were only positively related to the incidence of RSV infections. Whereas all of these viruses can cause both URTIs and LRTIs, RSV tends to be the most common cause of bronchiolitis (a LRTI) in young children and this may have weighted the significance of this positive correlation with LRTIs towards RSV compared to the other respiratory viruses [Reference Welliver29, Reference Simoes and Carbonell-Estrany30].
Severe, early childhood infections with RSV (i.e. enough to warrant hospitalization) are thought to be linked to the subsequent development of childhood asthma, as well as its exacerbation [Reference Mailaparambil, Grychtol and Heinzmann31]. In our study it was found that asthma admission was positively correlated to influenza B infection and that it decreased with maximum temperature and increased with duration of sunshine. These results may appear to be paradoxical because in more temperate climates it has been reported that asthma attacks tend to increase in the colder months which have fewer hours of sunshine [Reference Chen, Xirasagar and Lin19, Reference Xirasagar, Lin and Liu20]. Despite the specific, significant correlation with influenza B (as opposed to the much more prevalent influenza A), many other non-viral and non-meteorological factors may influence asthma attacks, such as animal allergens (e.g. from rodents, cats, dogs, insects) [Reference Amr32], air pollution (which may account for summer asthma spikes) [Reference Chen, Xirasagar and Lin19], and increased emotional stress (e.g. at the start of a new school year) [Reference Scheuerman33]. Therefore, any correlation between those asthma admissions related to any specific respiratory virus infection may be easily hidden in the, possibly far greater number of admissions for asthma exacerbations triggered by these other non-viral factors. Moreover, the significant correlations with the meteorological parameters may actually reflect the influence of factors that vary with such climate factors, e.g. air pollution, timing of the new school year and the behaviour of animals.
Interestingly, neither acute gastroenteritis nor UTI-related admissions were found to be significantly correlated with the any of the meteorological parameters. However, previous studies of rotavirus infection (one of the commonest causes of infectious gastroenteritis in children) have demonstrated a correlation with colder months in winter/early spring in more temperate countries [Reference D'Souza, Hall and Becker34]. This is less well-defined in more subtropical/tropical countries [Reference Ansari, Springthorpe and Sattar35, Reference Li, Chan and Tang36], although some studies from such regions show some comparatively inconsistent relationships with climate parameters [Reference Levy, Hubbard and Eisenberg37]. For noroviruses, which are a more common gastroenteritis pathogen in adults, again the peak incidence is usually in the winter months (hence the traditional name ‘winter-vomiting disease’) [Reference Mounts38], although some recent studies have also shown a summer peak for this virus infection [Reference Lopman39]. Given all of this, further studies of gastroenteritis infections with climate parameters are certainly warranted in this tropical paediatric population.
It is interesting that in this study of clinical respiratory illness, laboratory-confirmed respiratory virus incidence and climate data in a tropical setting, the correlations found can be explained with the current existing knowledge about airborne virus survival [Reference Tang5, Reference Tellier6, Reference Hemmes, Winkler and Kool24–Reference Tellier28]. In contrast, a recent study from subtropical Hong Kong found contradictory correlations between their laboratory-confirmed respiratory virus incidence data and their meteorological parameters, i.e. an increasing incidence of lipid-enveloped respiratory viruses (like influenza) in the hotter more humid summer months, when airborne virus survival should be decreased. One possible explanation suggested for this was that in these hotter, humid months, indoor transmission in air-conditioned environments accounted for most of the transmission [Reference Tang4]. More studies may further improve the understanding of these complex relationships between clinical, laboratory and meteorological variables in such subtropical and tropical environments.
In summary, this study correlates three parallel sets of data in a tropical paediatric population: clinical illness, laboratory-confirmed respiratory virus incidence, and contemporary meteorological parameters. The correlations found were understandable with the current knowledge of these clinical diseases and virus biology, but additional investigations are required to confirm and augment these findings, especially with regard to the detection and correlation with the more prevalent common cold viruses (e.g. rhinoviruses and coronaviruses), which are not routinely tested for in most hospital diagnostic laboratories.
ACKNOWLEDGEMENTS
This study was supported by the KKH Research Centre (research grant no. RAU/2008/148). The authors thank Ms. Thiviya for extracting the clinical data, Ms. Goh Mei Fang for assisting the administrative process and the laboratory staff for performing the tests.
DECLARATION OF INTEREST
None.


