


5.1 Introduction
The ground shaking that an earthquake produces is the result of a complex sequence of events that occur at a fault. This sequence of events is often given a narrative account by seismologists. Here is an example of such an account of the 2011 Tohoku-Oki earthquake. This is the massive earthquake that gave rise to the tsunami that devastated the north-east coast of Japan and caused the nuclear disaster at Fukushima.
On 2011 March 11, rupture of a frictionally locked region in the central portion of the 220 km wide megathrust fault commenced innocuously, with a magnitude 4.9 earthquake, but the rupture failed to arrest, continuing to expand for 150 s, spreading over the full width of the boundary and along its length for 400 km. The rupture expanded relatively slowly in the up-dip direction, with fault slip of ~30 m near the hypocenter, spanning a region that had not failed since a great event in 869 CE, increasing to about 50 m or more near the trench. The rupture expanded more rapidly and erratically down-dip to below the Honshu coast with slip of 1–5 m extending southward along the Miyagi, Fukushima and Ibaraki Prefectures. Multiple source regions of large earthquakes of the last century re-ruptured sequentially, with short-period seismic waves released by this down-dip rupture being enhanced relative to the up-dip rupture.
The events that are recounted here (e.g., the rupture ‘expanded relatively slowly in the up-dip direction, with fault-slip of ~30 m’, and later ‘expanded more rapidly and erratically down-dip to below the Honshu coast with slip of 1–5 m’) took place along a fault, deep within the earth. I will refer to the sequence of events at the fault, which played out over several minutes in the case of the Tohoku earthquake, as the rupture process. For each earthquake that occurs, there is a particular way in which these events play out – each earthquake has a unique rupture process. Knowing these rupture processes in detail would yield precious information about the faults on which they occur and their history, which can be used to make better determinations of seismic hazard.
The rupture process of an earthquake cannot be observed directly, since it takes place deep within the earth, but its effects can be observed at the earth’s surface. The rupturing of a fault generates seismic waves that travel outwards in all directions from the fault. These seismic waves can be recorded on seismographs at the earth’s surface. An earthquake can also result in permanent ground motion at the earth’s surface, which can be recorded using GPS technology. Data on other effects of an earthquake, such as tsunamis, can also be recorded.
Reconstructing the rupture process of an earthquake from this recorded data is a particularly difficult problem, for several reasons. First, rupture processes are very complex, and highly contingent.Footnote 1 The way a rupture process unfolds is highly dependent on contingent features of the fault. Second, as I have already mentioned, seismologists generally do not have direct access to faults. This means that the contingent features of the fault are typically not known prior to the earthquake. Third, the data recorded from a major earthquake such as the Tohoku earthquake can come from observations of a number of different phenomena, such as seismic waves, permanent ground motion and tsunamis. This diverse data must be integrated in some manageable and principled way. In short, seismic reconstruction involves inferring from a wide variety of downstream effects a complex, highly contingent process that occurs on a fault that is not directly accessible .
An important tool for seismic reconstruction, slip inversion, produces models (called source models) that capture the rupture process . As we will see, a source model provides a narrative about a possible way the rupture process may have occurred. This narrative cannot, however, be straightforwardly regarded as an accurate account of the events at the fault as they actually occurred. When a large number of different source models of the same earthquake are generated, they will generally conflict with each other, due to differences in the sets of data they utilize, the specific mathematical techniques used and the assumptions that go into these models. A problem that seismologists have faced when attempting to reconstruct the Tohoku and other earthquakes, then, is how to take such conflicting models and reconstruct the actual rupture process.
This chapter examines how seismologists have obtained increasingly detailed knowledge about the rupture process of the Tohoku earthquake in the face of this problem. I will give an account of the growth of this knowledge that is slightly unorthodox, but it exemplifies how thinking about narrative might help us to understand the growth of scientific knowledge.Footnote 2 I will focus in particular on three stages on the path from recorded data to increasingly detailed knowledge about the rupture process, and the role of narrative in each of those steps.
Here is an initial sketch of these three stages.Footnote 3 In the first stage, source models are used to produce, from recorded data, narratives that recount the rupture process in detail, which I call rupture narratives. As I have mentioned, these narratives generally conflict with each other due to differences in the data, techniques and assumptions that go into the source models. In the second stage, a set of details that is taken accurately to represent features of the actual rupture process is distilled out of these conflicting rupture narratives. This set of details is arrived at through the use of a research narrative that examines the evolution of source models. In the third stage, these distilled details are strung together into a model-independent rupture narrative, which I call an integrating narrative. This integrating narrative is used as a research tool for formulating questions, the pursuit of which has led to the production of further evidence about the rupture process.Footnote 4
This chapter will proceed as follows. In section 5.2, I will lay down some basics about how earthquakes occur, the rupture process of an earthquake and the Tohoku fault. In section 5.3, I examine the construction of source models from data and present an example of a rupture narrative. In section 5.4, I show how details are distilled from source models through the use of a research narrative. In section 5.5, I present an example of an integrating narrative, and show how the pursuit of questions about this narrative results in further evidence about the rupture process. In the concluding section 5.6, I briefly consider the functions of the three types of narratives just mentioned in the growth of knowledge about the rupture process of the Tohoku earthquake.
5.2 Earthquakes and the Tohoku Fault
Most earthquakes are generated at a fault, which may be thought of as a roughly planar surface within the earth where the ground on the two sides of the surface are slowly being pulled in opposite directions. A well-known example is the San Andreas fault, the two sides of which are moving a few centimetres a year relative to each other. If a fault were completely smooth and frictionless, the two sides would simply move very slowly past each other, and we would have no earthquakes. But faults are not frictionless. The two sides are rough, and there are portions, called asperities, where the two sides are locked together.
What happens when the forces on each side of the fault continue to act in opposite directions, while the two sides are locked together? Because rock is elastic, the rock around the fault will slowly bend due to the imposed forces, and it will store up elastic strain energy, much like a wooden ruler would store up elastic energy if you slowly flexed it. Points far away from the fault will tend to move slowly relative to each other, while the fault remains locked together. This will result in strain slowly accumulating in the material surrounding the fault as it gets pushed further and further out of equilibrium. The strain will continue to build until it is sufficient to overcome the friction that keeps the sides locked together. The two sides of the fault will then rupture, suddenly snapping back towards a position of equilibrium. The pent-up elastic energy is released, generating seismic waves.
The largest earthquakes occur on faults that can be hundreds of kilometres long. Several features of large earthquakes are particularly important for understanding this chapter. First, large faults do not rupture along their entire length all at once. The rupture initiates at a particular point on the fault. This rupture will then propagate to other parts of the fault. If the fault is hundreds of kilometres long, the rupture can take several minutes to propagate the entire length of the fault. This series of events at the fault is called the rupture process. Second, the state of friction on a large fault is generally heterogeneous. That is, there can be patches of the fault that are strongly stuck together (the asperities), while there can be other patches that are only weakly coupled. The patches that are weakly coupled rupture easily, while the asperities are resistant to rupture. When the asperities do rupture, however, they typically have built up a lot of elastic energy, so they tend to rupture much more forcefully than the weak patches. Thus, the particular way the rupture propagates will depend on contingent features such as the state of friction at various points of the fault. These features are typically not directly accessible to seismologists, since the fault is buried deep within the earth.
I will now move to specific details about the Tohoku earthquake and the fault on which it occurred. The Tohoku earthquake occurred on a subduction zone off the north-east coast of Japan. There, tectonic forces are driving the Pacific plate underneath Japan and into the mantle, at a rate of roughly 8 centimetres per year. Figure 5.1 is a cutaway diagram showing the subduction zone, as viewed facing roughly northward. Northern Japan sits on top of the Okhotsk plate, towards the left side of the diagram. The fault on which the earthquake occurred is on the border between the Pacific and the Okhotsk plate. In the cutaway view, the fault is represented as a line at 12 degrees to the horizontal, with arrows indicating the relative motion of the two sides of the fault. The direction along the fault, at 12 degrees to the horizontal, is called the dip direction. In actuality, the dip angle of the fault is not known so accurately, and it may vary by a few degrees. Because the fault slopes downwards to the west, the western part of the fault that eventually goes underneath Japan is referred to as the down-dip part of the fault, while the eastern, up-dip part eventually reaches the ocean bottom at the Japan Trench, an extremely deep area of the Pacific Ocean off the coast of Japan.
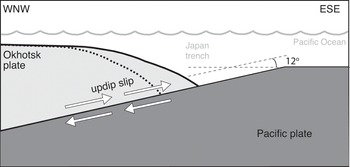
Figure 5.1 Cutaway view of Tohoku fault
Now it is fairly easy to visualize how large earthquakes occur on this fault. The Pacific plate is slowly getting pushed under the Okhotsk plate, but there are places where the two sides are locked together. The strain accumulates until it is enough to overcome the friction, and the two surfaces at the fault suddenly unlock. The upper surface jolts eastward and upward, releasing elastic energy in the form of seismic waves. The Tohoku earthquake ruptured an area of around 200 kilometres by 500 kilometres, and the entire rupture process took around 150 seconds. This motion also gave rise to a powerful tsunami that inundated the north-east coast of Japan. A detailed understanding of the rupture process, its connection to past and possible future earthquakes in the area, and the way in which it generated the tsunami, is of obvious importance for seismology, as well as the determination of seismic hazard along the coast of Japan.
The Tohoku earthquake was recorded on an unprecedented variety of instruments. Broadly, the data that were recorded for this earthquake can be categorized by the kind of phenomenon that was recorded. Seismic data are recordings of seismic waves. Strong motion seismic data is recorded at stations nearby an earthquake. These kind of data are recorded on several networks of different types of seismographs throughout Japan, including KiK-net, a network of over 600 strong-motion seismographs that are situated in boreholes; and K-NET, a network of over 1,000 strong-motion seismographs at the surface. Geodetic data are recordings of the deformation of the earth’s surface. Such data are typically recorded using GPS technology. Most of the geodetic data for the Tohoku earthquake was recorded on a network of over 1,200 GPS stations distributed throughout Japan, called GEONET. Tsunami data are recordings of the tsunami caused by the earthquake. This type of data was typically recorded by offshore wave and tide gauges. These three categories do not exhaust all the types of data that were recorded for this earthquake. In addition, there were important data recorded of the motion of the ocean bottom at seafloor geodetic sites, data from deep drilling into the fault zone after the earthquake and even gravimetric data recorded by satellites.
5.3 Rupture Narratives: From Data to Details
The data collected from the Tohoku earthquake are rich and diverse, but they consist of recordings of the downstream effects of the earthquake, such as ground motions that occurred far away from the fault. Such data do not immediately reveal any details about the rupture process. An initial step towards a reconstruction of the rupture process is the use of source models,Footnote 5 which, as we will see, take this downstream data and provide a detailed account – albeit an unreliable one – of the rupture process.
Most source models for the Tohoku earthquake have been constructed using a method called slip inversion.Footnote 6 A good example can be seen in Figure 5.2, taken from Reference Suzuki, Aoi, Sekiguchi and KunugiSuzuki et al. (2011). This is an early source model that was produced entirely from seismic data recorded at 36 stations located throughout northern Japan.Footnote 7 Let us first examine the large figure on the right. An outline of the northern part of the Japanese island of Honshu can be seen towards the left. Just off the coast is a rectangle, which has a length of 510 km and a width of 210 km, oriented at a small angle in the north–south direction. This rectangle is a representation of the fault. We are here viewing the fault from directly above (in contrast to Figure 5.1, which is a cutaway view). The dip of the fault cannot be seen in this view, but in this model the dip angle was set at 13 degrees to the horizontal.

Slip is a measure of how much the two sides of a fault moved relative to each other during an earthquake. The contours and shading on the figure to the right are an indication of how much various parts of the fault slipped over the course of the Tohoku earthquake. The darker the shading, the more slip occurred. According to this source model, there was an area of very large slip of around 48 m near the Japan Trench (towards the right edge of the fault). The series of 16 small figures on the left are miniature versions of the figure to the right. Each of these small figures represents the amount of slip on the fault in each ten-second slice of time from the beginning of the earthquake to the end (reading from top left to right, and then bottom left to right). As I described earlier, when an earthquake occurs, various parts of the fault rupture in succession. We can think of these as a series of snapshots of this rupture process as it propagates. If we allow for a wide definition of ‘narrative’ that includes visual objects such as diagrams,Footnote 8 we can view this series as a visual narrative of the rupture process, indicating spatial changes of the fault over time during the Tohoku earthquake.
Source model studies also provide more straightforward textual narratives of the rupture process, along with such diagrams. For example, Reference Suzuki, Aoi, Sekiguchi and KunugiSuzuki et al. (2011) provides the following:
The total moment rate indicates that first remarkable moment release started 20 s after the initial break, when the rupture occurred around the hypocenter. Then, at approximately 40 s, the rupture proceeded northward along the trench axis and towards the down‐dip direction. Somewhat later, the rupture also extends southward along the trench axis. The largest slip event occurred from 60 s to 100 s, with the rupture expanding towards the down‐dip direction from the area along the trench axis. In this stage, large slip occurred continuously far offshore of southern Iwate, Miyagi, and northern Fukushima prefectures. The last stage starts at around 100 s, where the rupture propagated southward in the area off Fukushima and Ibaraki prefectures. The entire rupture almost ceased within 150 s.
We can view slip inversion as taking seismic or other data as input, and outputting what I call rupture narratives, which are visual and textual narratives of a rupture process that includes quantitative details. Such details can include temporal details such as the timing of various sub-events within the rupture process. They can also include details about the rupture process as a whole, such as the total amount of slip that occurred at a particular part of the fault. Borrowing a term from Robert Meunier (Chapter 12), the rupture narratives produced by source models present themselves as ‘narratives of nature’ – narratives that recount a process as occurring in nature, independently of any human observers. As we will see, however, they are highly model-dependent – that is, many of the details within these narratives are artefacts of the data, techniques and assumptions that go into the source models.
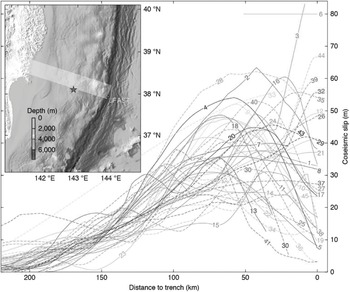
An indication of this model-dependence is a wide variability among rupture narratives produced by source models of the Tohoku earthquake. Figure 5.3 is a comparison of 45 different source models of the Tohoku earthquake. Each of the lines represents the amount of total slip indicated by each source model. For ease of comparison, only the amount of slip along the corridor off the north-east coast of Japan indicated in the inset map is shown, extending from just underneath the coast to the Japan Trench. There is particularly wide variability in the up-dip regions, near the trench. Some models show slip of 50 m or more here, while other models indicate slip of 10 m or less.
How could there be such discordance between rupture narratives produced by various source models of the same earthquake? Broadly, there are two reasons. The first has to do with differences in the type of input data. I have mentioned that the data that were recorded for the Tohoku earthquake can be categorized into seismic data, geodetic data and tsunami data. Source models have been constructed using all of these types of data. Different types of data are sensitive to different features of the rupture, and thus models that rely on different types of data tend to emphasize different features. The second reason has to do with differences in the methods used to construct source models. This can include differences in the parameterizations used, differences in the idealizations and assumptions that go into the models, and differences in the mathematical and computational techniques that are used.
5.4 Research Narratives: Distilling Details from Source Models
The first source models of the Tohoku earthquake were produced and published in 2011, within months after the earthquake. A large number of source models of the earthquake have been produced since then – by 2017 there were at least 45 of them (Reference Sun, Wang, Fujiwara, Kodaira and HeSun et al. 2017). From the start, there have been pronounced discordances between various source models of the earthquake. An important question for the reconstruction of the rupture process of the Tohoku earthquake has thus been: exactly what is one to conclude about the actual rupture process given the discordance between the source models? Is there a way of distilling out from these conflicting source models some set of rupture details that can be regarded as accurately representing the actual rupture process? One reasonable thought is that later source models are generally more accurate than earlier ones, since they presumably have more knowledge about the earthquake to draw upon. A more rigorous approach would examine in detail the evolution of source models since 2011 to determine whether indeed later models improve on earlier ones. This is the approach taken in Reference LayLay (2018), a review article of the Tohoku earthquake. Reference LayLay (2018) contains a very long and complex narrative that traces out the evolution of source models, with the aim of distilling out rupture details to which some degree of confidence can be attached. Borrowing again from Robert Meunier (Chapter 12), this is a research narrative – a narrative that provides an account of the activities of researchers.
Let us now take a closer look at the research narrative in Reference LayLay (2018). The general thrust of the narrative is to show how source models of the Tohoku earthquake have gone through an evolution, the result of which is that details in certain later source models have claim to being relatively accurate representations of details of the actual rupture process. For example, in a section of the narrative, Lay examines early source models based purely on geodetic observations made at onshore GPS sites. He notes that such source models ‘can provide good resolution of the spatial distribution of slip if the observation configuration is favorable’ (Reference LayLay 2018: 11). Unfortunately, it turns out that the observation configuration for the Tohoku earthquake is unfavourable – all of the GPS sites are on the Japanese mainland, which is on the down-dip side of the fault. This means that source models based purely on onshore geodetic data have poor sensitivity to slip that happens on the up-dip side of the fault, near the Japan Trench. This is significant, for, as Lay points out, although source models based purely on onshore geodetic data are largely consistent with each other, they are inconsistent with source models based purely on seismic data. Source models based purely on seismic data tend to show the largest slip happening up-dip, near the Japan Trench, as with the source model depicted in Figure 5.2, while source models based purely on onshore geodetic data tend to put the largest slip near the hypocentre, more towards the centre of the fault. One might surmise that the reason for this inconsistency is the unfavourable observation configuration for source models based on onshore geodetic data.
Recognizing this as a limitation, seismologists have attempted to address this problem in later source models utilizing onshore geodetic data by incorporating other types of data that are complementary to onshore geodetic data. Particularly important is a set of geodetic data taken by GPS/Acoustic stations located offshore, on the ocean bottom, which, according to Lay, has ‘proved transformative for geodetic models of the 2011 Tohoku earthquake slip distribution’ (Reference LayLay 2018: 12). Another important kind of additional data is time series data taken at GPS stations, called hr-GPS. Regarding the evolution of source models based on geodetic data, Lay states:
[T]here has been significant evolution of slip models inferred from geodesy, from the long smooth models with ~30 m peak slip near the hypocenter […] to much more spatially concentrated and up-dip slip models with peak slip of 50 to 60 m at shallow depth when using hr-GPS time series […] or from inclusion of up to 7 offshore GPS/Acoustic measurements in static inversions.
Significantly, these later source models are much more consistent with source models based on seismic data (note, for example, that the source model depicted in Figure 5.2 has a peak slip of 48 m in the up-dip, shallow part of the fault). In other words, the rupture narratives of these later source models look much more like the rupture narratives of source models based on seismic data.
Lay does similar analyses of the evolution of models based on other types of data, showing how later models have improved upon earlier models. Not only are the rupture narratives of later models more consistent with each other, but they are getting more detailed. He takes later source models that incorporate multiple types of data – called joint inversions – to be the most reliable. One reason is because data of different types can be complementary – they are sensitive to different aspects of the rupture process. Another reason is because the later source models generally address the shortcomings of earlier models. Lay summarizes the evolution of source models as follows:
The foregoing review of rupture models for the 2011 Tohoku earthquake shows progressive convergence of slip models, with slip being increasingly localized along strike and concentrated up-dip, extending all the way to the trench with slip ~50 m near 38.2°N. Over time the rupture models have progressed from quite smooth representations to more detailed slip distributions, especially for the geodetic and tsunami models. […] Some of the differences among current models may represent the different parameterizations, but the similarity of the majority of joint inversion models […] suggests that different parameterizations are at least not overwhelming the source information.
We can think of the research narrative provided by Lay about the evolution of source models as providing a justification that the details that appear in the rupture narratives of the later models are relatively accurate. Greater confidence is placed on the later joint inversion models, but no one model is taken to be best, and the amount of confidence one can place in a particular detail is ultimately based on a judgement that takes into account the commonalities between particular source models, limitations due to the datasets and methods of construction and the overall evolution of source models.
5.5 Integrating Narratives: Pursuing Further Evidence
Typically, in review articles, the details that are distilled from source models are strung together into a new rupture narrative that is independent of any particular model. This is a ‘narrative of nature’ – one that is taken to represent the best current estimate of the actual rupture process. There is such a narrative in Reference LayLay (2018), which he calls a ‘strawman reference model that distills the features that appear most stable and/or plausible’ (Reference LayLay 2018: 29). Although Lay calls it a model, it is not a model in the sense of the source models discussed earlier – it comes in the form of a textual narrative. As source models have evolved from the early source models based on single data sets to more detailed source models based on joint inversions, the details that were taken to be established about the Tohoku earthquake have also evolved. Thus, the model-independent rupture narratives that would be constructed by seismologists at any given time after the Tohoku earthquake would also evolve.Footnote 9 I will refer to rupture narratives of this type as integrating narratives because they are used as tools for integrating details of the rupture process with other seismological results.
In this section, I will show that integrating narratives play an important role in the production of new evidence about the rupture process of the Tohoku earthquake. First, let me provide, as an example, the ‘strawman reference model’Footnote 10 of Reference LayLay (2018):
In terms of the primary slip zone, the joint models including tsunami information […] provide good characterization of the rupture, with ~50 m of slip near or at the trench about 38° to 38.3°N. Shallow slip in the upper 10 km of the megathrust (from 8 to 15 km below the ocean floor) extends along strike from at least 37°N to 39.5°N, diminishing north and south of the central peak, which is near the site of the JFAST [Japan Trench Fast Drilling Project] drill hole. This is the Domain A zone of tsunami earthquake-like behavior discussed by [T. Lay, H. Kanamori, C. J. Ammon et al. ‘Depth-Varying Rupture Properties of Subduction Zone Megathrust Faults’, Journal of Geophysical Research 117(B04311): 1–21]. From 10 to 35 km depth, the large-slip region, with > 20 m of slip narrows to about ~150 km along strike, with the hypocenter within this zone, in what is called Domain B. Modest slip of 5 to 10 m is spread along strike, with down-dip Domain C concentrations of < 5 m offshore of Miyagi and offshore of Fukushima. These regions of prior M ~7.5 events during the past century appear to have re-ruptured with more high frequency radiation than the shallower regions.
This is just the beginning of the first paragraph of the narrative. The thing to note about this narrative is that it does not just string together well-established details from rupture narratives. It also makes reference to ‘domains’ of the rupture process, the ‘JFAST drill hole’, and past earthquakes.Footnote 11 The later parts of this narrative, not shown here, continue on to discuss studies of afterslip (ground motions that occurred after the earthquake), seafloor deformation observations and specific earthquakes of the past. Integrating narratives can also highlight loose ends and open questions. Let me note again that this integrating narrative is from a comparatively late stage of analysis of the Tohoku earthquake. Earlier integrating narratives tend to be less detailed, they draw fewer connections to other studies and their references to past earthquakes are framed in a more speculative mode.Footnote 12
Integrating narratives have provided a sort of frameworkFootnote 13 upon which certain questions about the Tohoku earthquake could be pursued. Some questions have to do with the connection between the rupture process of the Tohoku earthquake and its spatial and temporal context. More specifically, these questions can be about connections to past earthquakes, to seismic events immediately preceding the Tohoku earthquake, seismic events that came after it, and various features of the subduction zone on which it occurred, such as the locations of asperities, the distribution of accumulated strain, the composition of the rock in the subduction zone, and so on. Other questions have to do with anomalies or inconsistencies in the rupture process as laid out in the narrative. The pursuit of such questions has been a driving force for uncovering further evidence about the earthquake.
For example, a major open question has to do with the frequency characteristics of the rupture process. Just a few years before the Tohoku earthquake, a new technique for producing source models from seismic data, called back-projection, had been developed (Reference Kiser and IshiiKiser and Ishii 2017). Back-projection is sensitive to high-frequency seismic waves, and the source model it produces is a kinematic image, not of slip, but of seismic radiation energy release over time. Since most of the energy being radiated at any given time during an earthquake originates from the rupture front, the back-projection image can be taken to show a kinematic image of the rupture front during the earthquake. Early back-projection studies of the Tohoku earthquake were systematically discordant with early slip inversion studies. The back-projection studies indicated that most of the seismic radiation was concentrated in the down-dip part of the fault. On the other hand, slip inversion studies indicated that the maximum slip was in the up-dip part of the fault, and the area of very large slip possibly extended all the way to the trench (Reference Lay, Ammon, Kanamori, Xue and KimLay et al. 2011: 687). An early question about the rupture process was thus: why does back-projection appear to show that rupture occurred mainly down-dip, while slip inversion appears to show that the area of maximum slip was up-dip and close to the trench?
A possible answer is that different parts of the fault produced seismic radiation at different frequencies – the down-dip part producing more high-frequency radiation than the up-dip part. If this answer is right, then it gives rise to another question: is the difference in the frequency characteristics in different parts of the fault just a special feature of this particular earthquake, or is it a feature of the fault – in which case it ought to hold for other earthquakes as well? Reference Koper, Hutko, Lay, Ammon and KanamoriKoper et al. (2011: 602) suggested that the latter is the case – that the difference is due to depth-varying frictional properties of the fault.
The idea fits with the known history of the fault. The down-dip region corresponds to an area where large earthquakes of up to Mw 7.9 had repeatedly occurred over the past century, and these earthquakes would have had similar frequency characteristics as the down-dip part of the Tohoku earthquake. The up-dip region corresponds to an area that had not ruptured since 869 ce, but it also partially overlapped an area that is taken to have ruptured in 1896 during what is known as a ‘tsunami earthquake’. Tsunami earthquakes have characteristics like those exhibited by this part of the fault during the Tohoku earthquake – with large slip but slow rupture velocities, leading to relatively more seismic energy being radiated at lower frequencies.
In this view, then, each part of the fault has its own rupture characteristics that are constant across earthquakes (these are roughly the ‘domains’ that Lay refers to in the extract above). The unusual feature of the Tohoku earthquake was that it ruptured both regions at the same time, so it combined the characteristics of both types of earthquakes. Given this view, the next question to ask would then be why there are regions with different rupture characteristics within the fault – does it have to do, for example, with the composition of materials in different areas of the fault? This has been probed by the use of seismic wave tomography (Reference Tajima, Mori and KennettTajima, Mori and Kennett 2013: 27) and studies (such as JFAST) where holes are drilled directly into the sea floor in the fault area (Reference LayLay 2018: 28).
The pursuit of questions such as these has improved the picture of how the Tohoku earthquake fits into its spatial and temporal context – whether it is, in some sense, a repeat of particular earthquakes in the past, for example. It has also opened up new lines of research that have contributed new evidence about the Tohoku earthquake. In some cases, this new information has been utilized to improve source models – thus contributing to the evolution of source models, and indirectly to the evolution of the integrating narratives themselves. Thus, there is a sort of mutual evolution of source models and integrating narratives, resulting in a more highly resolved, and more ramified, picture of the rupture process of the Tohoku earthquake. That Lay refers to the most recent version of an integrating narrative as a ‘strawman reference model’ is an indication that this is very much an ongoing process.
5.6 Conclusion
In this chapter, I have examined the growth of knowledge about the rupture process of the Tohoku earthquake, with a focus on the role of narrative. I have described three kinds of narratives in this chapter: rupture narratives, research narratives and integrating narratives. I would like to end with some considerations about the functions of these narratives in contributing to the growth of knowledge about the Tohoku earthquake.
5.6.1 Narratives as Filters
Let me begin with rupture narratives. It is not entirely correct to say that source model narratives are the outputs of source models, for the direct outputs of source models are simply large sets of parameters. But these sets of parameters must be put into a cognitively useful form: the textual and visual narratives that I call source model narratives. These narratives are the result of filtering out some of the needless complexity in source models. They allow seismologists to focus in on significant details. They also allow seismologists to readily make comparisons between source models in order to look for commonalities and differences. Side-by-side comparisons of visual representations are particularly powerful – Reference LayLay (2018) contains page after page of diagrams where a half-dozen source models are compared side by side.
5.6.2 Narratives as Arguments
The research narrative provided a justification for distilling certain details from source models. Rupture narratives formed an important ingredient for the research narrative, because the latter required a comparison between source models, and analyses of the assumptions and methods that were used in their production. Another important element of the research narrative given in Reference LayLay (2018) was a story about the evolution of source models that attempted to make a case that later source models are more accurate. The research narrative pulled together and organized these elements into a prolonged argument that certain details in the source models can be pulled out and regarded as well established, independently of any particular source model.
5.6.3 Narratives as Unifying Instruments
Integrating narratives of the Tohoku earthquake have strung together well-established details that are distilled from source models, with the help of research narratives. They locate the rupture process within a spatial and temporal context, and they provide a framework for the pursuit of further questions that may open up new lines of research into the Tohoku earthquake and other past and future earthquakes. We might regard integrating narratives as instruments for unification – bridging various empirical avenues and strengthening connections between them, perhaps with the aim of achieving Whewellian consilience.
Thus, the three types of narratives I have considered, all, in different ways, have made contributions to the growth of knowledge about the Tohoku earthquake. The fact that several different kinds of narratives are utilized by seismologists is perhaps not that surprising. The work that narratives do in enabling the growth of knowledge in seismology and other physical sciences, however, still needs to be better understood.Footnote 14


 Open access