


1. Introduction
Sea ice is a strong thermal insulator and mechanical lid between the atmosphere and ocean, and hence reduces the air-sea exchange of heat, water vapor, and momentum. Sea ice and, in particular, the snow pack on the top of it strongly reflect incoming solar radiation. Hence, reductions in the coverage of sea ice and snow generate the albedo feedback effects, which influence both the regional and global climate systems (Aagaard and Carmack, Reference Aagaard and Carmack1989; Vavrus and Harrison, Reference Vavrus and Harrison2003; Serreze and others, Reference Serreze2003; Liu and others, Reference Liu, Curry and Hu2004; Laine, Reference Laine2004; Haumann and others, Reference Haumann, Notz and Schmidt2014). The surface albedo controls the amount of solar radiation absorbed by the ocean: in the case of open water, albedo is <0.1, but it exceeds 0.85 when the surface is snow covered and most of the solar radiation is reflected (Curry and others, Reference Curry, Schramm, Perovich and Pinto2001; Massom and others, Reference Massom2001; Shao and Ke, Reference Shao and Ke2015). During the austral summer, in Southern Ocean, the net solar radiation in the open water reaches as high as 100–150 W m−2 while it is only some tens of W m−2 at the sea-ice surface because of the high surface albedo (Nihashi and Ohshima, Reference Nihashi and Ohshima2001).
Sea-ice albedo is affected by many factors, such as sea-ice types, snow/ice thickness, melt ponds, sastrugi, snowfall and cloud cover. The Antarctic sea ice is typically seasonal, and mostly covered by snow. Hence, it has a higher albedo than the bare ice (Nihashi and Ohshima, Reference Nihashi and Ohshima2001; Brandt and others, Reference Brandt, Warren, Worby and Grenfell2005). Snowfall and drifting snow cause large spatial and temporal changes in the surface albedo (Laine, Reference Laine2008). The ice albedo can increase from 0.54 to 0.89 after the occurrence of snowfall (Pirazzini, Reference Pirazzini2004), and snow thickness is an important factor influencing Antarctic landfast sea-ice albedo (Yang and others, Reference Yang2016). The albedo of snow and ice is also strongly influenced by the solar elevation angle, and has significant daily cycles under clear skies (Pirazzini, Reference Pirazzini2004). For sea ice with thickness of the order of centimeters to decimeters, the albedo for visible and UV wavelengths mainly depends on the snow and ice thickness, while the near-infrared albedo is mostly determined by the ratio of air/ice interface area to ice mass, which impact the radiatively effective grain size (Zatko and Warren, Reference Zatko and Warren2015).
Comparing with the Arctic observations (e.g. Perovich and others, Reference Perovich, Grenfell, Light and Hobbs2002; Laine, Reference Laine2004; Pirazzini and others, Reference Pirazzini, Vihma, Granskog and Cheng2006; Perovich and others, Reference Perovich2007; Nicolaus and others, Reference Nicolaus2010a; Lei and others, Reference Lei2012; Perovich and others, Reference Perovich and Polashenski2012; Riihelä and others, Reference Riihelä, Manninen and Laine2013), sea-ice albedo observations in Antarctica are even more sparse (Allison and others, Reference Allison, Brandt and Warren1993; Pirazzini, Reference Pirazzini2004; Brandt and others, Reference Brandt, Warren, Worby and Grenfell2005; Weiss and others, Reference Weiss, King, Lachlancope and Ladkin2012; Yang and others, Reference Yang2016), in particular continuous time series that cover the seasonal evolution and interannual variability (Yu and others, Reference Yu2017). Yang and others (Reference Yang2016) investigated the primary factors influencing Antarctic sea-ice albedo. However, in the absence of spectral albedo measurements, they have not analyzed the impacts of snowfall on the spectral albedo. The measurements of spectral albedo are beneficial to the analyses of snow and sea-ice properties and for understanding different processes in detail (Nicolaus and others, Reference Nicolaus2010a), e.g. snow thickness can increase albedo rapidly when it changes from 0 to 4.5 cm in the visible band (Perovich, Reference Perovich2007). There is also a close relation between the snow/ice optical properties and the associate ecosystem at particular wavelengths, e.g. the wavelength band from 400 to 700 nm (Ehn and others, Reference Ehn, Papakyriakou and Barber2008; Lei and others, Reference Lei2012). Time series of spectral radiation are very sparse due to technical and methodological difficulties (Nicolaus and others, Reference Nicolaus2010a). Therefore, it is very important to perform continuous and long time-series observations over the Antarctic sea ice to seek the spectral partitioning of spectral radiation changes for different surface conditions.
In this paper, in situ measurements of landfast sea-ice spectral albedo near Zhongshan Station in 2016 are described and analyzed. In Section 2, we describe the observation site and measurements. In Sections 3 and 4, we analyze the spectral irradiance and spectral albedo evolutions in two phases and daily time scales. In Section 5, we compare our results with the observations in both Arctic and Antarctica, and a summary is given in Section 6.
2. Observations
The fast-ice observation site is located in the coastal area off Zhongshan Station (69°22′ S, 76°22′ E), Prydz Bay, East Antarctica (Yang and others, Reference Yang2016; Zhao and others, Reference Zhao2019). Prydz Bay is mostly covered by seasonal sea ice. The ice extent reaches its maximum and minimum in September and February, respectively (Lei and others, Reference Lei, Li, Cheng, Zhang and Heil2010). The polar night lasts from the end of March to mid-July, and the polar day from mid-November to January. The spectral albedo was measured continuously over coastal landfast sea ice off Zhongshan Station from 5 October to 26 November 2016. There are several islands off Zhongshan station but the observation site is free from obstructions in all directions, the nearest rocky formation being ~100 m on the east and south, reaching an elevation of ~10 m.
2.1. Meteorological and snow/ice conditions
The meteorological and snow/ice conditions during the measurement campaign are illustrated in Figure 1. The wind speed and cloud cover fraction were recorded at the Zhongshan (WMO No. 89573) manned weather station, located 1 km inland from the sea-ice observation site, at 15 m a.s.l. The 2-m air temperature and surface temperature were measured directly using an Automatic Weather Station located on sea ice at a distance of 100 m from the spectral albedo observation site. The 2-m air temperature was measured with a HMP155A sensor based on the resistive platinum thermometer (Pt 100) and equipped with a radiation shield (DTR 503). The nominal accuracy of this sensor is ±0.1°C. The surface temperature was measured with the SI-111 infrared radiometers with a radiation shield designed to minimize absorbed solar radiation. The nominal accuracy of the radiometer with respect to surface temperature was ±0.5°C. As the thermometer was not artificially ventilated, under calm wind conditions the actual error in temperature is much larger than that inferred from the nominal accuracy of the sensors, and can reach up to several degrees Celsius, as the radiation shields do not prevent the absorption of the solar radiation reflected from the sea-ice surface to the sensors (see e.g. Anderson and Baumgartner, Reference Anderson and Baumgartner1998; Nakamura and Mahrt, Reference Nakamura and Mahrt2005). As it was not possible to identify a convincing method to correct the temperature data, an uncertainty of ±3°C was assigned to all instantaneous values, with the awareness that at low solar elevation angles and under cloudy or windy conditions the uncertainty caused by the lack of artificial ventilation is most probably much smaller. On daily means, the estimated uncertainty is ~±0.5°C (to account for the possible warm bias that cannot be averaged out).
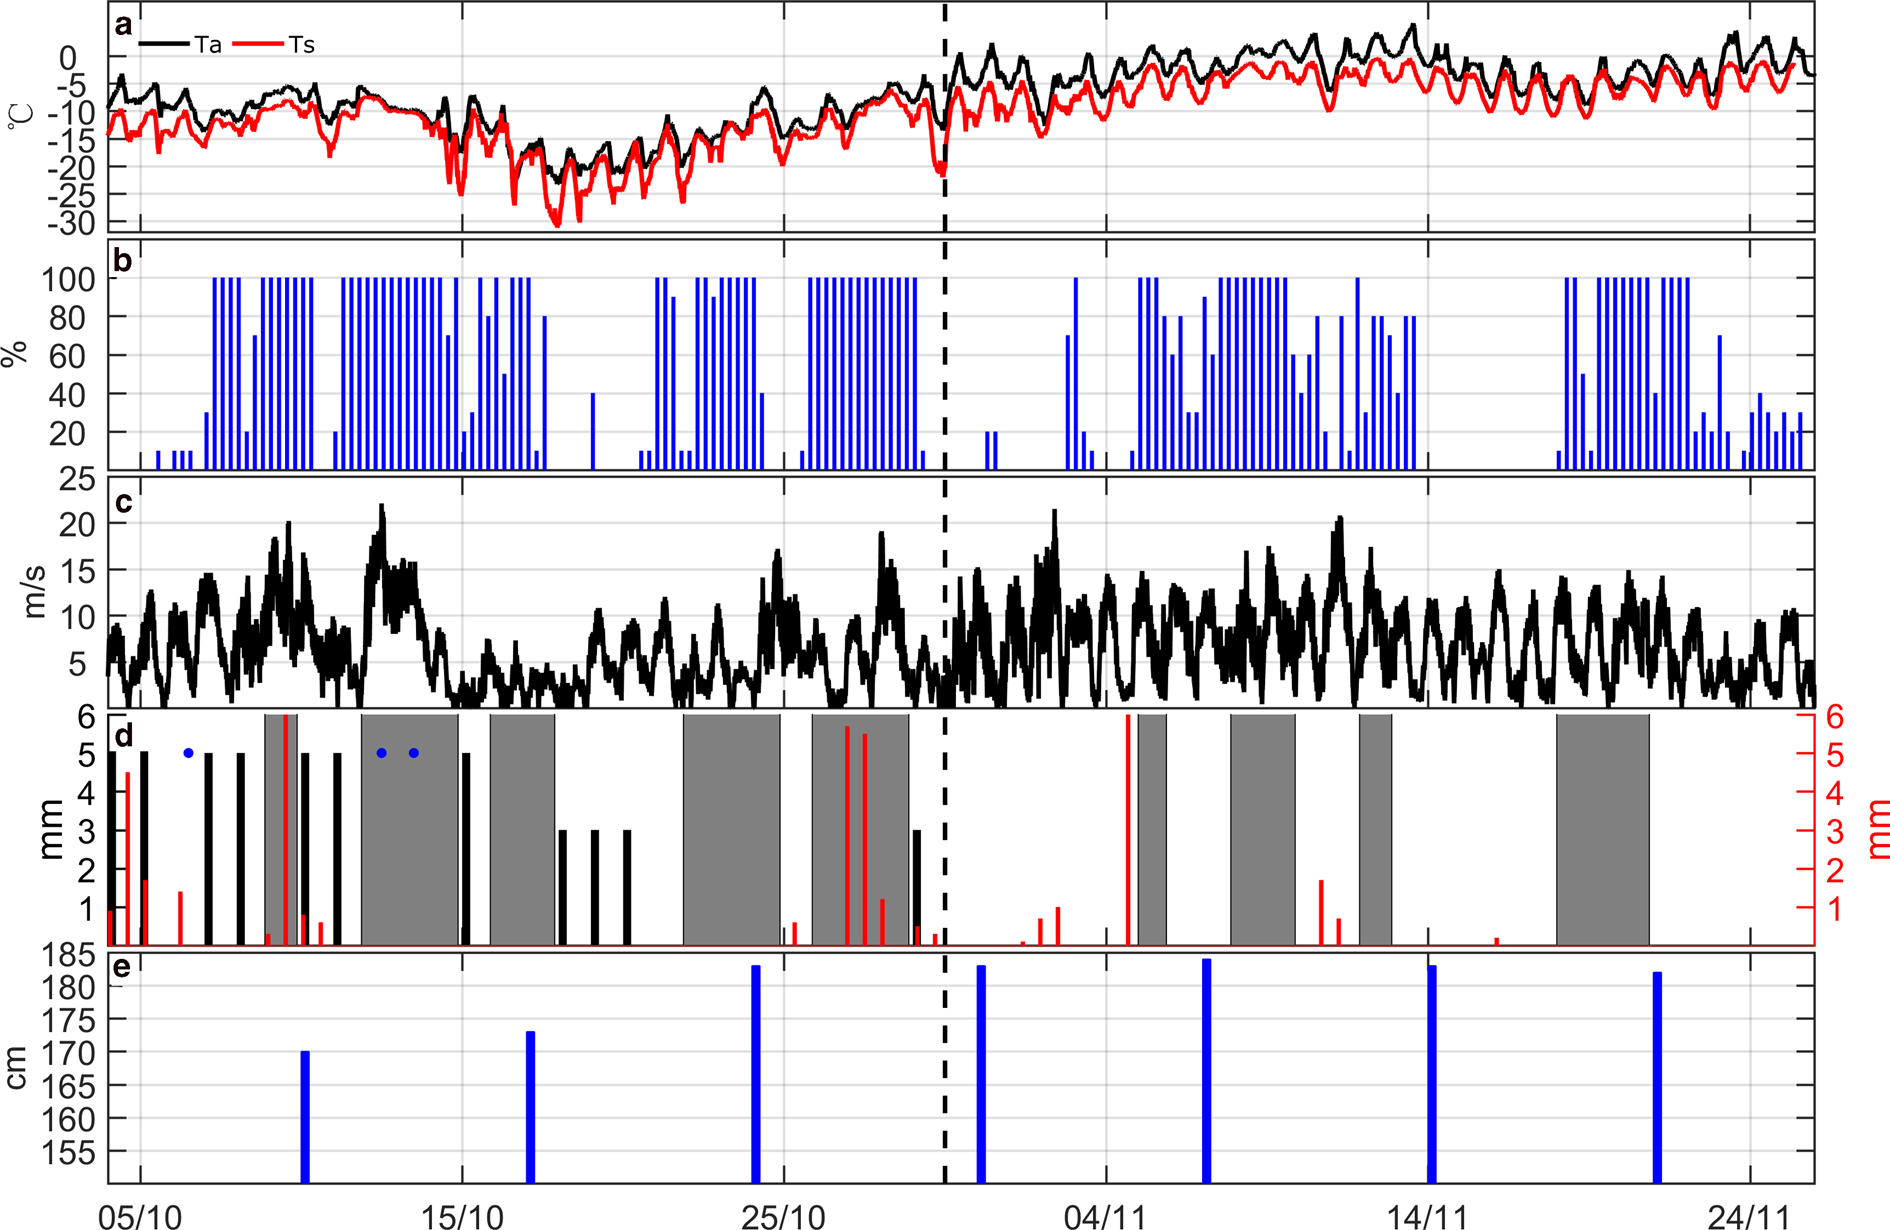
Fig. 1. (a) 2 m air temperature and surface temperature at 1 min intervals, (b) cloud cover fraction observed every 6 h, (c) wind speed at 1 min intervals, (d) daily cumulative snow precipitation (red columns, right scale) and snow depth (black columns, left scale), (e) sea-ice thickness measured approximately once a week. The blue dots mark cases when snow thickness measurements are missing (in all other cases, 0 mm snow thickness is a measured value) and the shaded dark gray represents the snowfall events. The dashed vertical bars (on 30 October) marks the end of the phase with dry snow conditions and the onset of melting conditions.
The solid precipitation was measured every 12 h with a Tretyakov's snow-rain pail, which measured the melted water level with an accuracy of 1 mm of liquid water (~1 cm of snow) at the Russian Progress II station (~1.0 km from the sea-ice observation site) and the values we used were daily accumulation. Although snowfall events were rather frequent, the amount of snow precipitation was very low, and generally precipitation was associated with strong winds that blew the new snow away. Hence, a high spatial variability in snow accumulation was observed in this field, and the surface was mostly covered by patchy snow and sometimes with no snow. The snow depth at the observation site was manually measured by a stainless-steel ruler almost every day with an accuracy of 0.1 cm. As the thickness was measured in almost the same position near the rack, the snow thickness over the mixed surface was sometimes absent.
The ice thickness was measured with an ice auger about every 7 days with an accuracy of ±0.5 cm. Ice thickness measurements were carried out in different places over an area of ~30 m2 around the surface albedo station, hence the data include spatial variations. In the dataset of Lei and others (Reference Lei, Li, Cheng, Zhang and Heil2010), the maximum spatial difference in landfast ice off Zhongshan Station was 10.6 cm.
During the observation period, the lowest 2 m air temperature (T a) and surface temperature (T s) were −23 ± 3 and −31 ± 3°C, respectively (Table 1), and occurred in the second half of October (Fig. 1a). After 30 October, the air temperature started to exceed 0°C in the early afternoon, and remained in the range between −12 ± 3 and + 6 ± 3°C, with an average of −2 ± 3°C. The time series of cloud cover fraction (Fig. 1b) shows a bimodal distribution with 43% of occurrences of clear sky conditions (cloud cover ≤20%) and 44% of occurrences of overcast conditions (cloud cover ≥80%). This bimodal distribution was also observed over the Arctic sea ice in winter (Walsh and Chapman, Reference Walsh and Chapman1998) and reflected the passage of fronts with periods of clear sky conditions in between. Figure 1c demonstrates that during the measurement period the wind speed had a clear diurnal cycle. The strongest winds occurred at midnight from East-Southeast, and the weakest ones appeared in the afternoon from the East-Northeast (e.g. Liu and others, Reference Liu2019). This cycle is possibly related to the night-time katabatic flow suppressed by afternoon sea breeze generated by the heating of the bare land surface by solar radiation (Xie and others, Reference Xie, Mei, Liu and Wei2002). The daily cycle of wind contributed to enhancing the diurnal variation of air temperature, the cold katabatic flow coincided with the nocturnal surface cooling, while the midday suppression of the katabatic flow coincided with the midday surface warming due to solar radiation. There were several snowfall events during the observation period (Fig. 1d) corresponding to periods of overcast skies.
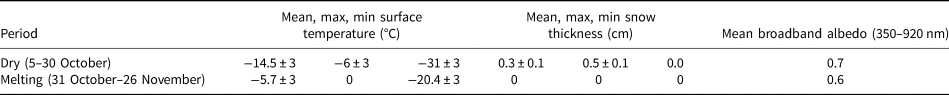
Table 1. Surface conditions during the spectral albedo measurements
As the temperature conditions strongly drive the surface snow and ice evolution, the surface properties are separately described in the two distinct temperature regimes: the first period (5–30 October) with a dry snow pack or a patchy mixture of snow and ice surface, with the surface temperature constantly below the freezing point, and the second period (31 October–26 November) when melting and freezing conditions alternated as a result of the increased solar radiation and hence the increased air temperature (Fig. 1a).
Phase I. Dry surface condition (5–30 October)
During this period, the surface temperature was below the freezing point in the range of −6 to −31°C (Table 1). The solar elevation angle at noon increased from 25° at the beginning of October to 35° on 30 October (Fig. 4d). The surface was either entirely or partly covered by snow (Figs 2a and b), with a mean snow thickness of 0.3 cm. Because the strong wind presented almost every night and morning, the newly fallen snow (Fig. 2a) was continuously re-distributed, resulting in large spatial variations in snow thickness. The year-to-year change in snow depth is very large for this region, for some years the snow depth is very small, e.g. Lei and others (Reference Lei, Li, Cheng, Zhang and Heil2010) found the mean snow thickness was close to 2.0 cm, but for some years the snow thickness is much larger, e.g. Zhao and others (Reference Zhao2019) observed a mean snow thickness of 11.3 cm.

Fig. 2. The surface conditions on (a) 5 October (a mixture of snow and ice), (b) 18 October (thin snow), (c) 15 November (bare ice) and (d) the relative position of the measurements (the Landsat image in (d) is cited from https://earthexplorer.usgs.gov/).
Phase II. Surface melting period (31 October–26 November)
The 2-m air temperature first exceeded 0°C on 30 October and remained close to 0°C for the rest of the measurement period. The air and surface temperatures varied less than that in Phase I. The surface temperature was in the range of −20.4 to 0°C (Table 1) and the surface was a mixture of snow and bare ice for the first few days, and after mid-November the bare ice was exposed to the surface (Fig. 2c). There was still no honeycomb on the top of ice layer during this period.
2.2. Spectral albedo measurements
The spectral radiation was measured with RAMSES ACC VIS spectral radiometers, manufactured by the TriOS Company and the relative position of the measurement shown in Figure 2d. The radiometers constitute of a photodiode array with 256 channels, and the range of measurement wavelengths is from 310 to 1100 nm, with an average spectral resolution of 3.3 nm. When comparing with the observations under clear sky with Kipp & Zonen CNR4, which has a range of 310–2800 nm, the proportion of our observation in the full band of solar radiation can be roughly estimated as 61%. The nominal spectral and calibration accuracy are better than 0.3 nm and 4%, respectively. The effective accuracy of the sensors is, however, much lower, due to the deviation of the light collector from the ideal cosine response (Gallet and others, Reference Gallet, Gerland, Granskog, Hudson and Pedersen2016), and probably the uncorrected thermal dependence of the sensitivity of the sensors. To the best of the authors' knowledge, a complete characterization of the instrument's response has not been carried out before. Hence, the instrument's uncertainty cannot be directly assessed. Two sensors were set up using two steel pipes with a connecting horizontal bar with a length of 3 m. The sensors were mounted at the center of the bar and vertically aligned (so that the light-diffusing surfaces of the sensors for optics were horizontally leveled), one sensor facing upward and the other facing downward to monitor the incident and reflected irradiances, respectively. The vertical distance from the collector of the downward-facing sensor to the ice surface was initially ~1.5 m. The sampling interval during the observation period was 2 min. Similar sensors have been widely used to measure the snow and sea-ice albedo and transmissivity (e.g. Nicolaus and others, Reference Nicolaus2010a; Lei and others, Reference Lei2012).
The spectral albedo α was calculated from the ratio of the upwelling irradiance F r(0, λ) to the downwelling irradiance above the snow/ice surface F d(0, λ):

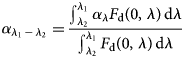
The broadband albedo $\alpha _{\mathop \lambda \nolimits_1 -\mathop \lambda \nolimits_2 }$ integrated in the wavelength range between λ 1 and λ 2 was calculated as:
Several steps of quality control were used for data processing. First, following Nicolaus and others (Reference Nicolaus, Hudson, Gerland and Munderloh2010b) and Lei and others (Reference Lei2012), all data were calibrated to the absolute spectra and interpolated to a 1-nm grid. Because of the high noise level for the lower and higher ends, we limited the spectrum to a range of 350–920 nm to eliminate the noisiest data. To remove the oxygen absorption effect ~760 nm, the spectral albedo from 750 to 775 nm was smoothed by linear interpolation.
Also, the impacts of the rack itself cannot be avoided and need to be accounted for during data processing (Fig. 2a). The reflected spectra were corrected for the effects of shadow and obstruction of incident diffuse light on the sampled area independently of wavelength and time applying a scaling factor of 1.0224 following Nicolaus and others (Reference Nicolaus, Hudson, Gerland and Munderloh2010b). We estimated that the remaining uncertainty related to the above-mentioned shadow and obstruction effects of the rack was at most of the order of 1%. The nominal working temperature range of the sensors is between −10 and +50°C, however, during the campaign the 2 m air temperature reached values that were well below that range (see Table 1), and therefore its uncertainty remains unknown.
During the observation period, the tilting of the sensors was checked every week. Furthermore, their horizontal leveling was indirectly assessed by analyzing the dependence of the observed clear-sky incoming irradiance from the sine of the solar elevation angle. The results showed that, under clear skies, the downwelling irradiance around the solar noon was linearly dependent on the sine of the solar elevation angle, which brought to the conclusion that the leveling was accurate.
At low solar elevations the instrument's signal to noise ratio and, therefore, the accuracy of the measurements, are lowest (e.g. Pirazzini, Reference Pirazzini2004; Nicolaus and others, Reference Nicolaus, Hudson, Gerland and Munderloh2010b; Lei and others, Reference Lei2012). As the spectral albedo data showed large systematic changes when solar elevation dropped to lower than 10°, we removed all the data observed at solar elevation angles lower than 10°.
Furthermore, the upward-facing sensor was occasionally covered by snow when there was snowfall with low wind speed. These observations cannot reflect the true incident solar irradiances, hence the spectral irradiance observations during snowfall events with the albedo higher than 1 were eliminated.
3. Evolution of spectral irradiance
The daily cumulative incident and reflected spectral irradiances are shown in Figures 3a and b, respectively. In response to the increase of solar elevation angle during the late-spring/early-summer transition (Fig. 4d), the incident spectral irradiances over the snow/ice surface increased at all wavelengths (Fig. 3a). This increase can also be seen from the time series of the daily mean total (wavelength integrated) incident solar irradiance integrated over the 350–920 nm wavelength range (Fig. 4a, red curve). Under dry conditions, the noon total incident irradiance ranged from 182 to 510 W m−2 with a mean of 352 W m−2 and a std dev. of 85 W m−2. During the melting period, the noon total irradiance reached the maximum value of 723 W m−2 on the clear-sky day of 19 November and was on average 510 W m−2 with a std dev. of 92 W m−2.
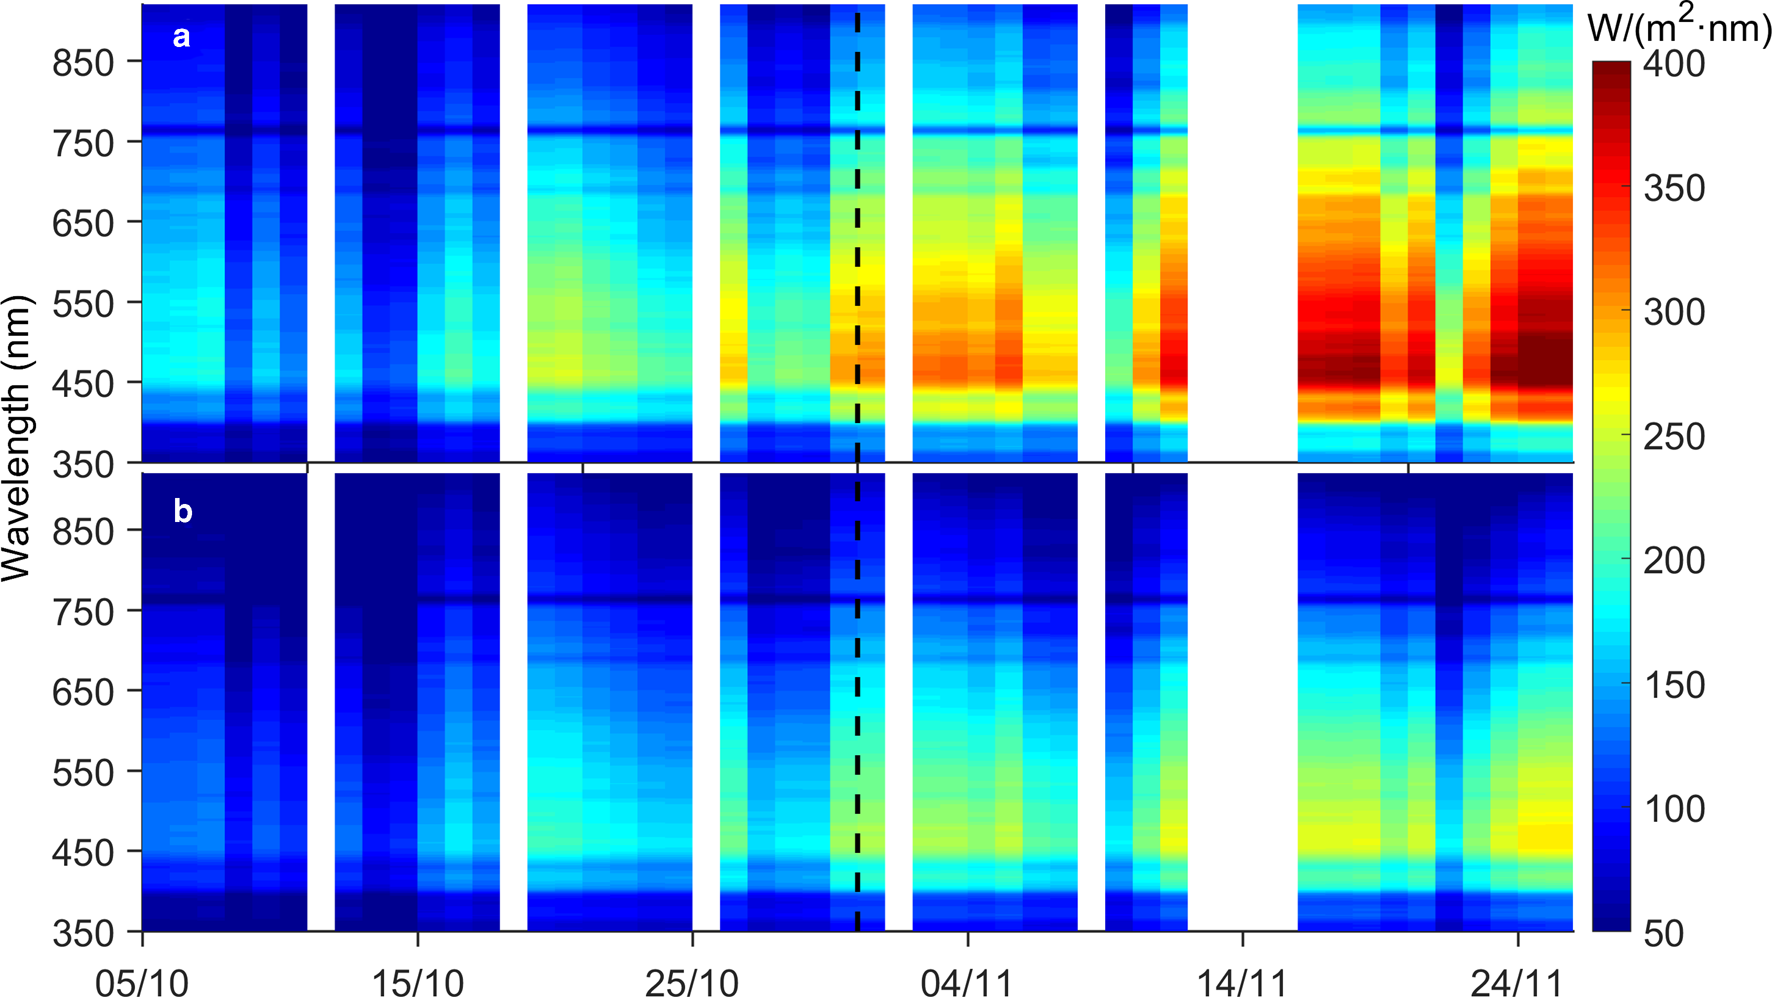
Fig. 3. Time series of the daily cumulative incident (a) and reflected (b) spectral irradiance during the observation period. White areas indicate missing data. The onset of surface melt on 30 October is marked with the vertical dotted line.
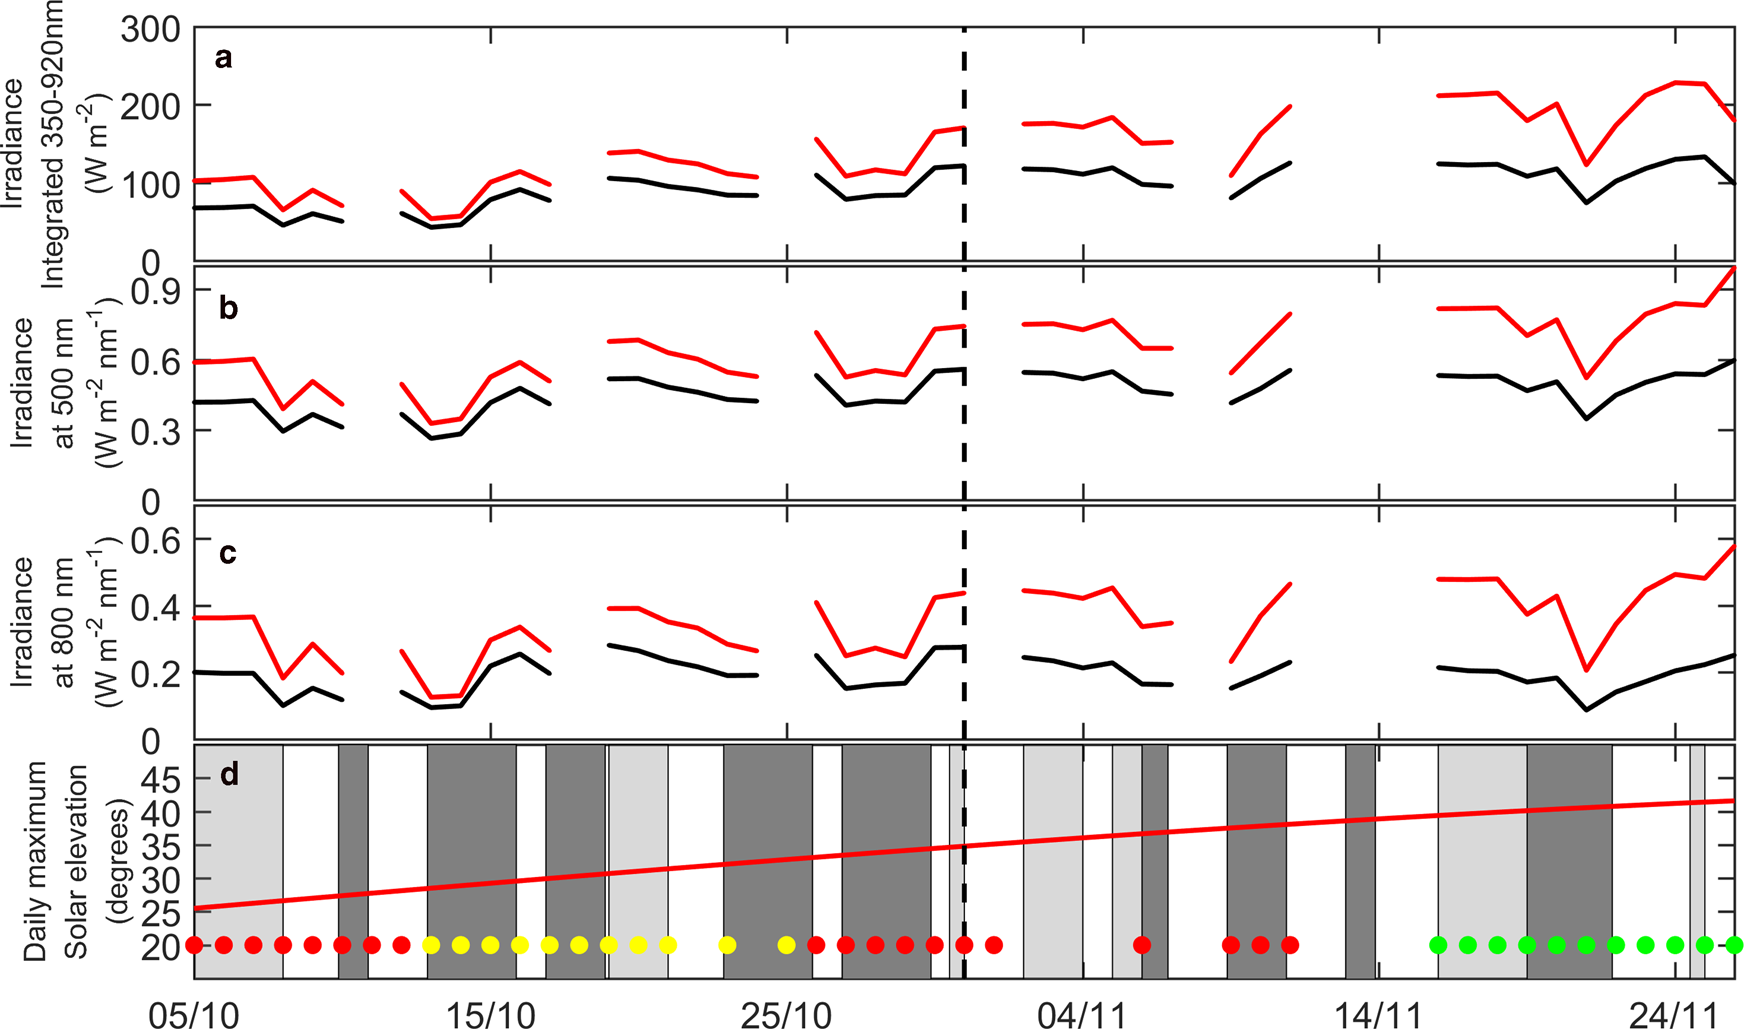
Fig. 4. Time series of the daily mean incident (red) and reflected (black) irradiance integrated over the 350–920 nm wavelength range (a), at 500 nm (b), at 800 nm (c) and the solar elevation angle at noon (d). White areas indicate missing and rejected data. The surface types are shown by dots (d): bare ice (green), snow (yellow) and a mixture of snow and ice (red). Days when snowfall occurred (at some moment, not necessarily for many hours) are marked in dark gray and days when clear sky occurred are marked in light gray. The onset of surface melt on 30 October is marked with the vertical dotted line.
Cloud cover variability modulated the incoming irradiance, especially in the near-infrared wavelengths (Fig. 3a): overcast conditions (e.g. on 9 November or 21 November), which were generally associated with snowfall, caused the halving of the incoming near-infrared irradiance compared to clear-sky conditions. This also appeared from the time series of the daily mean incident irradiance at 800 nm (Fig. 4c, red curve). By contrast, in the visible wavelengths the drop of daily mean incident irradiance from clear sky to overcast conditions was ~32%, as it appeared from the time series of the daily mean incident irradiance at 500 nm (Fig. 4b, red curve). Indeed, clouds effectively absorb the near-infrared radiation, shifting the spectral distribution of incoming irradiance toward the visible wavelengths. Moreover, the multiple reflections of the visible light between the highly reflecting surface and cloud base contribute to reducing the depletion of incoming shortwave radiation in the presence of clouds.
The reflected irradiance (Fig. 3b) showed a progressive increase during the observation period in the visible wavelengths in response to the increase of incoming irradiance, but did not show any significant increase in the near infrared wavelengths. In fact, the reflected irradiance at 800 nm was on average 190 and 201 mW m−2 nm−1 before and after the onset of surface melting on 30 October (Fig. 4c, black curve), respectively.
The time series of wavelength integrated incoming and reflected irradiances (Fig. 4a) shows an increasing divergence toward the end of the measurement period, which was mostly due to the absence of an increase of the near-infrared reflected irradiance. Indeed, the time series of near-infrared irradiance at 800 nm (Fig. 4c) shows a larger divergence between incoming and reflected irradiances than time series of visible irradiance at the 500 nm (Fig. 4b) between the two phases. The reflected irradiance was 418 and 507 mW m−2 nm−1 before and after the onset of surface melting on 30 October at 500 nm, and that was 190 and 201 mW m−2 nm−1 at 800 nm. The incident values were 548 and 744 mW m−2 nm−1 at 500 nm, and that were 295 and 416 mW m−2 nm−1 at 800 nm. Thus, the reflected irradiance was 20% less at 800 nm than that at 500 nm after 30 October, and that was 12% less before 30 October relative to the incident irradiance, which demonstrated the low reflectance at 800 nm. This indicates that after the onset of surface melting (after 30 October) there was a concurrent decrease of surface reflectivity that was most pronounced in the near-infrared wavelength range (such as at 800 nm). In fact, near infrared wavelengths are much more sensitive to the changes of snow and ice microstructure compared to the visible wavelengths (Wiscombe and Warren, Reference Wiscombe and Warren1980; Nicolaus and others, Reference Nicolaus2010a). On 16 November the snow melted completely (Fig. 4d), and after that the wetness of the ice surface increased. The small, highly reflective ice crystals, typical of fresh snow, underwent faster metamorphism and, thus, faster reduction in reflectivity during the melting conditions in phase II, which was therefore characterized by larger metamorphosed ice texture and bare ice with lower near-infrared albedo (Grenfell and Perovich, Reference Grenfell and Perovich2004; Pirazzini, Reference Pirazzini2008).
4. Evolution of spectral albedo
4.1. Late-spring/early-summer changes in spectral albedo
The two phases characterized by dry surface (5–30 October) and melting surface (31 October–26 November) had a distinct albedo evolution (Fig. 5). During the dry surface period (phase I), the sea ice was entirely or partly snow covered (Fig. 4d) and the broadband albedo (integrated over the 350–920 wavelength range) was 0.75. Before the snowfall on 13 October, the surface was bare ice with patchy snow areas, and the daily mean broadband albedo showed little changes around the value of 0.69. The snowfalls that occurred on 13–15 and 17–18 October caused some snow accumulation on the surface that raised the daily mean wavelength integrated albedo to 0.81. The difference in albedo between different wavebands decreased as the raise in albedo was largest in the near-infrared wavelengths (Fig. 6a). The near-infrared albedo decreased again after 25 October, when the strong wind (up to 17 ms−1) blew the deposited snow away and the surface again became a patchy mixture of snow and bare ice.
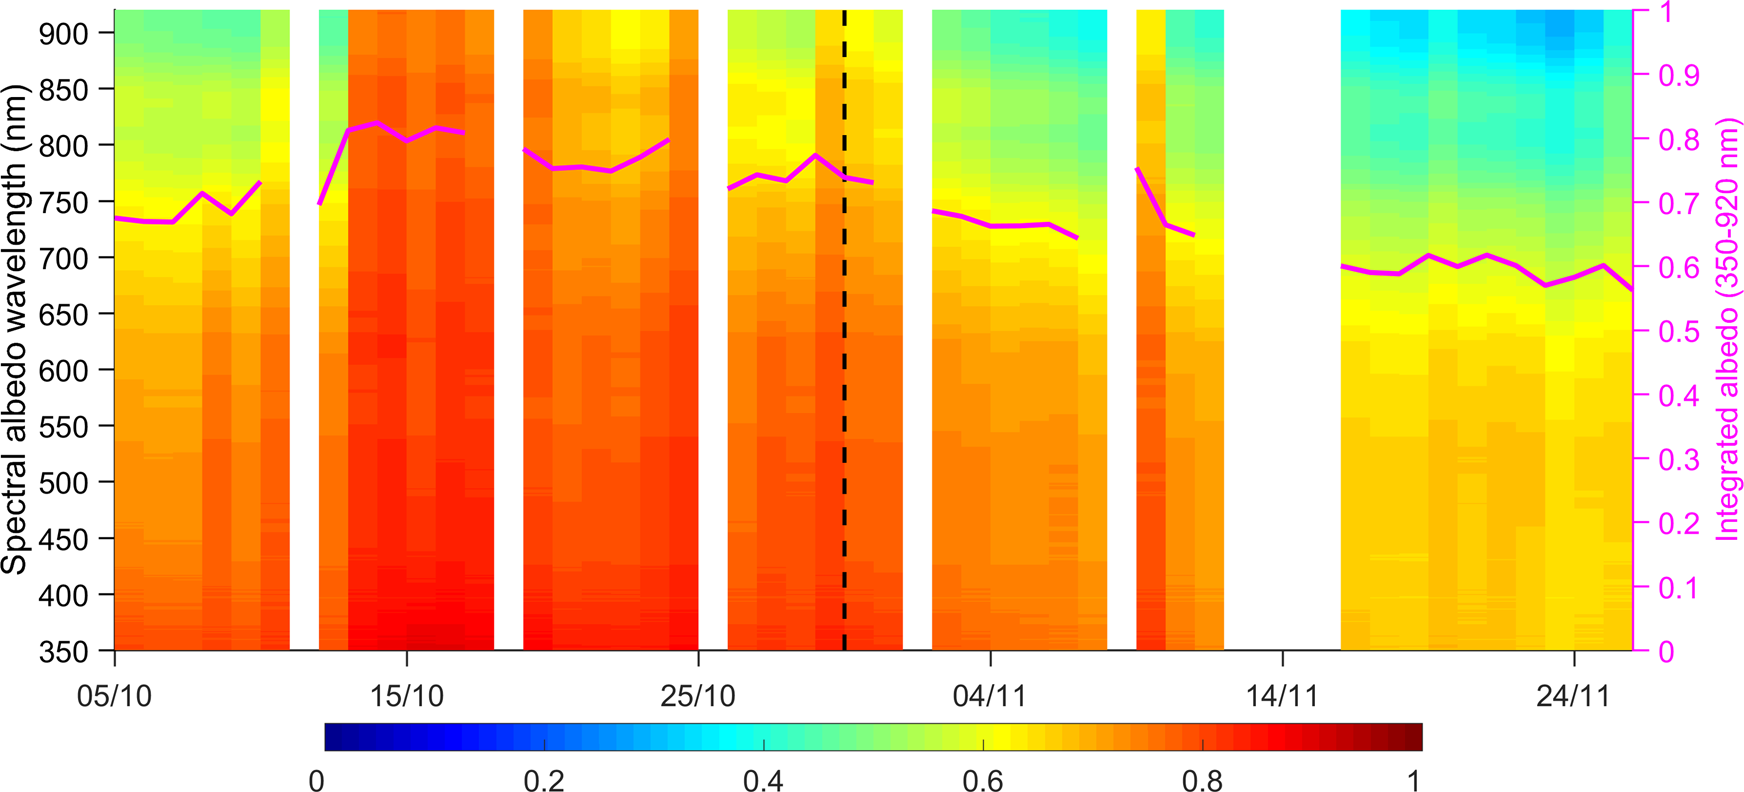
Fig. 5. Time series of daily mean spectral albedo (left axis) and daily mean albedo integrated over the 350–920 nm wavelength band (pink line, right axis). White areas indicate the missing data.
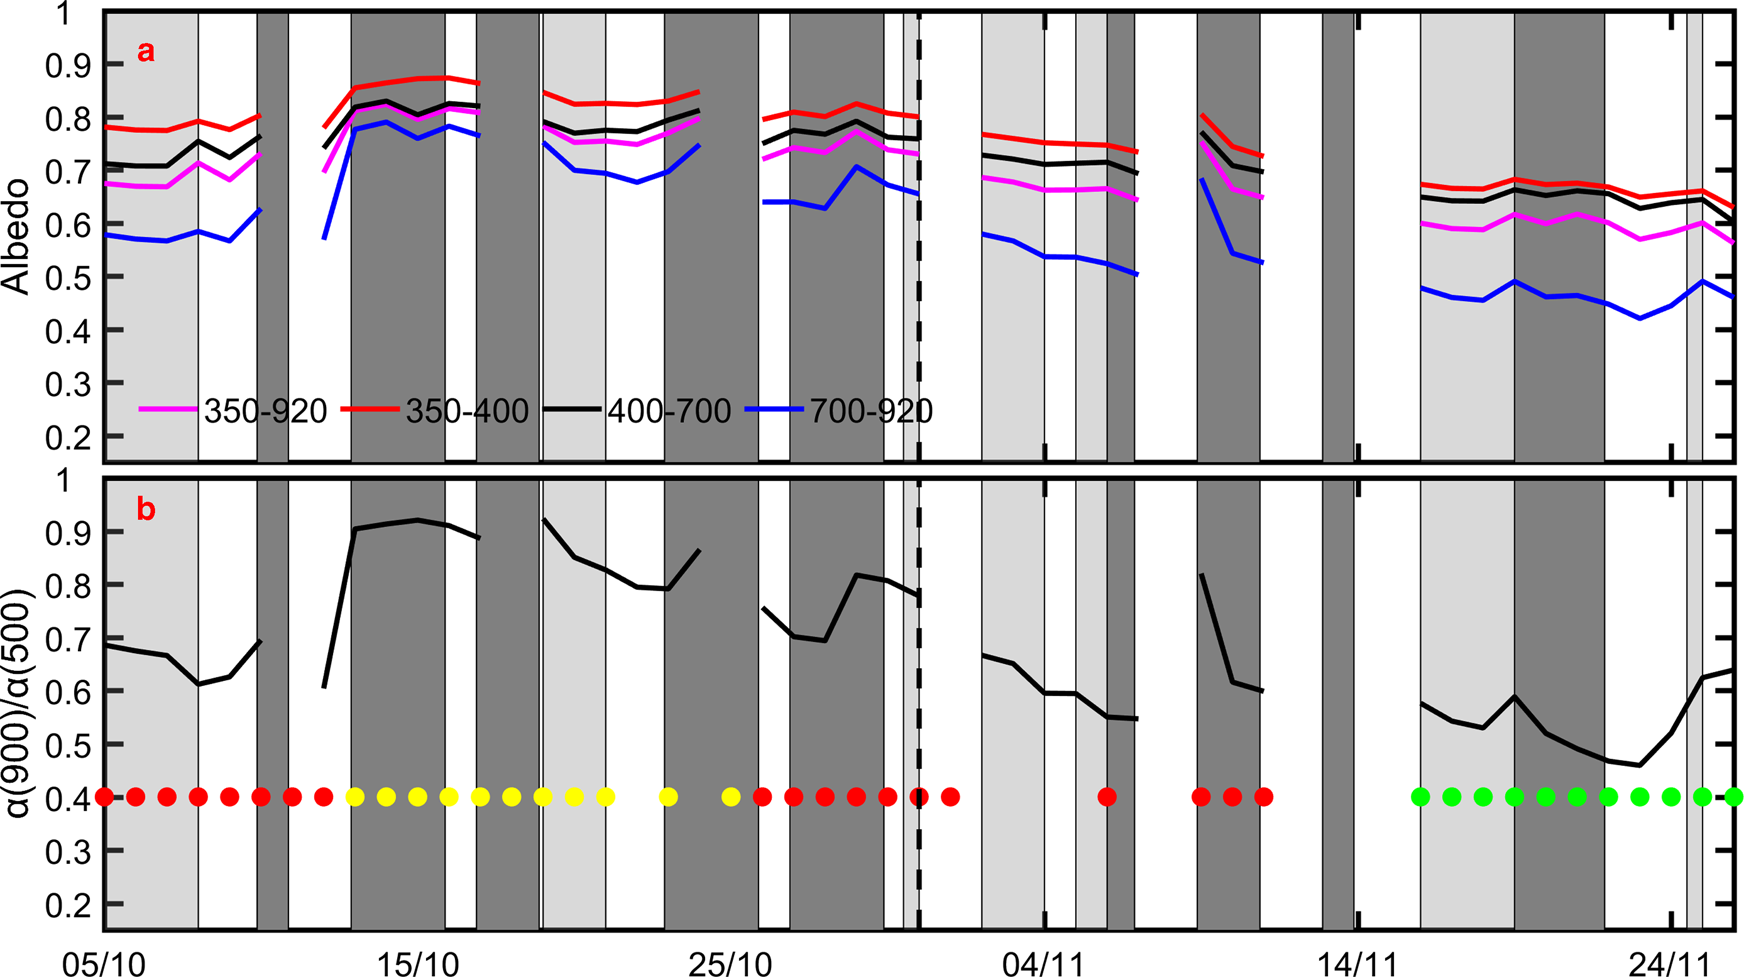
Fig. 6. Time series of daily mean spectral albedo for the integrated UV-A, visible and near-infrared albedo (a); the ratio of albedo at 900 nm to albedo at 500 nm (b). Days when snowfall occurred (at some moment, not necessarily for many hours) are marked in dark gray and days when clear sky occurred are marked in light gray. The surface types are shown by dots: green dots represent ice surface, yellow dots represent snow surface and red dots represent a patchy mixture of snow and ice. White areas indicate missing data. The onset of surface melt on 30 October is marked with the vertical dotted line.
The melting period (phase II) started on 30 October and was characterized by a decrease in wavelength integrated albedo until 16 November. After that, only melting bare ice remained at the surface, and the daily mean wavelength integrated albedo oscillated between 0.56 and 0.62. As seen in Figure 5, the surface albedo evolution also showed remarkable spectral dependence. During phase II, the albedo at wavelengths shorter than 700 nm remained well above 0.55, decreasing by ~20% from the beginning of the period, when the surface was characterized by a mixture of snow and ice, to the end of the period when the surface was bare ice. On the other hand, the albedo at wavelengths larger than 700 nm decreased from values 0.68, observed during or immediately after snowfalls, to values ~0.53 (at 700 nm) and 0.37 (at 900 nm) toward the end of the period (Figs 5 and 6a). The thinning and disappearance of the snow above the ice, which caused a decrease in albedo at all wavelengths, was not due solely to melting. In general at Zhongshan station, the snowfall events were accompanied by synoptic-scale strong-wind events and katabatic winds, which blew away the new snow, resulting in a changed distribution or disappearance of the snow pack.
The albedo integrated over the 350–400, 400–700, 700–920 and 350–920 nm bands representing the UV-A, the visible, the near-infrared and the broadband albedo respectively, are shown in Figure 6a. The reduction of snow covered area at the end of phase I caused a decrease of broadband albedo (black line in Figs 5 and 6a) from 0.82 to 0.73, with an average of 0.75 ± 0.05. From the beginning of phase II to mid-November, the snow melt and drift made the broadband albedo decrease from 0.73 to 0.65, with an average of 0.68 ± 0.04. After that, the surface was bare ice, and the broadband albedo showed only a slight decrease, from 0.62 to 0.56, caused by ice surface melt. The results show that the change of surface type impacted the broadband albedo more than melting under conditions of an unchanged surface type. Coherently with Figure 5, the albedo in the UV-A and visible bands (red and black lines in Fig. 6a) showed much smaller variability than the albedo in the near-infrared band (light blue line in Fig. 6a). In all wavelength bands, the largest day-to-day changes in albedo were associated with snowfall events: the average increment of daily mean albedo after the eight snowfall events occurred during the observing period was 0.02, 0.01, 0.01 and 0.02 in the broadband, UV-A, visible and near-infrared wavebands, respectively.
The ratio of albedo at 900 nm to that at 500 nm (α(900)/α(500)) shown in Figure 6b can be used to better characterize the spectral dependence of albedo (Nicolaus and others, Reference Nicolaus2010a; Lei and others, Reference Lei2012), highlighting the processes driving its evolution. As near-infrared albedo is more sensitive than visible albedo to changes in the ice crystals size and structure, the ratio can help in separating the effect of surface type (among the snow, the mixture of snow and ice, and bare ice) from the effect of snow/ice metamorphism and melting on the observed albedo evolution. Different ratios characterized the periods with different surface types: when the surface was a mixture of snow and bare ice, the ratio was on average 0.69, ranging from 0.82 to 0.55. When the surface was completely covered by snow, the ratio was on average 0.88, ranging from 0.92 to 0.79, while in the case of bare ice the mean ratio was 0.54, ranging from 0.46 to 0.64. During the periods in between snowfalls, the time series of the ratio showed a decreasing trend over all the three surface types, revealing the occurrence of surface metamorphism. These trends are not evident from the time series of visible albedo (black line in Fig. 6a) but they appear evident in the time series of near-infrared albedo (light blue line in Fig. 6a), although they are less pronounced than in the time series of the ratio.
Table 2 lists the mean surface albedo ($\overline \alpha _{{\rm \Delta }\lambda }$ ) and net shortwave radiation ($\overline {\hbox{Swn}} _{{\rm \Delta }\lambda }$
 , W m−2) integrated over the four distinct wavebands (the UV-A, visible, near-infrared and the entire range of 350–920 nm) during clear-sky and overcast conditions for cases when the surface was snow, a mixture of snow and ice, and bare ice. Clear-sky days were 19–20 October with snow surface, 5–7 October with a mixture of snow and ice and 16–18 and 24 November with bare ice, while overcast days were 13–14 October with snow, 10–11 and 29–31 October and 9 November with a mixture of snow and ice and 6, 10 and 21 November with bare ice. On average, the albedo of all the three surface types increased in all the four wavebands from clear sky to overcast conditions. The increase was between 0.05 and 0.08 in all cases but the UV-A band, which showed a smaller increase (0.02–0.03) when the surface was snow and a mixture of snow and ice. The observed increase in albedo with clouds is in line with previous observations (Pirazzini, Reference Pirazzini2004; Brandt and others, Reference Brandt, Warren, Worby and Grenfell2005).
Table 2. Mean surface albedo ($\overline \alpha _{{\rm \Delta }\lambda }$ ) and net shortwave radiation ($\overline {\hbox{Swn}} _{{\rm \Delta }\lambda }$
 , W m−2) integrated over three distinct wavebands (Δλ = 350–400, 400–700, 700–920 and 350–920 nm) during clear-sky and overcast conditions for cases when at the surface of the snow, combined snow and ice and bare ice
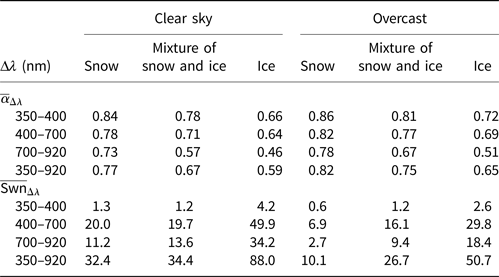
The increase of albedo from clear sky to overcast conditions corresponded to a decrease of $\overline {\hbox{Swn}} _{{\rm \Delta }\lambda }$ in all the considered wavebands and surface types. In case of bare ice and patchy snow, the contribution of the visible and near-infrared wavelength regions to ${\hbox{Swn}} _{{\rm \Delta }\lambda }$
 was approximately equivalent under clear sky conditions, meaning that the lower near-infrared albedo compared to the visible one compensated for the lower amount of incoming near-infrared irradiance. Conversely, under overcast conditions $\overline {\hbox{Swn}} _{ 400{\rm \ndash } 700}$
 was larger than $\overline {\hbox{Swn}} _{ 700{\rm \ndash } 900}$
 as the fraction of near-infrared incoming radiation is strongly reduced by the clouds. Over the snow surface the near infrared albedo is so high (being comparable to the visible albedo) that $\overline {\hbox{Swn}} _{ 400{\rm \ndash } 700}$
 was larger than $\overline {\hbox{Swn}} _{ 700{\rm \ndash } 900}$
 both under clear and overcast conditions because of the much larger amount of visible than near-infrared incoming irradiance.
The albedo spectra of the full measured wavelength range (350–920 nm) over the snow, a mixture of snow and ice, and bare ice surfaces on clear-sky days at noon are shown in Figure 7 for the same cases as in Table 2. These included 2, 3 and 4 days for snow surface, a mixture of snow and ice and bare ice surface, respectively. The albedo was largest on the snow surface and the smallest on the bare ice surface. The albedo maxima observed in the UV-A region most probably are overestimations due to the low signal-to-noise ratio of the measurements in this wavelength region. The surface albedo showed a qualitatively similar dependence on the wavelength for different surface types, but in the near-infrared bands the albedo decreased more rapidly with wavelength over bare ice than over snow. These albedo spectra are similar to the ones observed by Brandt and others (Reference Brandt, Warren, Worby and Grenfell2005) on snow, patchy snow and bare landfast ice over several Antarctic sea-ice areas, including the Prydz Bay.
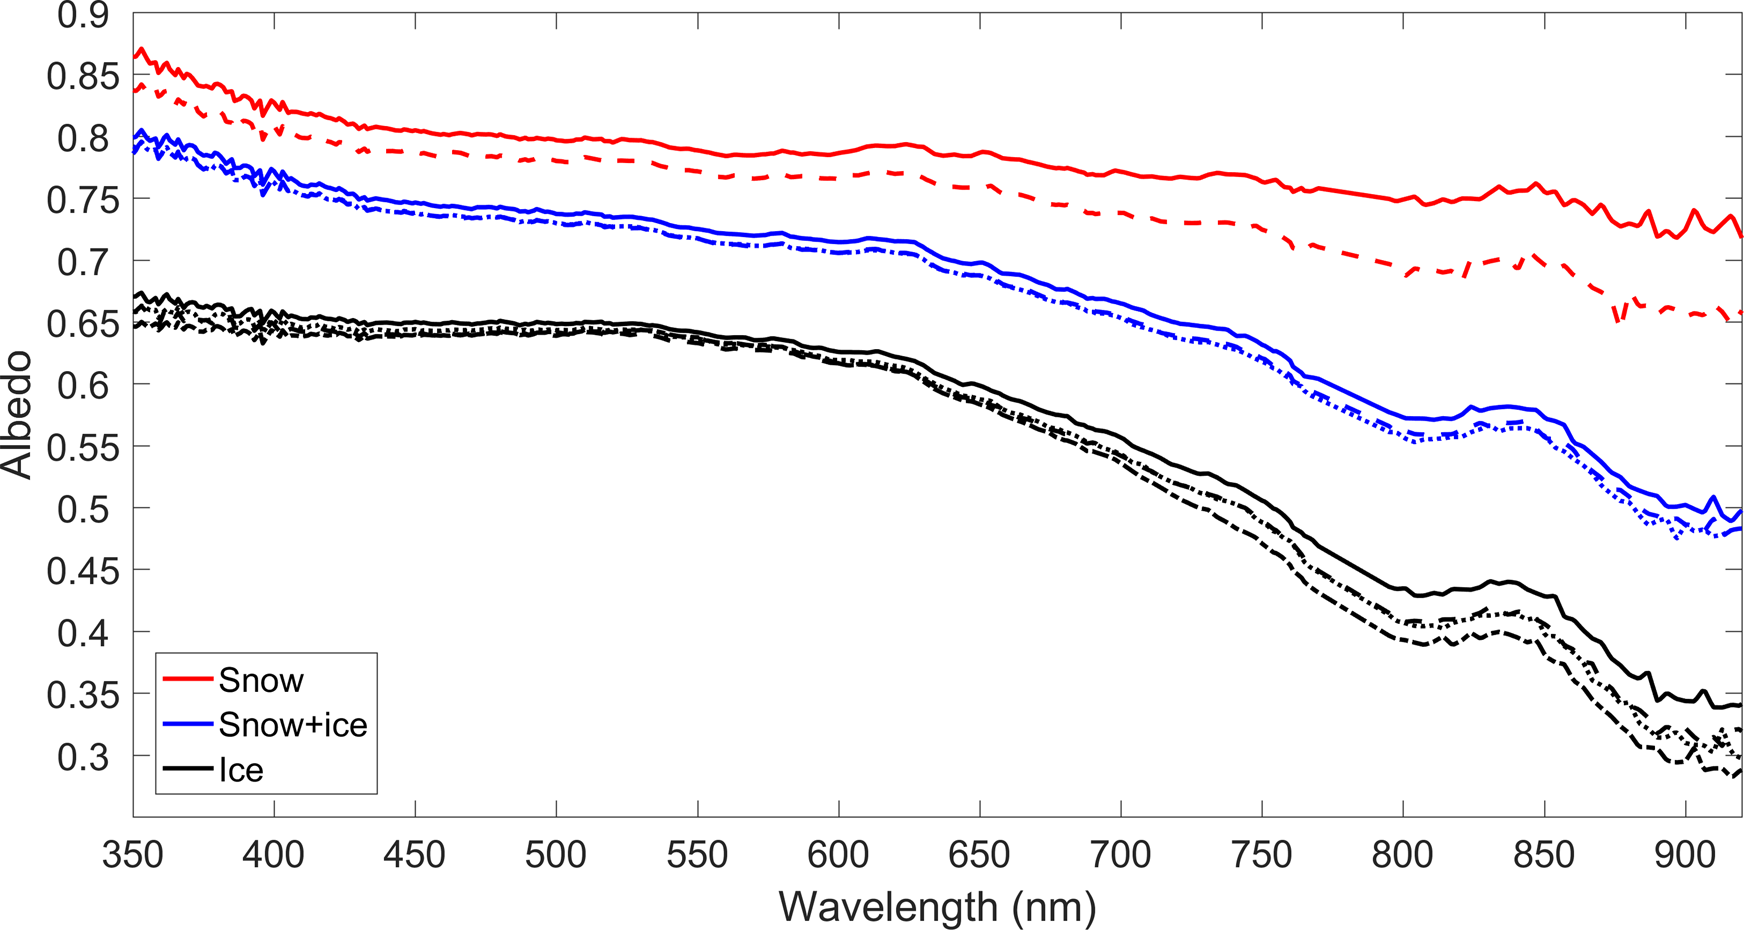
Fig. 7. The full spectrum albedo (350–920 nm) in the local noon under the clear sky of snow surface (red lines, 2 days, 19–20 October), the mixture of snow and ice surface (blue lines, 3 days, 5–7 October) and bare ice surface (black lines, 4 days, 16–18 and 24 November).
4.2. Diurnal cycle of spectral albedo
The diurnal cycle of clear sky albedo was strongly dependent on the surface conditions. The clear sky albedo at 500 and 800 nm for different surface types (snow, combined snow and ice and bare ice) are shown in Figure 8. The albedo values of both considered wavelengths have a qualitatively similar diurnal cycle. The albedo of the surface with snow (full or patchy snow cover, Figures 8a–d, respectively) decreased all the day, and the decrease was most rapid in the afternoon. In the case of bare ice, the albedo decreased during the morning hours much more rapidly than over snow and a mixture of snow and ice, and remained constant or slightly increased in the afternoon. The broadband albedo integrated over the measured wavelength range, over the UV-A, visible and near-infrared bands (Fig. 9) showed diurnal cycles similar to those at 500 and 800 nm over the three surface types, except that the UV-A albedo (red line in Fig. 9) showed a much lower diurnal decrease over snow (full or patchy snow cover), and a cycle almost symmetrical around noon over bare ice.
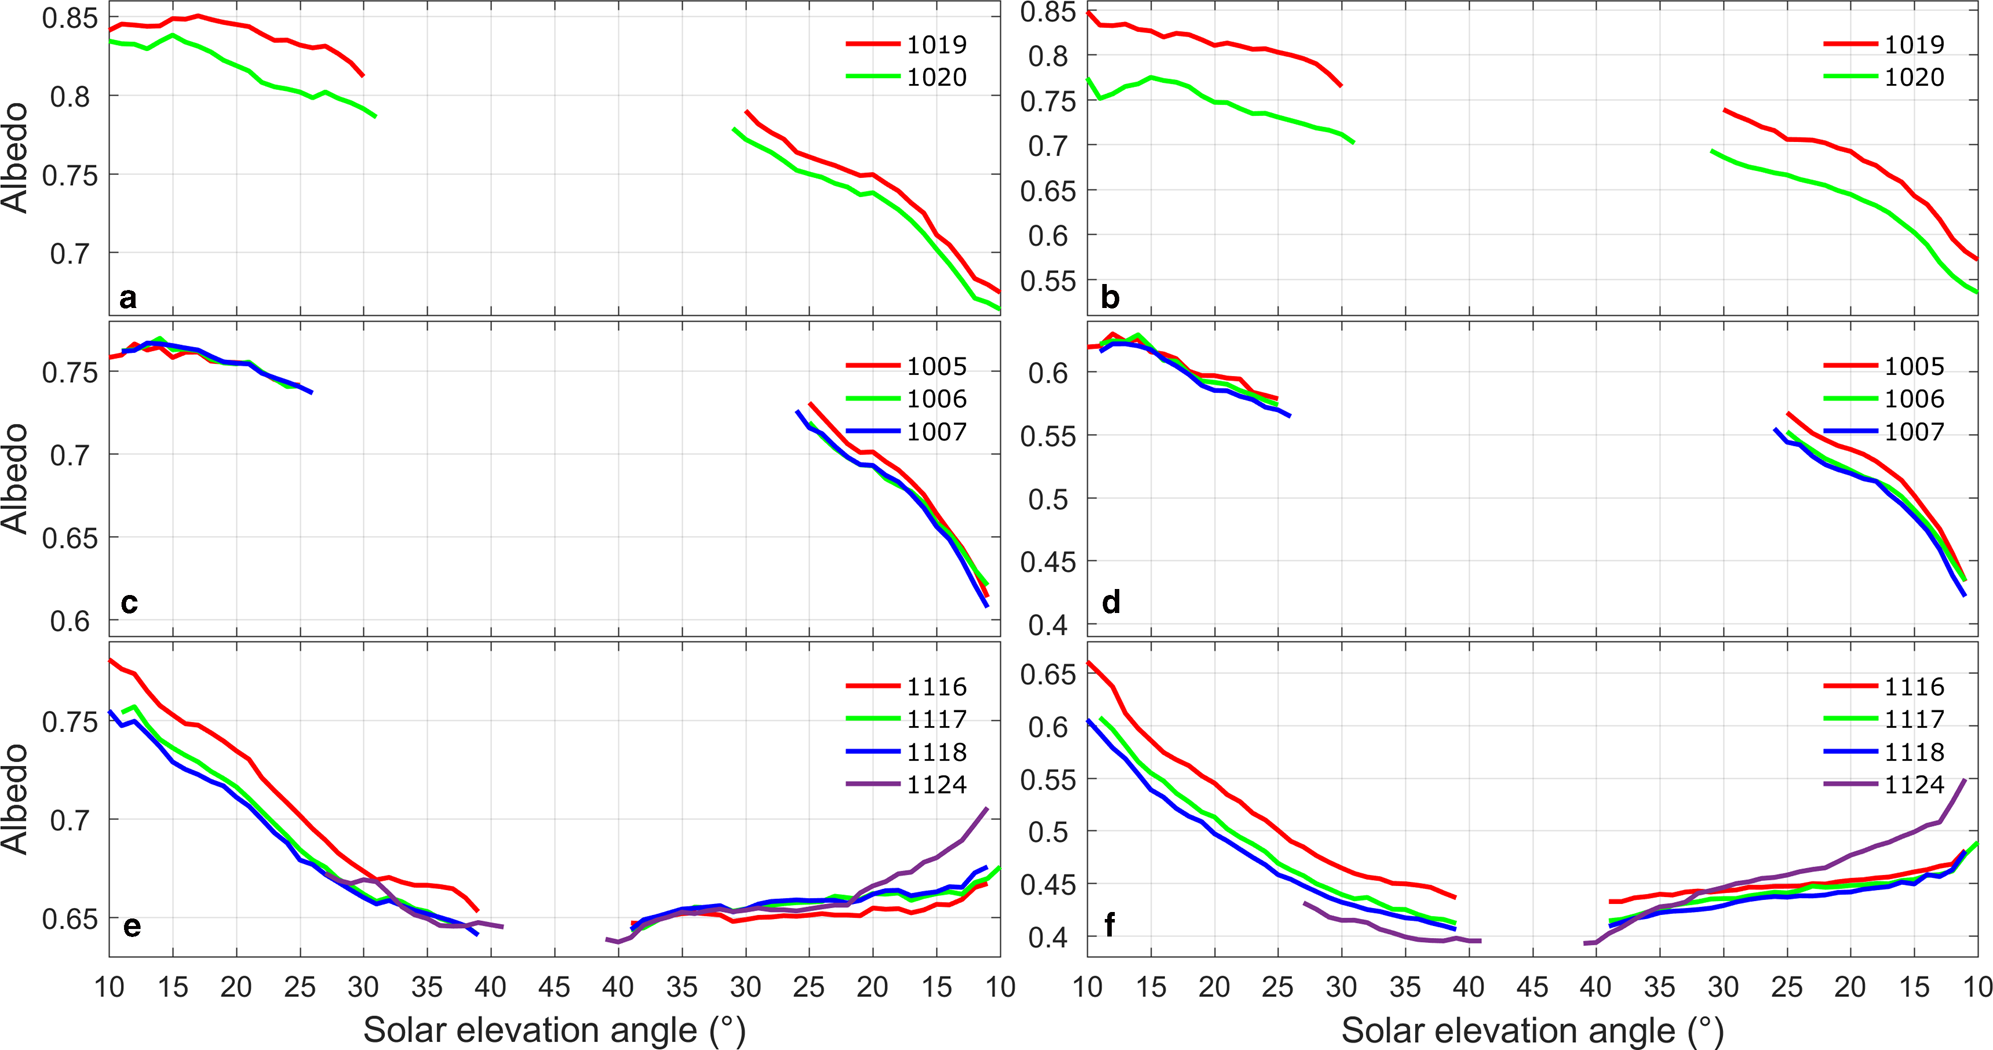
Fig. 8. The evolution of spectral albedo for 500 nm (a, c, e) and 800 nm (b, d, f) for the solar elevation angle higher than 10° on snow (a, b), a mixture of snow and ice (c, d) and bare ice (e, f) surface. Morning values are shown on the left side of the plots with solar elevation angle increasing from 10 to 45° and the afternoon values on the right side of the plots with solar elevation angle decreasing from 45 to 10°.
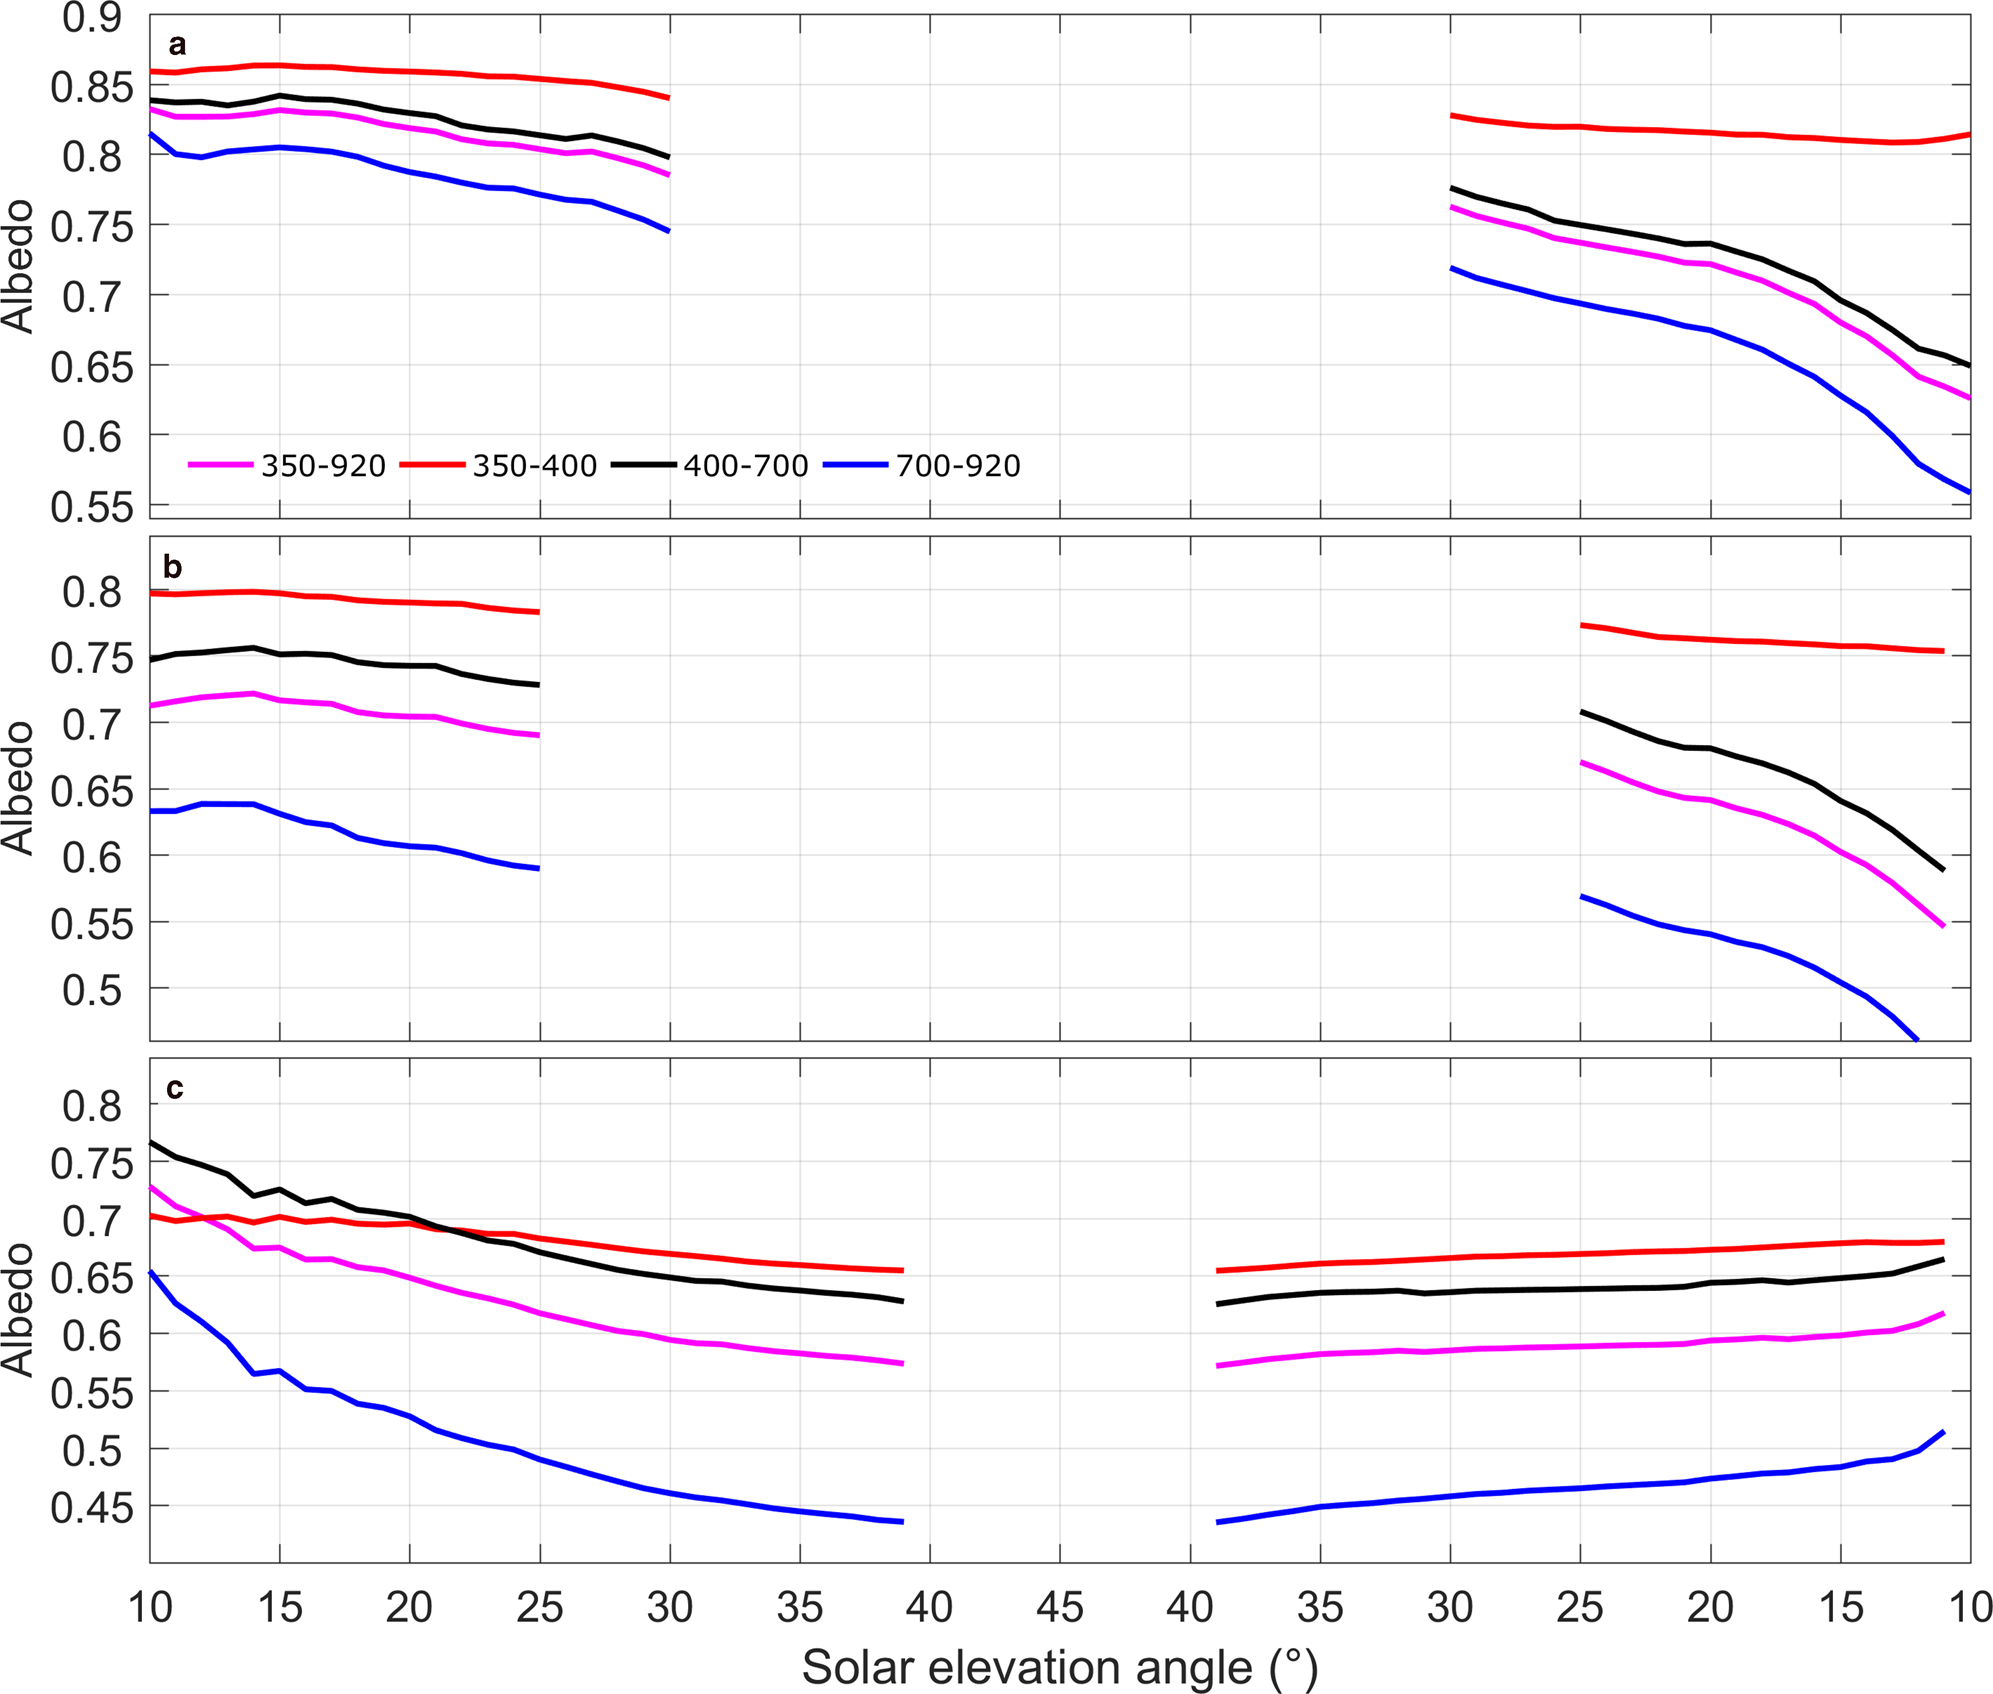
Fig. 9. The evolution of albedo in different spectral bands on snow surface (a, 2 days averaged), a mixture of snow and ice surface (b, 3 days averaged), and bare ice surface (c, 4 days averaged).
The diurnal albedo cycles at visible and near-infrared wavelengths over snow and bare ice surfaces are very similar to the broadband albedo diurnal cycles observed over corresponding surface types on an Antarctic glacier near to the coast (Pirazzini, Reference Pirazzini2004). Without changes in surface conditions, the diurnal cycle should be symmetric with respect to noon. In absence of more detailed observations of snow and ice properties, we can argue that the observed asymmetry was most probably caused by the snow metamorphosis, decrease of the snow fraction and thickness and snow/ice melt in the afternoon, followed by refreezing/frost crystal formation during the night which restored higher albedo values in the morning.
5. Discussion
The observations covered two distinct periods of dry and melting surface, enabling the study of irradiances and albedo evolution in relation to the changes in surface conditions and solar elevation angle. The observation site was off the coast, influenced by both the polar cyclones and the katabatic wind from the ice sheet. The cyclonic activity was responsible for the frequent snowfall events, which however did not cause any significant snow accumulation at the surface (the observed maximum thickness of fresh snow was 0.5 cm in this study), because nocturnal katabatic winds blew the snow away and re-distributed it. The snow properties affected by the atmospheric processes also reported by Nicolaus and others (Reference Nicolaus, Haas and Willmes2009) in Weddle Sea. The time series of albedo was therefore strongly affected by the alternation of surface types, from patchy snow to full snow covered and bare ice, and by the overlapping effect of snow metamorphism and melting in the second warmer period of the field campaign. The observed albedo was higher for the cold, dry surface and gradually decreased during the melting season, obviously most markedly in the near-infrared band because of its higher sensitivity to changes in the snow optical equivalent grain size caused by the snow metamorphism and melt. The day-to-day albedo variability was also larger for the near-infrared wavelengths than for the visible ones, as the low penetration depth of the near-infrared light made it very sensitive to changes in the top few millimeters of the surface such as those occurring in case of snowfall (Perovich, Reference Perovich2007).
The albedo showed strong, noon-asymmetrical diurnal cycle under clear skies, with approximately a 20–30% decrease of the wavelength integrated albedo from morning to evening over full and patchy snow cover, and a comparable decrease over bare ice but concentrated in the morning hours. Very similar diurnal albedo cycles have been also reported by previous studies on snow and ice surfaces in both the Arctic and Antarctic (Pirazzini, Reference Pirazzini2004; McGuffie and Henderson-Sellers, Reference McGuffie and Henderson-sellers1985; Pirazzini and others, Reference Pirazzini, Vihma, Granskog and Cheng2006; Wang and Zender, Reference Wang and Zender2011). The diurnal asymmetry over sites that experience day-time sublimation and/or melting can be explained with the formation of surface crystals at ‘night’ and early morning, and their subsequent sublimation/melting because of warming in the afternoon (McGuffie and Henderson-Sellers, Reference McGuffie and Henderson-sellers1985; Pirazzini, Reference Pirazzini2004; Domine and others, Reference Domine, Taillandier, Cabanes, Douglas and Sturm2009). Moreover, in the patchy mixture of snow and ice, the snow fraction and thickness jointly affected the albedo, but we cannot quantify their individual contributions. To disentangle the effects of concurrent surface processes on albedo, detailed measurements of ice and snow physical properties such as density and optical equivalent grain size would be needed, together with the modeling of radiative transfer in the snow covered sea ice.
6. Conclusions
In situ observations of surface albedo are still very rare over Antarctic sea ice, and spectral albedo observations are even more sparse. Over the coastal landfast sea ice in Prydz Bay continuous, automatic spectral albedo measurements were carried out for almost 2 months in the austral spring 2016, and the results are analyzed in this paper.
In summary, continuous high-resolution observations on spectral albedo and properties of snow and ice surface allowed a detailed description of the processes that resulted in temporal variations and the decreasing trend of surface albedo during spring and early-summer. The evolution of the mean albedo decreased responding to the dry (phase I) to wet (phase II) conditions. The variability was more pronounced at the near-infrared in both the two phases and day-to-day cycle. The albedo diurnal cycle was asymmetric with respect to noon under clear sky and snow and ice metamorphism and surface melting dominated over the solar elevation angle dependency in shaping the albedo evolution.
However, the following should be noted: (1) this study was only based on local observations during a 53-day period; (2) the measured wavelength range of 350–920 nm does not fully cover the solar spectrum (320–2800 nm) and (3) measurement inaccuracy of ~5% is present in the absolute albedo values, and probably ~5–10% in the instrument response to changes in solar elevation angle (the angular response of the instruments was not measured and therefore its uncertainty remains unknown). The presented results and conclusions are based on observed albedo trends and changes that are larger than the abovementioned uncertainties, however more in situ observations with more detailed characterization of the surface and longer time series are needed to better understand and quantify the surface albedo and net solar radiation on Antarctic sea ice.
Time series of spectral albedo are essential to validate and calibrate optical and microwave remote sensing instruments (Nicolaus and others, Reference Nicolaus2010a). Thus, the in situ observations can be used to assess the plausibility of the Antarctic satellite-derived ice albedo by using the nearest pixels interpolation (Lei and others, Reference Lei2016). These data could also be used to verify the commonly used spectral albedo parameterization schemes used in the Antarctic regional sea-ice models (e.g. Curry and others, Reference Curry, Schramm, Perovich and Pinto2001; Liu and others, Reference Liu, Zhang, Inoue and Horton2007; Yang and others, Reference Yang2016). Such studies will be carried out in our future work.
Acknowledgements
This study was supported by the National Key R&D Program of China (Grant No. 2018YFA0605903), the National Natural Science Foundation of China (Grant Nos. 41941009 and 41922044), the Guangdong Basic and Applied Basic Research Foundation (Grant No. 2020B1515020025), the Academy of Finland (contract 304345) and the training program (P193015007). This is a contribution to the Year of Polar Prediction (YOPP), a flagship activity of the Polar Prediction Project (PPP), initiated by the World Weather Research Programme (WWRP) of the World Meteorological Organization (WMO). We acknowledge the WMO WWRP for its role in coordinating this international research activity. We thank the Chinese Arctic and Antarctic Administration and Polar Research Institute of China for the CHINARE logistics support. We thank Marcel Nicolaus and Stephen Hudson for sharing the routines for the shadow correction in the data processing. The Russian meteorological station of Progress II is also thanked for providing precipitation data. We thank two anonymous reviewers and the scientific editor Iestyn Barr for their valuable comments to help improve our manuscript.


 Open access