


Once an outbreak starts, it is important to quantify how a disease is spreading, how it is affecting the population, and how different public health measures will have an impact on its effects. Epidemiology is the study of how a disease is distributed in a population, and of the different factors that determine this distribution. These studies can help to quantify the main population factors that led to the introduction and spread of an infectious disease in the population and the conditions that are associated with the severity of the disease. Epidemiology can also be used to assess the current extent of the disease and the effectiveness of different interventions, including different therapies and public health measures. Finally, it can also help to make predictions on likely future scenarios, given the current assessment of the situation and the different measures taken.
In the first few months of the COVID-19 pandemic we have witnessed an exponential increase in the number of cases and deaths. The implementation of different containment measures in different parts of the world has led to vastly different outcomes. Whereas in some Asian countries early containment measures were able to stop the infections, in many other places the growing number of cases made containment unfeasible, forcing a change to mitigation strategies to reduce the impact on the healthcare system and the number of fatalities associated with lack of adequate care (Figure 2.1). For the current COVID-19 outbreak, we would like to quantify what conditions enabled the emergence of the disease, how fast the disease is spreading in the human population, how deadly it is, the different factors that affect disease severity, how effective the current public health measures are, and the possible future scenarios of the pandemic.

Figure 2.1 The number of confirmed COVID-19 cases reported to the World Health Organization (WHO) from the beginning of the pandemic at the end of December 2019 until March 29, 2020 by different regions of the world. The green bars represent the cases reported to the WHO at the beginning of the pandemic, with the vast majority of cases from Wuhan in Hubei province in China. The outbreak in China was rapidly controlled by imposing a lockdown of the region and strong confinement measures. The total number of deaths in Hubei attributed to the virus during this period was estimated to be over 3000. The number of cases in other regions of the world remain very low until the beginning of March 2020, when an exponentially growing number of infections were identified in Europe and the USA. The number of deaths in Europe and the USA follow suit.
How Long Does It Take to Have Symptoms?
The incubation period is the time from infection to the onset of the disease – that is, the appearance of the first symptoms. This is an important concept, because this period can vary according to the disease and the person. During the incubation period, there are no symptoms, and it is hard to assess whether a person is infectious or will become sick.
A well-known measure against infectious diseases is so-called quarantine. Where does this term come from? In the 1300s, Europe was ravaged by the plague. In order to prevent the disease from entering a city, all boats were required to anchor for 40 days. These 40 days were considered a safe time to assess whether anyone aboard presented the symptoms of the plague. These 40 days, or quaranta giorni, is where the word quarantine comes from. A person will become ill 2–6 days after being infected with the bubonic plague, but it takes almost 40 days from infection to death.
The incubation period varies dramatically across different infectious diseases. The incubation period for influenza, for instance, is a couple of days. For the common cold, it is about four days. However, the incubation period for rabies in humans can be 1–2 months. In the COVID-19 outbreak the incubation period has been estimated to be five days, similar to SARS. However, a few rare cases have been reported in which this incubation period has been more than two weeks. Measures of isolation, as with the original quarantine, should take into consideration these longer incubation periods.
How Many People Will the Virus Infect?
The attack rate is the number of people developing a disease or infected with an infectious agent divided by the total of number of people susceptible to the disease. These rates are usually estimated from all cases from the beginning to the end of the epidemic. In an ongoing epidemic, the rate cannot be measured, but it can be estimated through modeling. In the case of a new infectious agent in the population, such as SARS-CoV-2, everyone is susceptible, and the attack rate is the fraction of the population that has been infected with the virus. The attack rate will depend on many factors, including how quickly the infectious disease spreads, and what measures can be taken to avoid its spread.
In the first influenza pandemic of the twentieth century, the Spanish Influenza, it was estimated that one-third of the global population was infected with the virus. In an ongoing outbreak, it is hard to estimate the fraction of the population that will become infected. It will depend on how fast the infectious agent spreads and how effective the measures taken to control its spread are.
How Quickly Does the Virus Spread in the Population?
One way of quantifying the infectiousness of a pathogen is the basic reproduction number (R0), which is the estimated number of new infections per infected individual. If this number is smaller than 1, meaning that a person rarely infects another person, the number of infected individuals in the population will decrease with time, until the infectious agent will not be able to propagate (Figure 2.2).
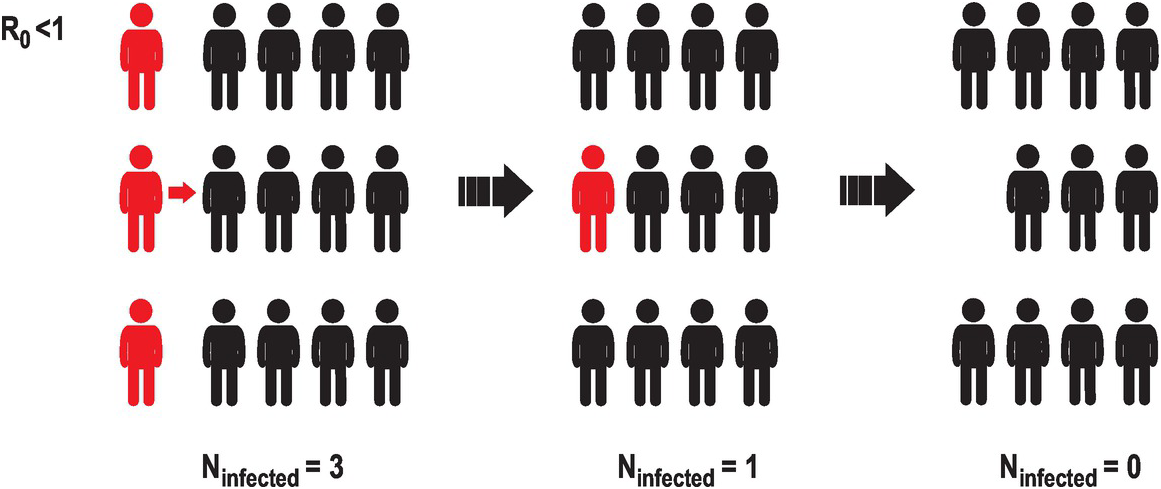
Figure 2.2 A representation of the evolution of an infectious agent with low basic reproduction number or R0. A way to estimate how fast an infectious disease is spreading is to estimate the mean number of infections caused by a single infected individual. This illustration represents a case in which a few infected individuals (three in this case, represented in red) interact with uninfected individuals (in black). If the basic reproduction number is smaller than 1, the number of new infections diminishes. Eventually the infectious agent will disappear from the population.
But if the basic reproduction number is greater than 1, the number of infections will grow exponentially. For instance, imagine that an infectious agent has a basic reproduction number of 2. This means that a single infected individual will infect, on average, another two people (Figure 2.3). These two newly infected people could then infect another two each, resulting in four newly infected people. And so on. If these new infections occur five days after the previous infection, then in a 30-day month, there are six five-day periods, and a single person can lead to 2 × 2 × 2 × 2 × 2 × 2 = 64 new infections – and in two months that’s 4096 new infections. By six months, the entire world population will have been infected. This type of growth is called exponential and characterizes the initial growth of infections in an uncontrolled setting. Under exponential growth, the number of cases can increase very quickly (Figure 2.4). Exponential growth nicely illustrates the idea that early interventions are important. For instance, if by social distancing we can reduce the mean number of contacts by 50%, the number of new infections will be reduced to only one. In the first case, thousands of new infections could saturate a hospital, while in the second they can be monitored and contained. This is an example of how social distancing and social responsibility can generate large effects in the course of an infection. Of course, the growth of these numbers will depend on the number of individuals who are susceptible, and the contact between infected and non-infected individuals. Strong quarantine measures can reduce the basic reproductive number to less than 1.

Figure 2.3 A representation of the evolution of an infectious agent with high basic reproduction number or R0. We present a case in which an infectious agent has an estimated R0 bigger than 1. In such a case, a single infected person can infect several others, and in successive infections this number can increase exponentially. R0 depends very much on the infectious agent. The R0 of SARS-CoV-2 is estimated to be 2–3, indicating that the number of infective cases will increase exponentially in the first months of the outbreak.

Figure 2.4 The exponential growth of the number of infections depends on the basic reproduction number or R0. Cases with R0 > 1 will see an exponential increase in the number of infections in a completely susceptible population, if no containment measures are implemented. If the basic reproduction number is smaller than 1, the number of cases will decrease exponentially. A basic reproduction number of 1 will keep the same number of infected cases steady over time as every infected person will infect one other person on average.
This R0 number varies dramatically across different infectious agents. Some viruses transmit poorly, like the Middle East respiratory syndrome coronavirus (MERS-CoV), showing a R0 of less than 1. This explains why all MERS outbreaks are small, usually happening in hospitals. For seasonal influenza, this number has been estimated to be slightly larger than 1, and the R0 of the 1918 Spanish Influenza was close to 2. For SARS-CoV and SARS-CoV-2 this number is about 3, which means that every infected person is able to infect another three people. Other infectious diseases can have a much larger basic reproduction number, such as polio and measles.
How Many People Will Die from the Disease?
The infection fatality rate is the number of individuals dying from the disease in a particular period of time divided by the total number of people infected. But sometimes the total number of infected individuals is unknown. This number can be approximated by the case fatality rate, or the number of fatalities over the total number of reported cases. If all the infected individuals have been reported, the infection fatality and the case fatality rate will be the same. But in diseases with unreported or untested cases, as with COVID-19, the two numbers could be very different.
The mortality rate of a disease is the fraction of the population who die from the disease in a particular period of time. The main difference between infection fatality rate and mortality rate is that the infection fatality rate is the fraction of the population who die from the disease compared with the number of individuals infected, whereas the mortality rate is compared to the total population. A concrete example is presented in Figure 2.5.

Figure 2.5 An illustration of three relevant measures to characterize the extent and mortality of an infectious disease. Imagine a population of 15 individuals, of whom 6 individuals became infected with disease and 2 of those died from the disease. The attack rate is the fraction of the population that contracts the disease; in this case it is 6 of the 15 members of the population, so the attack rate is 40%. The infection fatality rate is the fraction of the infected cases who die from the disease, in this case it is 2/6, or 33%. The total mortality rate is the fraction of the population that died from the disease, so 2 people out of the 15, or 13%. A localized outbreak could have a very high infection fatality rate, but if the disease does not spread, the mortality rate in the whole population could be low. For instance, the Ebola virus in the outbreak in West Africa in 2014 had a high infection fatality rate of near 40%, whereas the Spanish Influenza was estimated to be close to 10%. However, the total number of deaths in the world from Ebola virus was much smaller (11,000 versus 50 million) because the outbreak remained confined to specific regions.
In the case of the Spanish Influenza of 1918, the number of deaths was estimated to be around 50 million (although estimates range from 20 to 100 million) from a population of 1.8 billion people, giving a mortality rate of 2.7%. If one-third of the population could have been infected, this entails an infection fatality rate close to 10%, although estimates can vary by a factor of 2. Later flu pandemics, in 1957 and 1968, reported fewer deaths at close to two million. Case fatality for other coronaviruses, such as MERS-CoV, are estimated to be much higher, nearly 35%, although the transmissibility is much lower.
Some of the most vulnerable groups to COVID-19 are people of advanced age, and those with other serious diseases or terminal illnesses. If someone is critically ill from a disease, for instance with cancer, and dies after getting infected with COVID-19, should this death be counted as caused by cancer or by COVID-19? In some cases the cause of death is not specified, because the person may not have been tested for the coronavirus. If a person dies from a different cause (e.g. a heart attack) because a coronavirus-overwhelmed healthcare system was not able to provide care, should this death be counted as part of the effects of the virus? One important notion that takes into consideration these cases is the excess mortality – that is, the temporary increase in the mortality rate in a specific population. That can be estimated by counting the number of deaths before and during an outbreak for the same period of time. For instance, the excess mortality during the 1918 Influenza was estimated to be more than 80% – that is, there were 80% more deaths than would have been expected for a similar period of time. There have been a few estimates of the excess mortality in the first weeks of the COVID-19 pandemic (Figure 2.6). For instance, in the Madrid province in Spain in the period March 10–16, 2020, in the first few weeks of the COVID-19 outbreak, 1318 deaths were registered, compared to the expected 794 from estimates in previous weeks. However, only 192 deaths were reported to be associated with COVID-19, suggesting that there could be a significant unreported excess of deaths that may be linked to COVID-19. Similar observations have been made in Wuhan, China and Northern Italy.

Figure 2.6 Excess mortality, or how to estimate the number of fatalities of COVID-19. Sometimes we do not have information on whether a particular death is related to a cause. For instance, there are many possible causes of a pneumonia-associated death, including different viruses and bacteria. In the case of COVID-19, there have been many suspected deaths that were not tested, for a variety of reasons. When the cause is an infectious agent, such as SARS-CoV-2, we can estimate the number of associated deaths by comparing the number of deaths in the time and region where the agent was circulating with the number of deaths in normal circumstances. In other words, how many more deaths have occurred when an infectious agent has been around in a population, or the excess fatality. This figure shows the number of observed fatalities per day in Spain in the first few months of 2020 (in red) compared to the number of deaths in other years (blue). A dramatic increase in the number of deaths in March was associated with the circulating of SARS-CoV-2 in that country.
How Does the Severity of Diseases Vary?
The severity of most diseases depends on age. For instance, seasonal influenza is a particularly serious disease for infants and the elderly. COVID-19 has been seen to be a particularly serious disease for the elderly. If we want to compare the effect of COVID-19 across different populations, we have to take into account that age distribution varies across countries. Although in Japan the median age is more than 47 years, in many countries in Africa it is below 20. So, if we want to understand the effects of COVID-19 across different populations, we need to take the different population distributions into account.
In COVID-19 the case fatality rates vary dramatically with age. The Chinese Center for Disease Control and Prevention has shown that the case fatality rate under 40 years old was 0.2%, but that it rapidly increases with age to 15% above 80 years old. If the case fatality rate age distribution is similar across countries and there are similar numbers of infections, we should expect that the total number of deaths due to COVID-19 in most African countries would be smaller compared to countries with longer life expectancies, such as some countries in Europe, Asia, or North America.
It has also been observed that the severity of infectious diseases can be different in men and women. For seasonal influenza, the rates of hospitalization for males is higher than for females, among both the young and the elderly. The same has been observed in COVID-19 deaths. The difference in the rate of illness (morbidity) and rate of death (mortality) between men and women could be due to a variety of factors, including biological and lifestyle factors. For instance, in many countries smoking is more common in men than women, and smoking is one of the most important risk factors in respiratory complications.
What Is “Flattening the Curve” and Why Is It Important?
During the COVID-19 outbreak we have observed that one of the main factors that has overwhelmed the response to the disease is the rapid surge of cases that need urgent medical attention (Figure 2.7). The surge capacity is the capacity of the healthcare system to accommodate a sudden increase in the number of patients. An overwhelmed healthcare system can occur when a highly infectious disease spreads quickly in a population, and the number of infected people suddenly requiring clinical care is larger than the capacity of the healthcare system. This overwhelmed healthcare system lacks the physical means to provide care to patients and to protect medical personnel, reducing ever further the capacity to respond, and thus accelerating the morbidity and mortality associated with the disease.

Figure 2.7 Flattening the curve and surge capacity. Overwhelming the healthcare system can reduce the capacity to assist patients and dramatically increase mortality. Early implementation of preventive measures, like social distancing, can mitigate the overwhelming of healthcare systems; delaying the peak gives more time to prepare and to acquire necessary equipment and protection for healthcare workers. Pandemic mitigation strategies include voluntary isolation and quarantine, closure of schools and childcare programs, cancellation of public gatherings, reduction of social interaction at work and increased use of telecommuting, and other social distancing measures. The effect of these mitigation measures can delay the peak and its magnitude, allowing the healthcare system to take care of patients and healthcare workers. In the course of the COVID-19 pandemic, many countries set up field hospitals to accommodate the surge in patient numbers. This figure shows an improvised field hospital in a convention center in the outskirts of Madrid, Spain on April 21st 2020.
The identification of a disease outbreak requires immediate action, with measures including population testing, tracing contacts and isolation, quarantine, and treatment of infected cases. Effective containment measures can reduce the spread and the sudden surge of cases requiring medical attention. If these measures prove ineffective, more drastic measures need to be taken, including closing of public gathering places, schools, theaters, and increased social distancing. More aggressive measures can require lockdowns of entire cities or countries. These measures can “flatten the curve” by lowering the peak number of cases and allowing the healthcare system to respond and provide the clinical care needed in severe cases (Figure 2.7).
Overloading of the capacity of the healthcare system occurred during large pandemics in the past, such as the Spanish Influenza of 1918. During October 1918, 195,000 US citizens died from the virus. In addition, the war in Europe demanded the deployment of nurses to military camps, exacerbating the shortage of medical personnel. There are many historical accounts that record how different cities and countries imposed different measures and how effective these measures were. Early aggressive interventions proved to be effective in the reduction of cases and easing of the burden on healthcare systems. We will see in Chapter 8, when talking about the influenza pandemics, a couple of examples of these early interventions. In the case of COVID-19, active testing, tracking, and isolation, together with social distancing, has proven very effective in countries such as South Korea.
What Is Herd Immunity?
An important concept in epidemiology is the idea of herd immunity. When a new infectious disease appears, such as SARS-CoV-2, most of the population is unprotected. This leads to a rapid spread of the infectious disease, with the aforementioned surge in the number of cases and fatalities, and the associated pressures on healthcare systems. However, when a fraction of the population has been exposed previously to the infectious disease, or has been vaccinated, those individuals become immune, slowing the spread of the disease (Figure 2.8). The more people are protected against the disease, the more difficult it is for the infectious agent to spread. If a certain threshold is reached, the infectious agent is unable to spread.

Figure 2.8 Herd immunity. An infectious agent may not be able to propagate in a population in which a significant fraction of individuals is immune to the disease due to previous exposures or vaccination. In order to spread, susceptible individuals (represented in blue) need to be in contact with infectious ones (in red). The more immune individuals (in green) there are in the population the more difficult it will be to spread the infection. The herd immunity threshold is the fraction of the population that needs to be immune in order to preclude disease spread. The herd immunity threshold will depend on the infectiousness of the specific infectious agent. Highly infectious viruses will require a larger fraction of the population to be immune. For instance, the herd immunity threshold for measles is close to 95%. Failure to vaccinate a significant fraction of the population can lead to outbreaks of the disease. For COVID-19, the threshold is lower, probably about 50% of the population.
The fraction of the population that needs to become immune in order to stop the spread of the infectious disease is called the herd immunity threshold. The more contagious a disease, the higher the herd immunity threshold will be. The herd immunity threshold will depend on the basic reproduction number, R0. This dependence can be understood easily if we think about the number of potential infections from a single infected individual in a partially immune population: R0 times the fraction of those susceptible in the total population. If this product is smaller than 1, the infectious agent will not be able to propagate.Footnote 1 For the highly infectious measles virus, it has been estimated that 95% of the population needs to be immune. For seasonal influenza, which is less transmissible, the threshold is around 35%.
For COVID-19 the herd immunity threshold has been estimated to be around 50% of the population. That means that we will be able to stop the progression of the virus if more than half of the population has been infected or vaccinated. In the case of a pandemic, such as COVID-19, if containment measures fail, most people will become infected. If they recover, and if they are able to mount a lasting neutralizing immune response, the virus will not be able to re-infect them and the effective rate of transmission will drop. This herd immunity can be dampened if the pathogens evolve to escape the adaptive immune response or if the immune responses are not lasting. Influenza vaccines, for instance, could be ineffective in a fraction of the population, such as the elderly, because the immune system wanes with age. In addition, the virus mutates – this is the reason influenza vaccines need to be updated every year. Herd immunity is one of the main reasons why mass vaccinations have been able to control the spread of many infectious diseases. Lack of compliance with mandatory vaccinations creates larger populations of susceptible individuals, and enables outbreaks of otherwise controllable infectious diseases.
Every virus has its own personality, and coronaviruses are very different from other viruses. To understand how coronaviruses cause disease and how they spread, we need to delve deeper into what coronaviruses are, where they can be found, and how they infect cells. We will look at this in more detail in the next chapter.


