


1. Introduction and background
Reducing hydrodynamic skin-friction drag using superhydrophobic (SHPo) surfaces has attracted much attention over the last two decades. In laminar flows, it is well understood that the ability to retain trapped gas, called plastron (Brocher Reference Brocher1909), that provides a large slip length is the key when assessing different SHPo surfaces for drag reduction. Furthermore, studies showed that the slip length of a SHPo surface is determined by its microstructural features, such as the pitch, solid fraction and pattern type, as analysed by Lauga & Stone (Reference Lauga and Stone2003) and verified by Lee, Choi & Kim (Reference Lee, Choi and Kim2008), and further affected by secondary factors, such as the state of the liquid–gas interface, as reviewed by Lee, Choi & Kim (Reference Lee, Choi and Kim2016). Most importantly, slip lengths large enough to impact realistic flows (e.g.  $>$50
$>$50  $\mathrm {\mu }$m to be comparable to the viscous sublayer thickness of turbulent flows under large ships) have been engineered (Lee et al. Reference Lee, Choi and Kim2008; Lee & Kim Reference Lee and Kim2009).
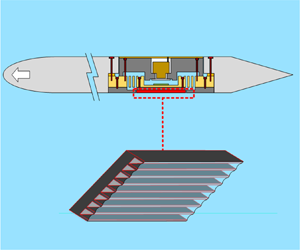
Drag reduction is much more important for turbulent flows, especially large-scale flows such as turbulent boundary-layer flows over marine vessels. While certain SHPo surfaces have shown to reduce drag significantly in turbulent flows in laboratory experiments using a water channel (Daniello, Waterhouse & Rothstein Reference Daniello, Waterhouse and Rothstein2009; Park, Sun & Kim Reference Park, Sun and Kim2014; Ling et al. Reference Ling, Srinivasan, Golovin, McKinley, Tuteja and Katz2016; Gose et al. Reference Gose, Golovin, Boban, Mabry, Tuteja, Perlin and Ceccio2018) or Taylor–Couette set-up (Srinivasan et al. Reference Srinivasan, Kleingartner, Gilbert, Cohen, Milne and McKinley2015), experimental studies in fully turbulent flows in open water have been discouraging, with the only publication reporting a drag increase (Aljallis et al. Reference Aljallis, Sarshar, Datla, Sikka, Jones and Choi2013) until a recent successful demonstration (Xu et al. Reference Xu, Grabowski, Yu, Kerezyte, Lee, Pfeifer and Kim2020a). Turbulent flows have been found to have a strong impact on the SHPo surfaces of random roughness (Gose et al. Reference Gose, Golovin, Boban, Mabry, Tuteja, Perlin and Ceccio2018; Reholon & Ghaemi Reference Reholon and Ghaemi2018), whose irregular asperities would protrude into water and create form drags once the plastron is compromised by the flow. However, despite the importance to the fate of the plastron, the gas concentration or pressure of the surrounding water is often neglected. Most laboratory experiments investigating drag reduction with SHPo surfaces have been performed in a closed flow system, where the water pressure on the test surface is affected by the system and likely different from the surrounding atmospheric pressure, as shown in figure 1 as an example. In a water channel, at high speed, the water pressure in the test section tends to be lower than the atmospheric pressure. This imbalance in pressure, while irrelevant for almost all traditional flow experiments, presents SHPo surfaces with an environment significantly different from open water, where most watercraft operate. Envisioning SHPo surfaces covering the hull of water vessels, we are interested in zero-pressure-gradient turbulent boundary-layer flows that are shallow under the free surface of open water, i.e. the water that is always exposed to and in equilibrium with the atmosphere.

Figure 1. Gauge pressure measured in the test section of a water tunnel at the US Naval Undersea Warfare Center. Note the pressure drops below the atmospheric pressure at high flow speeds. Courtesy of C. Henoch at the Naval Undersea Warfare Center (Newport, Rhode Island, USA).
A recent study (Xu et al. Reference Xu, Grabowski, Yu, Kerezyte, Lee, Pfeifer and Kim2020a) has successfully demonstrated a large ( $\sim$30 %) drag reduction on a $4\ \textrm {cm} \times 7\ \textrm {cm}$ SHPo surface attached under a 13’ motorboat in high Reynolds number ( ${Re}_{x}\sim 8\times 10^{6}$) flows in open water. The SHPo surfaces were decorated with special microtrenches aligned along the flow direction. Despite the first successful demonstration and its great practical implication, the boat experiments showed large fluctuations in drag reduction data due to the inconsistent and unpredictable flow conditions around a travelling boat in a real marine environment, making it difficult to quantitatively study the parameters that affect drag reduction, such as the Reynolds number and trench microstructures. While numerical studies have shown definite drag reduction in turbulent flows and brought insights into the effect of these parameters (Min & Kim Reference Min and Kim2004; Park, Park & Kim Reference Park, Park and Kim2013; Park Reference Park2015; Rastegari & Akhavan Reference Rastegari and Akhavan2018), experimental results have not validated the numerical results over a sizeable range of turbulent flows in realistic conditions of water. Here, we present the effects of Reynolds number (up to ${Re}_{x}\sim 1.1\times 10^{7}$) and microstructures (3.5 cm long and 7.0 cm long microtrenches and random roughness) on drag reduction by testing microtrench SHPo surfaces in a high-speed towing tank, which ensures well-controlled flows in an open-water condition.
2. Experimental set-up
2.1. SHPo surfaces
To obtain significant drag reduction in regular-scale (i.e. not microscale) flows, SHPo surface should be able to both induce large slip (e.g. slip length  ${>}50~\mathrm {\mu }$m such as Lee et al. Reference Lee, Choi and Kim2008) and retain smooth plastron (i.e. minimal disruption) for given flow conditions, as explained in Lee et al. (Reference Lee, Choi and Kim2016). First, to induce a large slip in a turbulent flow, both numerical (Min & Kim Reference Min and Kim2004; Martell, Perot & Rothstein Reference Martell, Perot and Rothstein2009) and experimental (Daniello et al. Reference Daniello, Waterhouse and Rothstein2009; Woolford et al. Reference Woolford, Prince, Maynes and Webb2009; Park et al. Reference Park, Sun and Kim2014) results supported SHPo surfaces with streamwise-aligned structures as the most effective by enhancing streamwise slip and suppressing spanwise slip, the latter of which could increase drag (Min & Kim Reference Min and Kim2004; Golovin et al. Reference Golovin, Gose, Perlin, Ceccio and Tuteja2016). The most straightforward such structure would be a trench (or grating, ridge, groove). Also, a larger trench pitch (periodicity) and width would lead to a larger streamwise slip length (Lauga & Stone Reference Lauga and Stone2003; Lee et al. Reference Lee, Choi and Kim2008) and larger drag reduction. Second, on the other hand, to hold the plastron stably against hydraulic activities and air diffusion, the trench width should be small (Poetes et al. Reference Poetes, Holtzmann, Franze and Steiner2010; Xu, Sun & Kim Reference Xu, Sun and Kim2014). Note the contradictory requirement for the trench width in order to achieve large slip. Following Park et al. (Reference Park, Sun and Kim2014) and Xu et al. (Reference Xu, Grabowski, Yu, Kerezyte, Lee, Pfeifer and Kim2020a), a good compromise was found with a pitch ( $P$) of 50–100 $\mathrm {\mu }$m and width ( $W$) of 5–10 $\mathrm {\mu }$m or gas fraction $(GF = W/P)$ around 90 %. Furthermore, pinning of the air–water interface on the trench top (top edge to be more exact) was enhanced by making the top edges slightly re-entrant, as described by Xu et al. (Reference Xu, Grabowski, Yu, Kerezyte, Lee, Pfeifer and Kim2020a) – important because the drag-reducing ability would be significantly compromised as soon as the meniscus is depinned from the trench top, as reviewed in Lee et al. (Reference Lee, Choi and Kim2016). It is worth mentioning that random roughness SHPo surfaces, which are popular for their easy fabrication, are not likely to provide the necessary plastron unless the flow is relatively slow and the water is highly saturated with air – a condition rarely found in the field, as confirmed by Xu et al. (Reference Xu, Grabowski, Yu, Kerezyte, Lee, Pfeifer and Kim2020a). In the present study, we use essentially the same SHPo surfaces as the ones found to be successful in a field condition by Xu et al. (Reference Xu, Grabowski, Yu, Kerezyte, Lee, Pfeifer and Kim2020a): microtrenches fabricated out of 4 inch silicon wafer by microelectromechanical systems (MEMS) techniques followed by Teflon spin coating and hydrophobic random roughness spray coated on bare silicon for comparison, as shown in figure 2.

Figure 2. Microstructures on  $4\ \textrm {cm} \times 7\ \textrm {cm}$ SHPo surfaces used for the drag reduction experiments in this study. (a) Parallel trenches with 50 $\mathrm {\mu }$m in pitch of two types, $7.0\ \textrm {cm}$ and $3.5\ \textrm {cm}$ in length, not drawn to scale for clarity. The scanning electronic microscope (SEM) shows the sharp and slightly re-entrant top edges. (b) The SEM of the random roughness tested for comparison.
SHPo surface samples used in this study are a rectangular coupon 4 cm in width and 7 cm in streamwise length. This particular size of  $4\ \textrm {cm} \times 7\ \textrm {cm}$ was chosen in order to overcome the size effect of the earlier $1\ \textrm {cm} \times 2\ \textrm {cm}$ SHPo samples (Park et al. Reference Park, Sun and Kim2014), which were found to overestimate the drag reduction by 5 %–20 % (Park Reference Park2015), and still fit inside the 4 inch silicon wafer used. The entire surface is covered with 45 $\mathrm {\mu }$m wide trenches separated by 5 $\mathrm {\mu }$m wide walls, i.e. $P = 50~\mathrm {\mu }$m and $GF = 90\,\%$, as shown in figure 2(a), which also shows that the trenches start $\sim 30~\mathrm {\mu }$m away from the outer edges of the coupon. The centimetre-scale streamwise dimension is considered long enough to avoid the Marangoni effect of trace surfactant explained by Peaudecerf et al. (Reference Peaudecerf, Landel, Goldstein and Luzzatto-Fegiz2017). In addition to two samples with 7 cm long trenches, as schematically shown in figure 2(a), and naming them P50-GF90-1, we also prepare one sample with the trenches divided into two in their length and name it P50-GF90-2. The division is to help stabilize the plastron against the shear-induced failure described by Wexler, Jacobi & Stone (Reference Wexler, Jacobi and Stone2015). Because most previous experimental studies of drag reduction with SHPo surfaces in turbulent flows used random roughness, we additionally prepare a random roughness SHPo surface shown in figure 2(b), using a spray process similar to most others (Aljallis et al. Reference Aljallis, Sarshar, Datla, Sikka, Jones and Choi2013; Zhang et al. Reference Zhang, Tian, Yao, Hao and Jiang2015; Hokmabad & Ghaemi Reference Hokmabad and Ghaemi2016), for direct comparison, as was done by Xu et al. (Reference Xu, Grabowski, Yu, Kerezyte, Lee, Pfeifer and Kim2020a), and name it Random.
2.2. Low-profile shear-stress sensor
Our goal is to measure the shear force on a small surface section of a large object moving in water so that the surface section, despite its small size, is subjected to the same flow condition (e.g. same Reynolds number) of the large object. The small surface section is a SHPo surface sample  $4\ \textrm {cm} \times 7\ \textrm {cm}$ in size, and the large object may be a boat (Xu et al. Reference Xu, Grabowski, Yu, Kerezyte, Lee, Pfeifer and Kim2020a) or, in this study, a towing plate adequate for a given towing tank facility. Since no existing shear sensor satisfies such a need, a unique low-profile (only $\sim$2 cm thick) shear-sensing system has been developed (Xu et al. Reference Xu, Arihara, Tong, Yu, Ujiie and Kim2020b) and utilized with a boat as the large object (Xu et al. Reference Xu, Grabowski, Yu, Kerezyte, Lee, Pfeifer and Kim2020a). As shown in figure 3(a), the sensor carries a SHPo surface sample on its $4\ \textrm {cm}\times 7\ \textrm {cm}$ floating element. The floating element is suspended from the main plate by highly flexible but robust beams, all monolithically manufactured from a corrosion-resistant (marine-grade 5083) aluminium plate, and its displacement by the friction drag is measured by a high-resolution optical encoder held in the encoder plate. The flexure beams were machined to form a high thickness-to-width aspect ratio so that the sensor is only sensitive to the forces in the streamwise direction and insensitive to all other directions. A sample surface is attached onto the floating element, and a cover sheet occupies the rest of the area on the main plate, as shown figure 3(b). Intricate provisions are employed to ensure that the top surface of the sample is flush with the surrounding surfaces (step height $<$5
$<$5  $\mathrm {\mu }$m, corresponding to $<$0.45–1.75 wall units in this study) and with minimal horizontal gap ( $\sim$50 $\mathrm {\mu }$m, corresponding to $\sim$4.5–17.5 wall units in this study). Once the spring constant of the beams is calibrated, the shear force on the floating element can be calculated from its displacement in flows, as reported in Xu et al. (Reference Xu, Arihara, Tong, Yu, Ujiie and Kim2020b), which provides further details of design, development and characterization of the shear sensor.

Figure 3. Low-profile shear sensor and testing set-ups (not drawn to scale). (a) Top view of the shear sensor shows a floating element defined within the main plate. (b) Cross-sectional view of the sensor shows the low-profile design (only 2 cm thick) made of two (main and encoder) plates. (c) The 1.4 m long towing plate developed for tow tank tests is viewed from top as a cross-section. Note the shear sensor replaces a portion of the plate 1.1 m downstream, 0.3 m from its tail edge.
2.3. Towing plate and towing tests
The towing tank facility (95.4 m long, 3.6 m wide, and 1.8 m deep) at the Davidson Laboratory of the Steven Institute of Technology (Hoboken, NY, USA) was used to create high-speed turbulent boundary-layer flows. Since the drag measurement system of the facility was developed for a metre-scale test object and did not provide the sensing range and resolution needed to test our  $4\ \textrm {cm} \times 7\ \textrm {cm}$ samples, the low-profile shear sensor developed above was indispensable. To follow the procedures used for Aljallis et al. (Reference Aljallis, Sarshar, Datla, Sikka, Jones and Choi2013), which coated the entire surfaces of a $0.6\ \textrm {m} \times 1.2\ \textrm {m} \times 0.6\ \textrm {cm}$ towing plate with a random-roughness SHPo layer and used the drag measurement system of the facility to measure the drag of the entire plate, here, we develop a novel towing plate that allows measuring of the shear force on a $4\ \textrm {cm} \times 7\ \textrm {cm}$ surface sample by replacing a part of the towing plate with the shear-sensing system. Figure 3(c) is a cross-sectional top view of the $0.7\ \textrm {m} \times 1.4\ \textrm {m} \times 2\ \textrm {cm}$ towing plate, showing how a section near its trailing end is replaced with the low-profile shear sensor of figure 3(b). Note that the surfaces of the sensor, especially the front side, are flush with the surfaces of the towing plate, exemplifying why the shear sensor was made low profile. The sensor plate (nearly 20 mm thick after adding the back cover) is made slightly thinner than the towing plate (20 mm thick) to ensure that, after its front surface is adjusted to be flush with the surrounding surfaces, its back surface can be adjusted to never protrude into the water and cause a form drag.
As shown in figure 4, the towing plate is suspended vertically in the tank by two struts, which in turn are hung from a carriage rail. As can be seen from the figure, the pivot axis is kept at an angle from the moving direction. This design is to reduce the yaw angle caused by the asymmetry associated with our towing plate. The asymmetry cannot be avoided because our towing plate is too thick for the existing clamp in the facility and thus has to be screwed into the centre from one side. Since the towing plate is not completely symmetric, a pressure difference between the two sides of the plate causes the plate to turn. However, the non-parallel rotating axis lets the plate assume an angle of attack, which balances the asymmetric pressure. Meanwhile, an inclinometer is attached to the top of the towing plate so that the yaw angle can be measured in real time, which was less than 5 $^{\circ }$ throughout the test. The technical team at the Davidson Laboratory supported the experiments.

Figure 4. High-speed towing tank experimental set-up. (a) Design of the honeycomb towing plate with streamlined ends for towing tests. (b) Schematics (not drawn to scale) of towing tank experimental set-up. (c) Picture of the towing plate placed in water at rest.
Compared with the previous towing tank test by Aljallis et al. (Reference Aljallis, Sarshar, Datla, Sikka, Jones and Choi2013), the towing plate shown in figure 4 is made wider (taller) (0.7 m) than the previous 0.6 m to increase the immersion depth of testing and thicker (20 mm) than the previous 6.35 mm to ensure the  $\sim$20 mm shear sensor, which replaces a portion of the towing plate, is flush with the plate surfaces on both sides, as shown in figure 3(c). The thicker towing plate poses two challenges: (i) difficulty of handling the much heavier plate ( $\sim$70 kg) and (ii) large splash at the leading edge of the thicker plate at high speed. To solve the first problem, i.e. to reduce the weight of the towing plate, the plate is made out of a honeycomb structure, which decreases the weight by more than 50 % while keeping the structural strength. A light panel of aluminium honeycomb covered with two thin aluminium sheets was custom made by Kerr Panel Manufacturing (KPM) (Henderson, Colorado, USA), as shown in figure 4(a). The solid supporting bars on the sides (top and bottom) are used to increase the strength of the whole plate. All seams and gaps are sealed using underwater epoxy to ensure watertight sealing of the honeycomb. A portion of the honeycomb panel is replaced with the sensor plate holder, which is machined to accept two floating elements on two shear sensors (Xu et al. Reference Xu, Arihara, Tong, Yu, Ujiie and Kim2020b). To solve the second problem, i.e. to reduce the splash and wave during high-speed tests, the leading and trailing ends of the towing plate are streamlined (unlike the straight sharp edges used by Aljallis et al. (Reference Aljallis, Sarshar, Datla, Sikka, Jones and Choi2013)), following the National Advisory Committee for Aeronautics (NACA) 0015 airfoil formula. As shown in figure 4(a), the two end sections were precision machined to the prescribed shape by American Best Engineering (Burbank, California, USA) and inserted into the honeycomb panel to complete a light, streamlined towing plate.
With the speed and direction of the towing plate controlled precisely by the existing instruments in the facility, each surface sample was mounted on the floating element of the shear sensor installed in the lower slot of the two shown in figure 4(b,c) and tested by a set of multiple towing runs across the entire tank length ( $\sim$90 m). Only the lower slot was used for this study in order to keep the immersion depth of the sample surface invariant for all flow tests. Kept for weeks in the towing tank before the tests, the water in contact with the sample surface ( $\sim$37 cm below the free surface) is considered to be nearly saturated (only slightly undersaturated) with air.
To assess the accuracy and repeatability of the experimental set-up and test procedure, the shear stress is measured on a smooth surface. Figure 5 presents the measured and expected values of skin-friction coefficient  $C_f$ against Reynolds number $Re_x$. For the measured data obtained from three separate test runs, the skin-friction coefficient is calculated from $C_f = 2F/(\rho U^2A)$, where $F$ is the measured shear force, $A$ is the sample area, $\rho$ is the water density and $U$ is the towing speed. For the expected values in turbulent boundary-layer flows over a smooth flat plate, the skin-friction coefficient is calculated from the empirical correlation by Schlichting (Reference Schlichting1979):
 \begin{equation} C_{f}=(2\log Re_x-0.65)^{-2.3}. \end{equation}
Figure 5. Comparison between measured and empirical (Schlichting Reference Schlichting1979) skin-friction coefficients on a smooth surface sample, validating the measurement accuracy. The deviation of less than 3 % is consistent with the bias ( $<$5 %) and random ( $<$1 %) error calculated for the same shear sensor in Xu et al. (Reference Xu, Arihara, Tong, Yu, Ujiie and Kim2020b)
To calculate  $Re_x = Ux/\nu$, where $x$ is the distance from the leading front of the towing plate to the location of interest and $\nu$ is the kinematic viscosity of water, the centre of the sample ( $x = 110$ cm) is used for the distance, because the sample size (7 cm) is much smaller than the nominal distance ( $\sim$1.1 m; see figure 3c). Comparing the measured data with the empirical values, the error is found to be less than 3 % over the entire range of $Re_x$ used in this study. The results also agree with the uncertainty analysis of Xu et al. (Reference Xu, Arihara, Tong, Yu, Ujiie and Kim2020b), which reported a bias error and random error smaller than 5 % and 1 %, respectively, of the measured shear force.
3. Results and discussion
Figure 6 summarizes the results of drag reduction experiments in the towing tank with  $Re_x$ from $2.37\times 10^{6}$ to $1.12\times 10^{7}$ (towing speed from 2.13 m s $^{-1}$ to 10.06 m s $^{-1}$). Three SHPo surfaces with trenches of $P = 50\ \mathrm {\mu }$m and $GF = 90\,\%$ were tested as well as one SHPo surface with random roughness for comparison. Recall two of the three trench surfaces have trenches uninterrupted over the entire sample length (named P50-GF90-1), and one has its trenches partitioned into two in length (named P50-GF90-2), as shown in figure 2(a). Each trench surface sample was flow tested by a set of 9 towing runs, and the random roughness surface was flow tested by a set of 5 runs. Reliability and repeatability of the developed measurement approach have been confirmed by repeating the test runs on smooth surfaces three times and comparing the results with empirical values, as explained in the previous section with figure 5. The repeatability was further supported as two separate test runs on two different samples of P50-GF90-1 surface showed nearly identical results as shown in figure 6(a). For the 9 test runs of different flow speeds for each sample (or 5 runs for Random), each run was started in $\sim$30 s after the sample was submerged in water. After each test run, a picture of the sample was taken while in the water to record the wetting area. Then, the sample was taken out of water by swinging the entire towing plate up around the carriage rail and dried with high purity nitrogen. The towing plate was then swung back into the water for the next run. In figure 6(a), the drag ratio data are plotted against the friction Reynolds number, chosen to help comparison with various other studies performed under different flow conditions. The friction Reynolds number is defined as $Re_\tau =u_\tau \delta /\nu$, where $u_\tau$ is the friction velocity, $\delta$ is the boundary-layer thickness and $\nu$ is the kinematic viscosity. The friction velocity $u_\tau =(\tau /\rho )^{1/2}=(0.5C_fU^2)^{1/2}$, where $\tau$ is the wall-shear stress. The boundary-layer thickness is from the empirical value $\delta =0.37x(Re_x)^{-0.2}$ by Schlichting (Reference Schlichting1979). The regular Reynolds number corresponding to the friction Reynolds number is shown on top of the graph. For the random roughness sample tested for comparison, the drag ratio stayed near 1.0 at low speeds but increased at high Reynolds numbers, corroborating a similar undesirable trend of the previous towing tank study by Aljallis et al. (Reference Aljallis, Sarshar, Datla, Sikka, Jones and Choi2013) added in the graph.

Figure 6. Main experimental results. (a) Drag ratio of SHPo surfaces (with respect to smooth surface) obtained from the tow tank experiments;  $P$ and $GF$ indicate the pitch ( $\mathrm {\mu }$m) and gas fraction (%) of the trench structures, respectively, and Random represents the random roughness structure. The $x$-axis is scaled for the friction Reynolds number of the smooth surface $Re_{\tau 0}$, and the corresponding regular Reynolds number $Re_x$ is marked on the top. On the three trench surfaces (solid symbols), the drag ratio decreases with flow speed until $Re_x$ between ${\sim }6\times 10^{6}$ and ${\sim }8\times 10^{6}$, after which wetting overshadows the decrease. Note the two different samples of P50-GF90-1 are drawn using the same symbol. The random structure increases the drag, confirming Aljallis et al. (Reference Aljallis, Sarshar, Datla, Sikka, Jones and Choi2013). On the projected trench surfaces (hollow symbols), estimated by accounting for the negative contribution of the wetted portions, the drag ratio continues to decrease with Reynolds number, suggesting the full potential of the tested surfaces. (b) Pictures of trench SHPo surfaces in the towing tank after each testing speed, taken by a regular camera outside the water. Dark area indicates wetted state (plastron lost) while bright area indicates dewetted state (plastron retained). The other P50-GF90-1 sample showed similar images to the ones shown.
All the trench surfaces showed a trend of the drag ratio decreasing (i.e. drag reduction increasing) with the Reynolds number at low-to-mid speeds, reaching below 0.8 (i.e. drag reduction  $>$20 %) over medium speeds (as low as 0.75 with P50-GF90-1 at $Re_{\tau 0}$ $\sim$3500 and 0.73 with P50-GF90-2 at $Re_{\tau 0}$ $\sim$4400). However, the trend reversed at higher speeds, with P50-GF90-1 losing all its drag reduction and P50-GF90-2 still retaining 12 % of drag reduction at the highest speed tested. This down-and-up trend of the drag ratio can be explained by the wetting behaviour of the SHPo surfaces observed via an optical camera, as presented in figure 6(b); the wetted area (i.e. lost plastron appearing dark) increases as speed increases. Note that dewetted areas appear bright due to the total internal reflection on air–water interfaces, and wetted areas appear dark due to the lack of them. To ensure the accuracy of image processing, we first calibrated the threshold values using a completely dewetted surface (i.e. wetting ratio = 0 %) and completely wetted surface (i.e. wetting ratio = 100 %) as the two boundary conditions. Then, the same threshold values were used to interpret all the pictures of different wetting ratios taken under the same observation directions and lighting condition. At low speeds, when the surface was found to be mostly dewetted (i.e. retained plastron appearing silvery bright), the drag ratio decreased with the Reynolds number, consistent with some previous experimental studies (Srinivasan et al. Reference Srinivasan, Kleingartner, Gilbert, Cohen, Milne and McKinley2015) and all numerical studies (Min & Kim Reference Min and Kim2004; Busse & Sandham Reference Busse and Sandham2012; Park et al. Reference Park, Park and Kim2013; Lee, Jelly & Zaki Reference Lee, Jelly and Zaki2015). At high speeds, however, the wetted (dark) areas expanded, negating and eventually overshadowing the drag reduction created by the dewetted (bright) areas. The wetting generally started from the upstream side of the sample and propagated downstream as the flow speed and Reynolds number increased, suggesting shear-induced wetting (Wexler et al. Reference Wexler, Jacobi and Stone2015), as shown for P50-GF90-1 (only one shown) and P50-GF90-2 in figure 6(b). The image distortions were caused by slight variations in camera orientation and did not affect the results.
The above unmistakable connection between increased wetting and compromised drag reduction underscores the importance of retaining plastron for SHPo drag reduction in open-water flows. Recall that previous studies (Emami et al. Reference Emami, Hemeda, Amrei, Luzar, Gad-el Hak and Tafreshi2013; Xu et al. Reference Xu, Sun and Kim2014) confirmed that SHPo surface with smaller pitch would have a more stable air–water meniscus, i.e. more persistent plastron. This trend was also found in the present study as the plastron on the 50  $\mathrm {\mu }$m pitch surfaces was found to be stable enough to complete the experiments but 100 $\mathrm {\mu }$m pitch was not. Note that the condition of the current study (e.g. $\sim$37 cm deep; little splash and bubbles) is less favourable to the plastron compared with the boat tests (e.g. 10–16 cm deep; many entrained bubbles) of Xu et al. (Reference Xu, Grabowski, Yu, Kerezyte, Lee, Pfeifer and Kim2020a). For 50 $\mathrm {\mu }$m pitch, the plastron was found to be more stable when the trenches were partitioned into two in length (i.e. P50-GF90-2) to resist the shear-induced wetting as well as to halt the wetting propagation in the case of accidental wetting. Disruption of plastron by one partition did not compromise the drag reducing capability for the current sample. Note that the remaining air lengths in both of the divided trenches in P50-GF90-2 are similar to those in the undivided trenches in P50-GF90-1, as shown in figure 6(b), corroborating the shear-drainage model (Wexler et al. Reference Wexler, Jacobi and Stone2015), which predicts the air remaining inside the trench has a maximum length regardless of the trench length. This finding provides important guidelines when designing large area microtrench SHPo surfaces in the future.
The direct link between the loss of plastron and the loss of drag reduction mentioned above motivates us to search for a quantitative relationship between them. Let us investigate whether the images recorded after each test run, including figure 6(b), can be utilized to quantitatively explain the down-and-up trend of drag ratio in figure 6(a). We start by proposing that the dewetted and wetted areas of a SHPo surface can be assigned with own drag ratios, so that the total drag ratio of the entire surface  $D_{total}$ can be expressed as
 \begin{equation} D_{total}=D_wS_w+D_cS_c=D_wS_w+D_c(1-S_w), \end{equation}
where  $S_w$ and $S_c$ are the area ratios and $D_w$ and $D_c$ are the drag ratios of the wetted (in Wenzel state) and dewetted (in Cassie–Baxter state) surfaces, respectively. For the wetted area, $S_w$ was extracted by image processing the recorded pictures, and $D_w$ was obtained in a separate experiment by intentionally wetting the entire SHPo surface and measuring its wetted drag ratio using the shear sensor in the tow tank. Recognizing that the microtrench surface whose entire area is fully wetted is essentially a traditional ‘riblet’ surface, in figure 7(a) we plot the drag ratio of completely wetted microtrench surfaces against the non-dimensionalized square root of the cross-section $l_g^+ =\sqrt {S}u_\tau /\nu$, where $S$ is the cross-sectional area of a trench, as riblet reports have done (Bechert et al. Reference Bechert, Bruse, Hage, Van der Hoeven and Hoppe1997; García-Mayoral & Jimínez Reference García-Mayoral and Jimínez2011). Considering the differences in the cross-sectional shape and the width-to-depth ratio between the current trenches and the riblets, it is indeed reasonable to conclude that the friction drag on the wetted region follows that on riblet surfaces.

Figure 7. (a) Similarity of completely wetted trench SHPo surfaces and traditional riblet surfaces. The relationship between drag ratio and dimensionless cross-sectional size  $l_g^+$ for two different trench SHPo surfaces fully wetted over the entire area over a range of Reynolds numbers shows a similar trend as previous experimental (Bechert et al. Reference Bechert, Bruse, Hage, Van der Hoeven and Hoppe1997) and numerical studies (García-Mayoral & Jimínez Reference García-Mayoral and Jimínez2011) on riblets structure. (b) The projected drag ratios of SHPo surfaces obtained from the tow tank experiments are plotted as function of dimensionless shear free interface width $d^{+}$ and compared with the numerical results by Park (Reference Park2015) and Rastegari & Akhavan (Reference Rastegari and Akhavan2018).
With  $D_{total}$ measured during the flow experiments, $S_w$ extracted from image processing and $D_w$ estimated from the riblet data, $D_c$ can now be obtained from (3.1). Representing the drag ratio obtainable if the entire SHPo surface retained a proper plastron at all speeds, $D_c$ was added in figure 6(a) as hollow symbols connected by dotted lines. These ‘projected’ data by hypothetically assuming no plastron loss are in agreement with the numerical results that the drag ratio of a SHPo trench surface decreases with Reynolds number (Min & Kim Reference Min and Kim2004; Busse & Sandham Reference Busse and Sandham2012; Park et al. Reference Park, Park and Kim2013; Lee et al. Reference Lee, Jelly and Zaki2015). They also suggest that a larger pitch or gas fraction could drop the drag ratio further down in large-scale turbulent boundary-layer tests at high Reynolds numbers, similar to the trend found in small-scale turbulent boundary-layer tests at low Reynolds numbers by Park et al. (Reference Park, Sun and Kim2014), if the entire SHPo surface could remain properly dewetted.
Several numerical studies have shown a strong correlation between the drag ratio and the dimensionless width of the shear-free interface,  $d^+=du_\tau /\nu$, where $d$ is the width of shear-free interface ( $d = P\times GF$ is the trench width in our geometry). Figure 7(b) compares the above projected drag ratio $D_c$ with the numerical results by Park (Reference Park2015) and Rastegari & Akhavan (Reference Rastegari and Akhavan2018). Park (Reference Park2015) assumed that the air–water interface is flat and flush with the top of the trenches. Rastegari & Akhavan (Reference Rastegari and Akhavan2018) assumed an inward-bending air–water interface at different angles. Data for a 30 $^{\circ }$ bending angle (into the trench) are used as a reasonably representative angle for the current study because the air–water interface bends inwardly while it is pinned on the trench top in our open-water experiments, as theoretically predicted and visually observed. Unfortunately, the range of $d^+$ considered in the numerical studies was far beyond (larger than) what is practical for experimental studies, including the present study. This inability to test SHPo surfaces with a large air–water interface experimentally makes it difficult to confirm the trend of drag ratio at large $d^{+}$, where the downward trend should level off. However, if one reviews the entire range starting from a smooth surface ( $d^{+} = 0$, $\text {drag ratio} = 1$) in the figure, the experimental results in this study show the same overall trend reported in the numerical studies at small $d^{+}$. This agreement is rather important considering that there have been considerable discrepancies between numerical and experimental results regarding the drag reduction capability of SHPo surfaces in highly turbulent flows, as explained in the Introduction and background section and also by others (Golovin et al. Reference Golovin, Gose, Perlin, Ceccio and Tuteja2016; Xu et al. Reference Xu, Grabowski, Yu, Kerezyte, Lee, Pfeifer and Kim2020a).
4. Conclusions
We have developed a novel towing plate installed with a low-profile shear sensor and obtained significant (up to 27 %) drag reductions on microtrench SHPo surfaces in turbulent boundary-layer flows in a high-speed towing tank. The results also confirmed the important relationship between the drag reduction and Reynolds number predicted by numerical studies. The drag reduction was found to increase with Reynolds number and the width of the microtrench expressed as a dimensionless shear-free interface  $d^+=du_\tau /\nu$, as predicted by Park (Reference Park2015). Moreover, by dividing the microtrenches into two parts in length, the SHPo surface has shown improved plastron retainment and enhanced drag reduction, making the trench length an important parameter to consider for large-area applications in the future. Although silicon-based SHPo surface samples were used in this study, whole-Teflon surfaces of a similar geometry are feasible using the hot embossing process, as demonstrated in Xu, Liu & Kim (Reference Xu, Liu and Kim2020c) and Li et al. (Reference Li, Yu, Zheng, Zhao, Choi and Sun2018), which is scalable for mass manufacturing.
Acknowledgements
The authors appreciate the assistance from C.-H. Choi, D. Song and the Davidson Lab at Stevens Institute of Technology. This work was supported by DARPA HR0011-15-2-0021, NSF 1336966, ONR N000141110503, and NSF 1720499.
Declaration of interests
The authors report no conflict of interest.


 Open access