


INTRODUCTION
Urban development is considered one of the major threats to biodiversity (McKinney Reference McKinney2002, Reference McKinney2006, McDonald et al. Reference McDonald, Marcotullio, Güneralp, Elmqvist, Fragkias, Goodness, Güneralp, Marcotullio, McDonald, Parnell, Schewenius, Sendstad, Seto and Wilkinson2013); however, species responses to increasing urbanization vary considerably among and within groups (e.g., McKinney Reference McKinney2008). For example, several studies found positive correlations between human population density and species richness of birds and plants, whereas correlations were weaker for mammals, and frequently reversed for reptiles (Adler & Tanner Reference Adler and Tanner2013). Cities host many bird species worldwide (Fraissinet & Fulgione Reference Fraissinet and Fulgione2008, Ferenc et al. Reference Ferenc, Sedláček, Fuchs, Dinetti, Fraissinet and Storch2014), but the response of birds to urbanization is variable (e.g., Jokimäki et al. Reference Jokimäki, Suhonen and Kaisanlahti-Jokimäki2016). One way to evaluate the impact of urbanization on species richness is to compare values observed in urban areas with those found in natural areas located in the same region. This is not an easy task because of the many factors influencing species richness, the most obvious of which is the size of the areas that are compared.
In designs obtained by adding a progressively larger number of equally sized areas, species richness of sites with different areas can be compared by using sample-based rarefaction curves (see Gotelli & Colwell Reference Gotelli and Colwell2001). When sampled areas are isolates of different size, a possible approach is to derive an expected number of species per unit area by using a function that models the species–area relationship (SAR; i.e., the increase in species richness with increasing area). Because of the dependence of species richness on area size, some authors refer to species density, calculated as the number of recorded species divided by area (e.g., Aronson et al. Reference Aronson2014). However, the SAR is not linear, thus one cannot divide the total species richness by the area and report the result as species per unit area (e.g., Fattorini Reference Fattorini2006).
Although several mathematical functions have been proposed to model SARs, comparative studies identify the power function S = CAz (where S represents species richness, A the area and C and z are fitted parameters) as the model that, in general, best fits empirical data and is best supported by ecological theories (e.g., Triantis et al. Reference Triantis, Guilhaumon and Whittaker2012, Matthews et al. Reference Matthews, Guilhaumon, Triantis, Borregaard and Whittaker2016). The power function can be linearized by logarithmic transformation of S and A: log S = log C + z log A. In this form, the SAR can be easily modelled using regression approaches, with log C and z being, respectively, the intercept and the slope of the fitting line. Because C is the ratio of species richness (S) to Az, it represents the expected number of species per unit area and can be used to compare different SARs.
On this basis, it is possible to test the influence of urbanization on species richness by comparing SARs constructed from a series of urban and natural areas. Quite surprisingly, however, this approach has been rarely explored. Pautasso et al. (Reference Pautasso2011) compared avian SARs in worldwide urbanized and semi-natural ecosystems and showed that C and z values did not vary significantly between urbanized and more natural ecosystems. However, the areas sampled in their study were relatively small and homogeneous and therefore did not reflect the full complexity of urban areas such as large cities (the largest urban habitat was only 15.3 km2).
MacGregor-Fors et al. (Reference MacGregor-Fors, Morales-Pérez and Schondube2011) constructed SARs for birds living in human settlements and shrublands in west-central Mexico. They compared the z and C values for the two SARs, finding that z was higher in human settlements and C was higher in shrublands. However, their study had two important limitations: the sample size was relatively small (13 human settlements and only 5 shrublands) and the two SARs differed significantly in their slopes. Although z and C are independent parameters, when z increases, the fitting line tends to be more vertical, and hence it has more chances to intercept the y-axis at lower values (Gould Reference Gould1979). Consequently, SARs with higher z tend, on average, to have lower C. Due to this negative relationship, C values should be compared only for regression lines having the same slopes (i.e., between parallel lines; see Fattorini et al. Reference Fattorini, Borges, Dapporto and Strona2017). Ferenc et al. (Reference Ferenc, Sedláček, Fuchs, Dinetti, Fraissinet and Storch2014) compared the SAR obtained for breeding species recorded from 41 European towns (whole town areas) with that generated by constructing virtual species assemblages obtained by random resampling of one to nine grid cells of 5 × 5 km. As a result, the area pertaining to the simulated assemblages was larger than the towns themselves. Moreover, the authors compared z values, but not C values.
In the present paper, we used data of bird species richness from urban and natural areas in Italy to test if the respective SARs differ in their C values (i.e., the average species richness per unit area). Our study is the first to satisfy a number of desirable characteristics: (1) it was based on relatively large data sets to obtain reliable estimates of regression parameters for urban and natural SARs; (2) it used observed values (not simulated assemblages) of avian richness for both urban and natural areas; (3) it compared SARs that largely overlap in area values; (4) it compared intercepts (C values) for SARs that have similar slopes (z values); and (5) it used urban area data for whole towns, not urban habitats.
We formulated three alternative hypotheses: (1) if urbanization depresses species richness, the urban SAR should have a lower C value than the SAR constructed for natural areas; (2) if urbanization increases species richness, the urban SAR should have a higher C value; and (3) if urbanization does not influence bird species richness, we expect no significant differences in C values.
METHODS
We compiled data on the bird species richness of 34 Italian urban areas (including large cities and towns; hereafter towns for simplicity) and 53 nature reserves (see Tables S1 and S2 and Fig. S1 in Supplemental Material; available online). Reserves were always outside towns. We used Italian towns because Italy is the country with the largest number of published bird atlases of urban areas (Dinetti et al. Reference Dinetti, Cignini, Fraissinet and Zapparoli1996, Ferenc et al. Reference Ferenc, Sedláček, Fuchs, Dinetti, Fraissinet and Storch2014). Values of bird richness refer to species breeding and probably breeding and were originally collected with a variety of methods (i.e., typically atlases based on different types of grid cells for towns and transects for natural areas), with the number of years of observations depending on the extent of the study area. This variety of methods was not relevant for our purposes, because we were only interested in obtaining a reliable value of total species richness for each area. We checked that values of avian richness reported in the scrutinized literature were considered to be as complete as possible by the authors that performed bird censuses.
In addition to area size, we included the following variables as possible factors affecting bird species richness: (1) average elevation, as a proxy for environmental diversity (e.g., Newmark Reference Newmark1986, Allouche et al. Reference Allouche, Kalyuzhny, Moreno-Rueda, Pizarro and Kadmon2012); (2) annual minimum, maximum and average temperatures, because high temperatures may reduce the energetic requirements of endotherms, according to the thermoregulatory load hypothesis (e.g., Lennon et al. Reference Lennon, Greenwood and Turner2000); and (3) precipitation, because water availability influences plant productivity (e.g., Hawkins et al. Reference Hawkins2003). For towns, we also considered the number of inhabitants (municipality population) and population density as proxies of human impact (see Fattorini et al. Reference Fattorini, Galassi and Strona2016). An alternative measure for environmental diversity might be elevational range; however, in general, elevational ranges were of only a few metres for towns and, in the case of natural areas, the ranges were strongly correlated with average elevations (r = 0.813, p < 0.0001). Thus, we used only average elevation.
Values of areas of towns and reserves were taken from the same literature used to obtain values of species richness, thus corresponding to the area investigated by the authors that recorded species richness. For a few towns and reserves, the authors did not provide this datum. In these cases, we assumed that authors investigated the whole study area and we used the official areas reported in institutional documents. Values of areas of towns (range = 0.8–415.9 km2, mean ± SD = 67.930 ± 90.758, n = 34) and reserves (range = 0.3–875.0 km2, mean ± SD = 95.857 ± 167.391, n = 53) overlapped (t-test for log10-transformed values: t = 1.988, df = 85, p = 0.222). Elevation values for towns were those of the places of the town halls. Elevations of reserves were calculated as the average between the maximum and minimum altitude using Google Earth satellite maps when not given from the literature sources used for species richness. Climatic data were those recorded from the meteorological stations located within or near the study towns and reserves as given in the Enea climatic archive (http://clisun.casaccia.enea.it/Pagine/Index.htm). These values represented average values calculated over periods of at least 10 years for temperatures and at least 5 years for precipitation. Gaps were filled using data from other meteorological stations or obtained by interpolation. For most towns (83%), we used temperatures from the meteorological stations located within towns, which reflect the possible urban heat-island phenomenon. For Ostia, San Donà di Pieve, Crema, Marcon, Cossato and Senigallia, we used data from stations close to the town or obtained by interpolation. These towns have small numbers of inhabitants, thus the possible impact of the urban heat-island phenomenon is negligible. Data about numbers of inhabitants refer to the municipality population as given in the Enea archive (http://clisun.casaccia.enea.it/Pagine/Comuni.htm), except for Lido di Ostia, which was taken from Wikipedia (https://it.wikipedia.org/wiki/Ostia_%28Roma%29).
We tested the importance of these variables as correlates of bird richness using ordinary least squares regressions. We used the corrected Akaike information criterion (AICc) for model choice by comparing all variable combinations and selected models with the lowest AICc values. A difference of larger than 2 between AICc values was considered evidence that a model performed better than the others (see Burnham & Anderson Reference Burnham and Anderson2002). All variables were log10 transformed prior to analysis to increase normality. We used analysis of covariance to test for differences in C and z values between SARs of urban and rural areas (Fattorini et al. Reference Fattorini, Borges, Dapporto and Strona2017). Errors refer to standard errors and significance was set at p = 0.05. Analyses were performed using SAM (Spatial Analyses in Macroecology) v. 4.0 software (Rangel et al. Reference Rangel, Diniz-Filho and Bini2010) and Past 3.0 (Hammer et al. Reference Hammer, Harper and Ryan2001).
RESULTS
For the birds of the Italian towns, four models out of 255 were selected on the basis of the AICc. Town area was included in all these models. The first two models included two variables: area and average or minimum temperature. The other two models included area, precipitation and average or minimum temperature. For the birds of nature reserves, two models out of 63 were selected on the basis of the AICc. The first model included area and minimum temperature, the second included area and average temperature (Table 1).
Table 1. Coefficients ± standard errors and associated probability levels (in parentheses) of ordinary least squares best-fit models for bird species richness and environmental variables in Italian towns and nature reserves. Degrees of freedom for F values are 2,31 for Models 1 and 2 of urban areas, 3,30 for Models 3 and 4 of urban areas and 2,50 for both models of nature reserves. AICc = Akaike information criterion.

For towns, species richness was significantly correlated with area (Pearson correlation coefficient, r = 0.805, p = 0.0001, n = 34) and population density (r = –0.487, p = 0.003, n = 34). For nature reserves, species richness was correlated with area (r = 0.725, p = 0.0001, n = 53) and elevation (r = 0.378, p = 0.005, n = 53).
Breeding bird species richness (S) increased with town area (A) according to the power function log(S) = (1.500 ± 0.039) + (0.182 ± 0.024) log(A) (R 2 = 0.648, F 1,32 = 58.933, p < 0.0001; Fig. 1). The relationship of bird species richness with area for the reserves was log(S) = (1.492 ± 0.041) + (0.193 ± 0.026) log(A) (R 2 = 0.526, F 1,51 = 56.596, p < 0.0001; Fig. 1). Thus, the expected mean numbers of species per unit area (C values) were 31.6 species per km2 for the urban areas and 31.1 species per km2 for the nature reserves, respectively. The two SARs showed similar z (homogeneity of slopes, F 1,84 = 0.049, p = 0.826) and C values (F 1,84 = 0.080, p = 0.777).
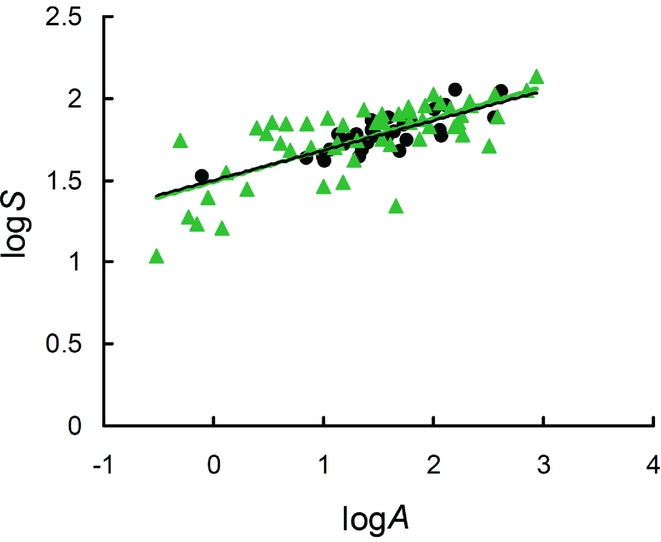
Figure 1. Log–log species–area relationships for birds in towns (dots) and natural areas (triangles) in Italy. logS = logarithm of number of species; logA = logarithm of area (km2).
DISCUSSION
Area was identified as the most important predictor of bird species richness in both towns and nature reserves, although minimum and mean temperature were included as additional variables in the best-fit models. Relationships between bird richness and temperatures were negative, which seems to be in contrast with the thermoregulatory load hypothesis (Lennon et al. Reference Lennon, Greenwood and Turner2000). However, these unexpected correlations can be explained by the so-called peninsula effect: bird species richness in the Italian peninsula decreases from north to south as a result of complex environmental and palaeo-ecological factors (Battisti & Contoli Reference Battisti and Contoli1997, Reference Battisti and Contoli1999, Battisti & Testi Reference Battisti and Testi2001, Battisti Reference Battisti2014), whereas temperature increases along the same latitudinal gradient. Human population and human population density were not included in the best-fit models for the urban birds, although species richness was negatively correlated with population density in pairwise correlations. This suggests that the negative effect of human density in multiple regression models is overwhelmed by the stronger influence of area and climatic variables.
SARs for urban and rural areas of our study were virtually indistinguishable. The lack of statistical difference in z values made it possible to compare the respective C values. It has been postulated that habitat island systems should have lower z values than true island systems (MacArthur & Wilson Reference MacArthur and Wilson1967, Rosenzweig Reference Rosenzweig1995). The z values found in the present study (z = 0.18 and z = 0.19 for urban and rural areas, respectively) were lower than those expected for true islands (z = 0.25–0.33) and very close to the median value reported for habitat islands (z = 0.22) (Matthews et al. Reference Matthews, Guilhaumon, Triantis, Borregaard and Whittaker2016). They are also consistent with those found by Ferenc et al. (Reference Ferenc, Sedláček, Fuchs, Dinetti, Fraissinet and Storch2014) for birds of European towns (z = 0.21) and regional assemblages (z = 0.18), and very similar to the slope calculated by MacGregor-Fors et al. (Reference MacGregor-Fors, Morales-Pérez and Schondube2011) for towns in west-central Mexico (z = 0.19). By contrast, they were much higher than the slope obtained for the Mexican shrublands (z = 0.07; MacGregor-Fors et al. Reference MacGregor-Fors, Morales-Pérez and Schondube2011). This strong difference might be due to the fact that the SAR for the Mexican shrublands was based on few data and strongly conditioned by the lowest value (see Fig. 2 in MacGregor-Fors et al. Reference MacGregor-Fors, Morales-Pérez and Schondube2011). Pautasso et al. (Reference Pautasso2011) obtained a slope value of z = 0.27 for urban plots, which was not significantly different from the values for open and forest habitats of their data set (z = 0.18 and z = 0.19, respectively). These values are also consistent with those found in our study.
The slope of our urban SAR is also much lower than that calculated for holm oak wood fragments within the city of Rome (z = 0.26; Arca et al. Reference Arca, Battisti and Fraticelli2012), which indicates that green spaces within a city can be regarded as isolates more than towns within a natural and semi-natural landscape. On the other hand, our z values for urban and reserve SARs were virtually identical to that found for oak wood fragments in an agricultural landscape (z = 0.18; Frank & Battisti Reference Frank and Battisti2005) and similar to that obtained for oak wood fragments embedded in a landscape characterized by agricultural plots and sprawl urbanization (z = 0.12; Lorenzetti & Battisti Reference Lorenzetti and Battsiti2006).
Ferenc et al. (Reference Ferenc, Sedláček, Fuchs, Dinetti, Fraissinet and Storch2014) suggested caution in interpreting the lack of difference in the slopes of SARs between urban and regional species assemblages because the area pertaining to their simulated assemblages was larger than the towns themselves. Our approach was based on observed values of species richness in nature reserves whose area values overlapped with those of the towns. Thus, the homogeneity of slopes in our study cannot be influenced by differences in the ranges of the area between the two data sets. However, similar slopes can arise from different mechanisms. Spatial turnover among birds of reserves might be due to differences in their habitats. Towns should be environmentally more similar to each other, but heterogeneity in large cities (which host a variety of habitats within their borders) might be an important factor promoting species richness.
The lack of difference between C values of SARs indicated that the expected mean number of species per unit area did not differ between urban and natural areas. The C values found in our study were similar to those calculated by Ferenc et al. (Reference Ferenc, Sedláček, Fuchs, Dinetti, Fraissinet and Storch2014) for the birds of European towns (31.9 species per km2) and in their virtual assemblages (30.8 species per km2; see Fig. 2 in Ferenc et al. Reference Ferenc, Sedláček, Fuchs, Dinetti, Fraissinet and Storch2014). The C values calculated by Pautasso et al. (Reference Pautasso2011) were C = 47.9, C = 22.9 and C = 30.2 for forest, open and urban habitats, respectively. These values do not differ significantly from one another and are also very similar to those obtained in our study. MacGregor-Fors et al. (Reference MacGregor-Fors, Morales-Pérez and Schondube2011) obtained 24.0 species per km2 for the natural areas and 11.5 species per km2 for the urban areas, which appear to be very small, possibly because of the impact of the lowest richness value in their small sample.
According to Pautasso et al. (Reference Pautasso2011), the lack of difference between urbanized and more natural ecosystems could be a consequence of the positive large-scale association between avian richness and human population density. This explanation may be reasonable for their worldwide data set, where areas suitable for urban development might often coincide with regions of high biodiversity, as both tend to have high productivity (e.g., Gaston & Evans Reference Gaston and Evans2004). In our case, however, values of avian richness were taken for both towns and nature reserves that are scattered within the same territory, which reduces this possible bias. More importantly, we found that, in pairwise correlations, avian richness in urban areas was negatively correlated with human population density. Thus, our results suggest that, in Italy, urban areas have values of avian richness similar to those of natural areas, despite the negative influence of human density.
European towns provide suitable habitats for many bird species (Kelcey & Rheinwald Reference Kelcey, Rheinwald and Katharinen2005, Caula et al. Reference Caula, Sirami, Marty and Martin2010). In particular, urban areas can be more productive for some species and can hold denser populations than neighbouring rural areas because the mild mesoclimate, greater food and nest site availability and fewer competitors and predators (e.g., Sodhi et al. Reference Sodhi, James, Warketin and Oliphant1992, Parker Reference Parker, Bird, Varland and Negro1996, Salvati et al. Reference Salvati, Manganaro, Fattorini and Piattella1999, Adler & Tanner Reference Adler and Tanner2013) may counteract the negative effects associated with high human population density (Adler & Tanner Reference Adler and Tanner2013). Our finding that avian SARs did not differ between urban and natural areas further underlines the possible importance of urban areas in biodiversity conservation. However, species richness cannot be the only criterion to inform conservation priorities, because it does not take into account the different conservation values of species. For example, urban areas might host rich avian communities mainly composed of species with low conservation value (e.g., McKinney Reference McKinney2008, Adler & Tanner, Reference Adler and Tanner2013). Thus, future research should compare urban and natural areas by also considering the ecology and conservation value of the species involved.
ACKNOWLEDGEMENTS
We are grateful to D. Bergamaschi for his help with Fig. S1 and to N. Polunin and three anonymous referees for their comments.
FINANCIAL SUPPORT
None.
CONFLICT OF INTEREST
None.
ETHICAL STANDARDS
None.
Supplementary material
To view supplementary material for this article, please visit https://doi.org/10.1017/S0376892918000048


