


Introduction
Food insecurity, “the uncertainty of having, or [being] unable to acquire, enough food due to insufficient money or other resources” (Coleman-Jensen et al. Reference Coleman-Jensen, Rabbitt, Gregory and Singh2019), has become a leading indicator of economic well-being in the United States for two central reasons. First, the extent of the problem is enormous—over 37 million Americans lived in food-insecure households in 2018 (Coleman-Jensen et al. Reference Coleman-Jensen, Rabbitt, Gregory and Singh2019). Second, there is a well-established set of negative health outcomes (for a review, see Gundersen and Ziliak Reference Gundersen and Ziliak2015) associated with food insecurity which lead to dramatically higher health care costs (Berkowitz et al. Reference Berkowitz, Basu, Meigs and Seligman2017) and higher rates of mortality (Gundersen et al. Reference Gundersen, Tarasuk, Cheng, de Oliveira and Kurdyak2018a).
The extent of food insecurity would be higher, however, were it not for the success of the largest food assistance program in the United States, the Supplemental Nutrition Assistance Program (SNAP). Recent research describing this success includes Gregory and Smith (Reference Gregory and Smith2019), Gundersen, Kreider, and Pepper. (Reference Gundersen, Kreider and Pepper2017a), and Swann (Reference Swann2017). Despite the success of SNAP, a high proportion of SNAP recipients are still food insecure. For example, 50.1 percent of SNAP recipients were food insecure in 2017 versus 23.4 percent of eligible non-recipients (Coleman-Jensen et al. Reference Coleman-Jensen, Rabbitt, Gregory and Singh2019; Table 8). These high food insecurity rates have led some observers to encourage increases in SNAP benefit levels. For example, Ziliak (2016) suggests indexing benefits to the Low-Cost Food Plan rather than the Thrifty Food Plan (defined below). Another example is to tie SNAP benefits to SNAP recipients’ self-reports of how many more dollars they need to be food secure (Gundersen et al. Reference Gundersen, Kreider and Pepper2018b). In this paper, we consider a different approach, namely, to index SNAP benefits to the actual food prices paid by low-income food-secure consumers.
We estimate the impact of indexing SNAP benefits using this approach by answering two questions. The first is “What is the cost of a meal for low-income food-secure consumers by county across the United States?” and the second is “What would be the change in food security if SNAP benefits were indexed to the cost of a meal by county across the United States?” To answer these questions, we use information about the costs of the Thrifty Food Plan for all counties from Nielsen data prepared for Feeding America's Map the Meal Gap (MMG) project (https://map.feedingamerica.org/) along with information on food expenditures from the Current Population Survey (CPS). For the second question we proceed in two steps. We first establish the gap between the cost of the TFP when adjusted for the average expenditures of low-income food-secure households and the TFP. We call this the “SNAP meal gap.” We then use an inquiry on the CPS about households’ perceptions of the amount of money they would need to be food secure to ascertain how many households would be raised out of food insecurity if the SNAP meal gap were closed.
Our central findings are threefold. First, in over 99 percent of counties in the U.S., the average food expenditures by low-income food-secure households are greater than the value of the TFP. Thus, the TFP being too low is not an isolated geographic event. Second, there is enormous variation across the U.S. in terms of food prices. For example, the highest-cost county has a SNAP meal gap that is $2.60, while the lowest has one that is −$0.16. Third, if every county in the U.S. saw an increase in SNAP benefits such that the maximum SNAP benefit was set to the average food expenditures by low-income food-secure households (i.e., the SNAP meal gap was closed), there would be a decline of 50.9 percent in the food insecurity rate among SNAP participants. This amounts to an increase of $23 billion, slightly over 30 percent in total SNAP expenditures.
Background on SNAP
SNAP reached more than 39.8 million people and provided more than $60 billion in total benefits in fiscal year 2018 (https://www.fns.usda.gov/pd/supplemental-nutrition-assistance-program-snap). (For a broader review of SNAP, see Bartfeld et al. Reference Bartfeld, Gundersen, Smeeding and Ziliak2015.) SNAP's stated purpose is to “permit low-income households to obtain a more nutritious diet … by increasing their purchasing power” (USDA 2017, 1). SNAP achieves this goal by providing benefits via an Electronic Benefits Transfer (EBT) card that can be used to buy food in authorized retail food outlets, which include virtually all retail food outlets. The program began as a pilot with the Food Stamp Act of 1964 and became a national program in 1974. It has undergone numerous changes over the years, but its basic structure has stayed the same.
To be eligible for SNAP, households must first meet a gross income test. The household's income (before any deductions) typically cannot exceed 130 percent of the federal poverty level (equivalent to $26,556 for a family of three in 2018), though states can and have set higher thresholds up to 200 percent of the poverty line. Households with at least one elderly or disabled member are not required to meet this test. Net income, gross income less certain deductions, cannot exceed the poverty line ($20,424 for a family of three in 2018), even in states with higher gross income thresholds. The allowable deductions include a standard deduction for all households; a 20 percent earned income deduction; a dependent care deduction when care is necessary for work, training, or education; a child support payments deduction; a medical costs deduction for elderly and disabled people; and an excess shelter cost deduction. Historically, a household's total assets could not exceed $2,250 but most states now waive this test.
SNAP benefit levels are then set by subtracting 30 percent of the household's net income from the value of the TFP, a “minimal-cost” nutritionally adequate food plan that varies by household size and composition. The TFP is a set of market baskets developed by the USDA for different age, gender, and household size categories that specify the types and quantities of food that people can purchase to be prepared at home. (For more on the TFP, see, e.g., Wilde and Llobrera, Reference Wilde and Llobrera2009.) SNAP is not expected to cover the full costs of a household food budget except in the case of households with zero net income. Households with positive net incomes are expected to spend 30 percent of their net income on food. In fiscal year 2016, approximately 37 percent of SNAP households had net incomes of zero (USDA 2017).
The value of the TFP is adjusted annually based on the average national prices in the Consumer Price Index for the categories of food in the TFP market basket. Benefits are not, however, adjusted for geographic differences in food prices except in Alaska and Hawaii.
Data and Methods
Step 1: Establishing the SNAP Meal Gap
Our first step is to establish the maximum SNAP per meal benefit for 2015. Since this value is defined at the household level and varies by household size and we want to examine the benefit on a per meal basis, we take the average of the maximum benefit for each household size and then adjust for the proportion of each household size among those enrolled in SNAP in 2015. We then divide the monthly benefit by the typical number of meals we assume people consume each month (3 meals per day x 31 days, or 93 meals). We arrive at a per meal maximum benefit of $1.86.
We next establish the average weekly food spending levels of food-secure households with incomes below 130 percent of the poverty line. For this analysis, we use data from the CPS, the official data source for poverty and unemployment rates in the U.S., as well as the official source for national food insecurity rates (Coleman-Jensen et al., Reference Coleman-Jensen, Rabbitt, Gregory and Singh2019). In particular, we use data from the December Supplement of the 2015 CPS, which also contains the Core Food Security Module discussed below. The questions about food expenditures are asked prior to the food security questions, and we consider households’ reports of how much money their household usually spends on food in a week. This amount includes both meals at home and meals away from home. Because people with higher incomes have more resources to spend on food, we have chosen to restrict our analysis to people in households with incomes at or below 130 percent of the federal poverty line. We have also chosen to use only responses from food-secure households because food-insecure households are likely underspending on food due to limited resources. We divide weekly food expenditures for respondents by the typical number of meals we expect people would eat in a week (3 meals per day × 7 days per week). The average cost of a meal for food-secure low-income households meeting our criteria is $2.31 (95 percent CI: 2.25, 2.37), 24 percent higher than the maximum SNAP benefit per meal of $1.86 in 2015.
Our next step is to adjust the national per meal cost for the relative prices paid for the TFP in each county in the continental U.S. Our source for a county-level food price index is a unique data set from MMG, which incorporates food price data contributed by Nielsen to estimate the local meal cost. Nielsen analyzes nationwide sales data, including in-store scanning data and Homescan data, from Universal Product Code–coded food items, and assigns each item to one of the 26 food categories in the TFP. These data are then weighted to the TFP market basket based on pounds purchased per week by age and gender. For the current analyses, we examine pounds purchased by men ages 19 to 50. Although other TFPs for different ages and/or genders would result in different total market basket costs, relative pricing between counties (our goal for this analysis) is not affected. The total market basket, along with any applicable state and county taxes, is then translated into an adjustment factor that can be applied to any dollar amount. This adjustment differs by county, revealing differences in food costs.
Finally, we establish, by county, the gap between the maximum benefit and the average meal cost for low-income food-secure households. After multiplying this by 21 to get a weekly measure, this SNAP meal gap is then used in step 2.
Step 2: Reduction in Food Insecurity due to Closing the SNAP Meal Gap
The sample we use to ascertain the impact of closing the SNAP meal gap is composed of food-insecure SNAP recipients. Food insecurity in the United States is measured through a series of questions in the Core Food Security Module (CFSM). The CFSM includes 18 questions for households with children and a subset of 10 questions for households without children. Examples of questions include: “I worried whether our food would run out before we got money to buy more” (the least severe item); “Did you or the other adults in your household ever cut the size of your meals or skip meals because there wasn't enough money for food?”; “Were you ever hungry but did not eat because you couldn't afford enough food?”; and “Did a child in the household ever not eat for a full day because you couldn't afford enough food?” (the most severe item for households with children). Each question is qualified by the stipulation that the problem was caused by lack of money. (The complete list of questions is in Table 1.)
Table 1. Food Insecurity Questions in the Core Food Security Module

Note: Responses in bold indicate an affirmative response.
Under the official definition established by the USDA, a response is labeled affirmative if the answer is “yes” (rather than “no”) or “sometimes” or “often” (rather than “never”). Based on these responses to the CFSM, households are placed into three food insecurity categories under the assumption that the number of affirmative responses reflects the level of food hardship that the family experiences. If a household responds affirmatively to two or fewer questions, it is labeled “food secure” under the premise that all household members had access at all times to enough food for an active, healthy life. If a household responds affirmatively to three to seven questions (three to five for households without children), it is labeled “low food secure” in that at least some household members were uncertain of having, or unable to acquire, enough food because they had insufficient money and other resources for food. If a household responds affirmatively to eight or more questions (six or more for households without children), it is labeled “very low food secure” in that one or more household members were hungry, at least sometime during the year, because they could not afford enough food. The measure we use in this chapter is “food insecure” which includes households that are either low food secure or very low food secure.
Among food-insecure households, we then consider how many more dollars they would need to be food secure. This is obtained as follows. After the food expenditure questions are asked in the CPS, households are further asked “In order to buy just enough food to meet (your needs/the needs of your household), would you need to spend more than you do now, or could you spend less?” Households responding that they need more money for food were asked the following question: “About how much more would you need to spend each week to buy just enough food to meet the needs of your household?” This question precedes the 18-item scale in the CFSM. Each person is assigned a per-capita value for dollars needed by taking the household report of dollars needed and dividing this by household size. The resulting average value for the dollars needed per week is $18.60 (95 percent CI: 17.18, 20.02) and the median is $21.25.
Central to our analyses, though, is the distribution of “dollars needed” rather than the mean or median “dollars needed.” In Figure 1 the proportion of households that would become food secure if weekly SNAP benefits were increased by values of between $5 and $35 is shown. As an example, if SNAP benefits were to be increased by $5 per week, this would mean that just over 40 percent of previously food-insecure SNAP recipients would become food secure, while the other households would still be food insecure because the $5 increase in weekly SNAP benefits would not be enough to remove them from food insecurity. At a higher increase in weekly SNAP benefits, an increase of $30, slightly over 80 percent of food-insecure SNAP recipients would become food secure based on their own reported household food budget needs.

Figure 1. Estimated Reductions in Food Insecurity Due to Increases in SNAP Benefits
Our assumption is that if they received more than the amount they report needing that they would be food secure. (This is the same assumption as was used in Gundersen et al. (Reference Gundersen, Kreider and Pepper2018b). By definition, then, the reduction in food insecurity after closing the SNAP meal gap will be higher in counties with higher food prices. In terms of how this would be implemented, we assume that this would be a lump-sum transfer to households, irrespective of size. In other words, the minimum benefit level would go up by the amount needed to close the gap between the average meal costs of food-secure low-income households and maximum SNAP benefits. This is different than if increases were structured as a function of household size or as a proportion of current benefits.
We now consider an example of how the two steps are implemented. Suppose the SNAP meal gap in a county is 47.6 cents. This translates into a weekly value of 0.476*21=$10. In response, suppose that weekly SNAP benefits are increased by $10 per week in this county. Turning to Figure 1, this means that there would be a 51.9 percent reduction in food insecurity among SNAP recipients in that hypothetical county. For the other 48.1 percent of food-insecure SNAP recipients, though, an increase of $10 is not enough to move them from food insecurity to food security.
Results
Across counties in the continental U.S., there is substantial variation in the average price of a meal paid by low-income food-secure households. The two highest-price counties in 2015 are Crook County, Oregon, at $4.41 and New York County, New York, at $3.96. The corresponding gaps between these prices and the maximum SNAP benefits are $2.55 and $2.12. The two lowest price counties are Maverick County, Texas, at $1.60 and Willacy County, Texas, at $1.64. For both of these counties and 20 other counties, the difference with the maximum SNAP benefit is negative. This leaves over 99 percent of the US continental counties with a positive gap.
Consistent with the variation in food prices, though, this aggregate decline masks substantial heterogeneity across counties. Table 2 shows the 20 counties with the highest number of SNAP recipients. In these counties, the average meal costs range from $1.80 (Hidalgo County, TX) and $3.98 (New York County, NY). For Hidalgo County, the average meal cost is less than the SNAP maximum benefit, so there would not be a change in SNAP benefit levels and, hence, no change in food insecurity. In New York County, though, closing the SNAP meal gap would result in an 87.0 percent decline in food insecurity among SNAP participants.
Table 2. Meal Costs and Reductions in Food Insecurity if SNAP Meal Gap is Closed, by 20 Counties with Highest Number of SNAP Recipients
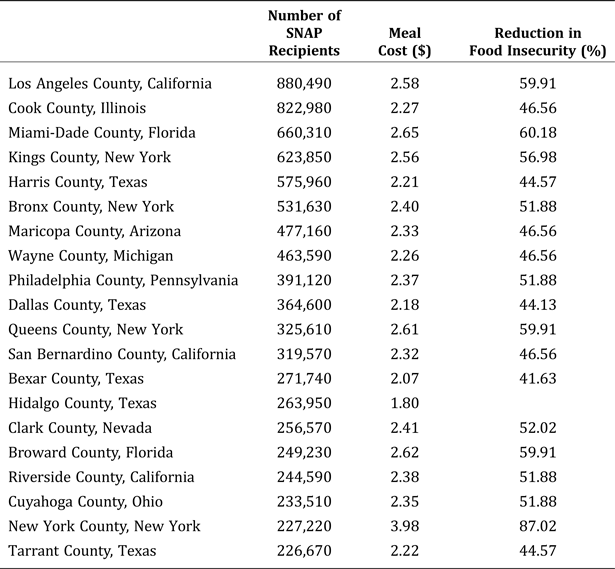
Table 3 displays the 20 counties with the highest food insecurity rates in 2015, all of which are located in the South. The range in reductions in food insecurity is more narrow than in Table 2—46.6 percent to 56.4 percent.
Table 3. Meal Costs and Reductions in Food Insecurity if SNAP Meal Gap is Closed, by 20 Counties with Highest Food Insecurity Rates

As seen in Table 2, many of the counties with the largest number of SNAP participants have high food prices. In Table 4, we explore whether, in general, the reduction in food insecurity is larger in populous urban areas than in rural areas. To do so, we use a breakdown of counties by Rural-Urban Continuum Codes (RUCCs) which Gundersen et al. (Reference Gundersen, Dewey, Hake, Engelhard and Crumbaugh2017b) discuss in the context of food insecurity. These RUCCs are broken down into nine categories, ranging from counties in metro areas of 1 million population or more down to completely rural counties of less than 2,500 that are not adjacent to an urban area. In terms of the total number of counties in each category, the largest number is found among those having an urban population of 2,500 and 19,999 and adjacent to an urban area. With the exception of counties with an urban population of 20,000 or more but not adjacent to a metro area, there are at least 200 counties in each category. In the most urban category, the percent reduction in food insecurity if the SNAP meal gap were closed would be 51.8 percent. This reduction is not much different, though, from the most rural counties where it is 48.5 percent.
Table 4. Meal Costs and Reductions in Food Insecurity if SNAP Meal Gap is Closed, by Rural Urban Continuum Codes

In Table 5 we compare counties by whether they have more or less than average proportions of individuals within certain demographic categories. Namely, we consider the unemployment rate, the poverty rate, percent African-American, percent Hispanic, and the homeownership rate. These are all characteristics that have been shown to be associated with food insecurity rates (Gundersen and Ziliak, Reference Gundersen and Ziliak2018). The differences in the meal costs and reductions in food insecurity are quite similar across counties in the various categories.
Table 5. Meal Costs and Reductions in Food Insecurity if SNAP Meal Gap is Closed, by Categories

Before turning to alternative specifications, we consider the total impact of closing the SNAP meal gap. Tables 2 through 4 show that there is quite a bit of variation across counties in the reduction in food insecurity using our proposed approach. With the exception of counties with negative SNAP meal gaps, in all counties, some food-insecure SNAP recipients would become food secure due to an increase in benefits, while others will stay food insecure. If we sum up all of the SNAP recipients who will become food secure and divide this by the number of current food-insecure SNAP recipients (i.e., before any potential increase in benefits), we find that there would be a 50.9 percent decline in food insecurity among SNAP recipients. This amounts to about 11 million people.
The total cost of expanding SNAP benefits to close the SNAP meal gap would be approximately $23 billion. We calculate this by multiplying the number of SNAP recipients in a county by the per meal cost to close the SNAP meal gap in that county. We then arrive at an annual figure by multiplying the per meal cost by 21 (the number of meals in a week), which is then multiplied by 52 (weeks in a year). We then sum over this value for all counties in the U.S. to arrive at the total annual cost in benefits. In 2015, total SNAP expenditures were $74 billion, meaning that closing the SNAP meal gap would lead to a slightly more than 30 percent increase in total SNAP expenditures.
Alternative specification
The standard way to measure food insecurity in the U.S. is with a 12-month measure and, hence, that is the approach used in the analyses above. One potential issue, though, is that the dollars-needed measure is based on a household's current perception of how many more dollars are needed to be food secure. Consequently, the measure portrays some households that are food secure currently and may report not needing any additional dollars. In response, we explore how the SNAP meal gap and dollars needed by food-secure households change if we define those being food secure over the past 30 days rather than over the previous year.
In terms of the average meal cost, the values are about the same. As stated above, if one uses the annual measure, the average meal cost for food-secure households with incomes below 130 percent of the poverty line is $2.31 (95 percent CI: 2.25, 2.37), while it is $2.28 (95 percent CI: 2.23, 2.34) for the previous 30 days. There is a wider difference between the annual measure and the 30-day measure when we look at dollars needed. For the annual measure, it is $18.60 (95 percent CI: 17.18, 20.02), but for the 30-day measure, it is $23.20 (95 percent CI: 21.23, 25.16).
In light of the lower average food price and the higher SNAP meal gap, the relative impact of increasing SNAP is smaller than when the annual measure is used. Namely, there would be a 40 percent decrease in food insecurity among SNAP recipients.
Conclusion
The important role SNAP plays in reducing food insecurity for tens of millions of Americans has been demonstrated in multiple studies. For many households, though, SNAP benefits may not be enough to make them food secure. This shortfall can occur for multiple reasons—e.g., greater needs due to someone in a household with a disability—but it is clear that one important reason is living in a county with high food prices.
One straightforward approach to reducing food insecurity among those living in high-price areas is to increase SNAP benefits. In this paper, we examined the impact of closing the SNAP meal gap, i.e., establishing SNAP benefits so that the maximum SNAP benefit level is set to the cost of the average meal for low-income food-secure households in every county. If this were to occur, on average, SNAP benefits would have to increase by 45 cents per meal, which is 24 percent higher than the current SNAP per meal cost ($1.86). If this SNAP meal gap were closed in all counties, we estimate that this would result in a 50.9 percent decline in food insecurity rates among SNAP recipients. This amounts to almost 11 million fewer food-insecure SNAP recipients at a cost of $23 billion.
Our paper is part of a recent group of papers that have stipulated different approaches and justifications to increasing SNAP benefits. A 2013 report from an expert committee at the Institute of Medicine concluded that the benefit design is not adequate (Caswell and Yaktine Reference Caswell and Yaktine2013), and others have recently explored ideas for improving SNAP benefits. Ziliak (2016) argues that among the design problems with the TFP are the failure of the underlying assumptions to account for the time needed to prepare meals at home, the lack of attention to dietary needs of adolescent household members, and the failure to address geographic variations in cost. In response, Ziliak suggests increasing the TFP amount 20 percent to what is roughly the value of the Low-Cost Food Plan. If this across-the-board increase was established, the subsequent reduction in the SNAP meal gap would lead to a 46.1 percent decline in food insecurity for SNAP recipients, only slightly smaller than the more targeted approach we use in this paper.
Gundersen et al. (Reference Gundersen, Kreider and Pepper2018b) also suggest increasing SNAP benefits, based on households’ reports of the dollars needed to be food secure. They find that an across-the-board weekly increase in SNAP benefits of $42 per household would lead to a 61.8 percent decline in food insecurity among SNAP participants, a substantially larger reduction than in this paper due to its much larger benefit size increase.
The feasibility of proposals to increase SNAP benefits, including the one in this paper, is not altogether clear, given recent regulatory efforts to reduce the size of the program. With respect to the more narrow issue of using local cost-of-living differences to set benefits for assistance programs, there are some precedences. For example, due to higher food prices, the SNAP benefit scale is set at a higher rate in Alaska and Hawaii. Another example with more granular differences is the Section 8 housing program administered by the Department of Housing and Urban Development. Here, benefits are tied to 30 percent of the value of the Fair Market Rent, which differs across cities.
While incorporating differences in the cost of food into SNAP benefits along these lines is feasible, a more difficult issue is whether there would be the political desire to increase these benefits. The opportunity costs of raising SNAP benefits, especially during times when caseloads are high, must, of course, be part of any comprehensive consideration. What is often overlooked in these considerations, though, are the ancillary benefits associated with increasing SNAP. One of these are the spillovers to non-SNAP recipients, as articulated in Reimer et al. (Reference Reimer, Weerasooriya and West2015). Another benefit is the reduction in health care costs that occur when food insecurity is reduced (Berkowitz et al., Reference Berkowitz, Basu, Meigs and Seligman2017). Since a high proportion of SNAP recipients also receive health insurance through the federal government, these would partially offset the fiscal burden of higher SNAP benefits.


 Open access