


1 Introduction
In high-power laser facilities designed for inertial confinement fusion (ICF), temporal shaping of a single longitude mode laser is utilized in the front end in combination with an intensity modulator to obtain a smooth pulse envelope in the time domain. However, the line width of a single longitude mode laser is usually narrow (dozens to hundreds of kHz), which may cause transverse Brillouin scattering in large-aperture optical elements and make the smoothing of the speckle focusing on the target challenging. Thus, the spectrum of the temporally shaped pulse is broadened by two phase modulators in the front end for stimulated Brillouin scattering (SBS) suppression (with frequency of ${\sim}3$
GHz in our system) and for beam focal spot smoothing (with frequency of
${\sim}3$
GHz in our system) and for beam focal spot smoothing (with frequency of ${\sim}22.82$
GHz in our system), respectively[Reference Wisoff, Bowers, Erbert, Browning and Jedlovec1–Reference Li, Wang, Lu, Ding, Chen, Du, Ba, Zheng, Wang, Yuan, Zhu, He, Lin, Dong, Zhou, Bai, Liu and Cui3]. However, the phase-modulated spectrum may be filtered due to the nonuniform spectral transmission of either amplitude or phase of the optical elements and polarization-maintaining fiber (PMF) in the front end, which partially converts the frequency modulation (FM) to amplitude modulation (AM)[Reference Hocquet, Penninckx, Bordenave, Gouédard and Jaouën4]. This kind of amplitude modulation would adversely influence the laser performance and reduce the damage threshold intensity for the laser components; therefore, it needs to be suppressed. Although gain narrowing and group velocity dispersion (GVD)[Reference Rothenberg, Browning and Wilcox5–Reference Xu, Wang, Li, Lin, Zhang, Deng, Deng, Huang, Wang, Ding and Tang8] can also cause FM-to-AM conversion, the polarization mode dispersion (PMD)-induced AM, caused by the differential group delay (DGD) and polarization coupling[Reference Penninckx, Beck, Gleyze and Videau9, Reference Penninckx and Beck10], is especially difficult to compensate, owing to its time-varying characteristics (influenced by temperature, vibration, and pressure)[Reference Yang, Liu and Feng11]. In contrast to the FM-to-AM conversion induced by GVD, with a pure phase transfer function, the PMD-induced modulation is primarily the result of nonuniform transmission of both the phase and intensity[Reference Penninckx, Beck, Gleyze and Videau9].
${\sim}22.82$
GHz in our system), respectively[Reference Wisoff, Bowers, Erbert, Browning and Jedlovec1–Reference Li, Wang, Lu, Ding, Chen, Du, Ba, Zheng, Wang, Yuan, Zhu, He, Lin, Dong, Zhou, Bai, Liu and Cui3]. However, the phase-modulated spectrum may be filtered due to the nonuniform spectral transmission of either amplitude or phase of the optical elements and polarization-maintaining fiber (PMF) in the front end, which partially converts the frequency modulation (FM) to amplitude modulation (AM)[Reference Hocquet, Penninckx, Bordenave, Gouédard and Jaouën4]. This kind of amplitude modulation would adversely influence the laser performance and reduce the damage threshold intensity for the laser components; therefore, it needs to be suppressed. Although gain narrowing and group velocity dispersion (GVD)[Reference Rothenberg, Browning and Wilcox5–Reference Xu, Wang, Li, Lin, Zhang, Deng, Deng, Huang, Wang, Ding and Tang8] can also cause FM-to-AM conversion, the polarization mode dispersion (PMD)-induced AM, caused by the differential group delay (DGD) and polarization coupling[Reference Penninckx, Beck, Gleyze and Videau9, Reference Penninckx and Beck10], is especially difficult to compensate, owing to its time-varying characteristics (influenced by temperature, vibration, and pressure)[Reference Yang, Liu and Feng11]. In contrast to the FM-to-AM conversion induced by GVD, with a pure phase transfer function, the PMD-induced modulation is primarily the result of nonuniform transmission of both the phase and intensity[Reference Penninckx, Beck, Gleyze and Videau9].
It is possible to reduce the AM by using a spectral flattening filter such as a Fabry–Perot (F–P) etalon[Reference Wisoff, Bowers, Erbert, Browning and Jedlovec1] or a birefringent crystal[Reference Preuss and Gole12]. However, an F–P etalon provides only an intensity transfer function, and it is extremely time-consuming to make fine adjustments to achieve optimal performance using an F–P etalon. A birefringent crystal can provide both phase and amplitude transfer functions, but it is difficult to achieve completely decoupled control using a birefringent crystal. Further, owing to the birefringence of the crystal, the coupling efficiency would decrease during adjustment.
Fiber-based filters have also been proposed to solve this problem[Reference Sunnerud, Xie, Karlsson, Samuelsson and Andrekson13–Reference Vidal, Luce and Penninckx15]. Most fiber systems are simple and compact, but need high-precision temperature control to adjust the phase shift in the PMF, and the tuning speed is also low. For example, using a mechanical polarization controller can achieve good compensation results. However, its auto-controllability and repeatability are poor. Another passive method makes use of a large number of polarizers to maintain a high polarization extinction ratio (PER); however, the drawbacks are the high cost and insufficient suppression of PMD-induced FM-to-AM conversion. The front end based on polarizing fibers[Reference Nolan, Berkey, Li, Chen, Wood and Zenteno16] has demonstrated good performance for suppression of PMD-induced FM-to-AM conversion[Reference Qiao, Wang, Fan, Li, Jiang, Li, Huang and Lin17]; however, polarizing fiber elements are not universal.

Figure 1. Schematic of the polarization-maintaining (PM) front end. DFB laser: distributed feedback laser, AOM: acoustic-optic modulator, Phase Mod: phase modulator, EOM: electro-optic modulator, AWG: arbitrary wave generator, PMF: polarization-maintaining fiber, ILP: inline polarizer. The red pulses present the evolution of temporal profile, which considers the effect of loss, amplification and frequency modulation (FM) to amplitude modulation (AM).
In this paper, the effect of PMD-induced transmission spectrum distortion on the FM-to-AM conversion is analyzed to find out a feasible and effective compensation method. The result shows that the large-scale envelope is the main factor that induces the strong AM. It can be compensated by using a linear spectrum filter. Based on the above analysis, in Section 3, we propose a flexible spectral filter with independently tuned peak wavelength, free spectral range (FSR), and modulation depth. Its decoupled characteristic is verified theoretically and experimentally. In Section 4, the FM-to-AM suppression results are demonstrated. Considering that the PMD-induced FM-to-AM conversion is time-varying, a positive, closed-loop control is implemented for the proposed filter to achieve a fast and efficient real-time suppression of the FM-to-AM conversion in the PM fiber front end. It is believed to be the first time to use the spectrum tracking method to suppress the PMD-induced FM-to-AM conversion of a complex fiber system and achieve an effective long-term compensation. The results show that the FM-to-AM conversion caused by PMD can be reduced from 18% to 3.2% at a modulation frequency of 22.82 GHz. The modulation of below 6.5% for 3 h indicates the outstanding adjustability and environmental suitability of the filter. It also has a great potential application in many engineering areas.
2 PMD-induced FM-to-AM conversion in front end
2.1 Theory of PMD-induced FM-to-AM conversion
The schematic of the PM front end is shown in Figure 1. An acoustic-optic modulator (AOM) and an electro-optic modulator (EOM) combined with an arbitrary wave generator (AWG) are used to realize arbitrary temporal-profile shaping, and a two-stage phase modulator is to broaden the spectrum. Amplifiers are inserted to compensate losses of the devices. The signal in the front end is usually linearly polarized along one of the PMF axes. Ideally, the SOP of the signal can be well maintained in the PMF since the PER of PMFs is usually above 30 dB. However, the PER degradation due to the connectors, splices, and polarization components makes part of the signal energy travel along the unwanted axis, named ‘ghost’[Reference Penninckx, Beck, Gleyze and Videau9]. Thus, the signal and its ghost are gradually separated in the time domain during propagation owing to the effect of the DGD of PMFs and birefringent crystals in modulators. The two pulses will interfere when they pass through the next low-PER component.
The interference condition is wavelength-dependent because it depends on the relative phase, which contributes to DGD[Reference Penninckx and Beck10]. It should be mentioned that, if we consider the total energy on both axes, the temporal and frequency profiles of the signal would not be distorted because there is no power transfer between different wavelengths. However, in general, only the energy on the axis where the signal is launched is useful in practice. In this case, after a polarizer with the fast or slow axis blocked, for instance, the pulse is distorted because different spectral components of the signal suffer nonuniformity by a transfer function.
A lower PER means more energy of the signal transfers to the ghost; thus, the element with a lower PER has more influence on the transfer function of the whole system. As a matter of fact, the PER of connectors, which is often specified to be only ${\sim}25$
dB, is much lower than that of other elements in the front end. The transfer function of the whole system is hence mainly determined by PM patch-cord concatenation.
${\sim}25$
dB, is much lower than that of other elements in the front end. The transfer function of the whole system is hence mainly determined by PM patch-cord concatenation.
A single PM patch cord with two connectors behaves like a two-wave interferometer due to the DGD in the PMF and the low frequency-dependent PER of the connectors[Reference Penninckx, Beck, Gleyze and Videau9, Reference Monerie18]. The Jones transfer matrix of a single PM patch cord is given by
 $$\begin{eqnarray}M(f)=M_{\text{CON1}}M_{\text{PM}}M_{\text{CON0}},\end{eqnarray}$$
with
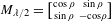
 $$\begin{eqnarray}\displaystyle & \displaystyle M_{\text{CON}i}=\left[\begin{array}{@{}cc@{}}\cos \unicode[STIX]{x1D703}_{\text{CON}i} & -\text{sin}\,\unicode[STIX]{x1D703}_{\text{CON}i}\\ \sin \unicode[STIX]{x1D703}_{\text{CON}i} & \cos \unicode[STIX]{x1D703}_{\text{CON}i}\end{array}\right],\quad i=0,1, & \displaystyle \nonumber\\ \displaystyle & \displaystyle M_{\text{PM}}=\left[\begin{array}{@{}cc@{}}1 & 0\\ 0 & e^{-i(2\unicode[STIX]{x1D70B}f\unicode[STIX]{x1D700}l+\unicode[STIX]{x1D711}_{\text{p}})}\end{array}\right], & \displaystyle \nonumber\end{eqnarray}$$
where $\unicode[STIX]{x1D703}_{\text{CON}i}$
is the rotation angle due to the PER of the connector related to PER through
$\unicode[STIX]{x1D703}_{\text{CON}i}$
is the rotation angle due to the PER of the connector related to PER through $\text{PER}=1/\tan ^{2}\unicode[STIX]{x1D703}_{\text{CON}i}$
[Reference Penninckx and Beck19],
$\text{PER}=1/\tan ^{2}\unicode[STIX]{x1D703}_{\text{CON}i}$
[Reference Penninckx and Beck19], $l$
is the length of the PMF,
$l$
is the length of the PMF, $\unicode[STIX]{x1D700}$
denotes the DGD coefficient, which is typically 1.5–2 ps/m in the PMF, and
$\unicode[STIX]{x1D700}$
denotes the DGD coefficient, which is typically 1.5–2 ps/m in the PMF, and $\unicode[STIX]{x1D711}_{\text{p}}$
is the relative phase between the two axes, which fluctuates randomly due to the fluctuating environment. Here, the loss and the effect of the PER of the PMF, which is usually as high as 50 dB, are not considered. The contribution of GVD is also neglected because it is small for transmission distance of
$\unicode[STIX]{x1D711}_{\text{p}}$
is the relative phase between the two axes, which fluctuates randomly due to the fluctuating environment. Here, the loss and the effect of the PER of the PMF, which is usually as high as 50 dB, are not considered. The contribution of GVD is also neglected because it is small for transmission distance of ${\sim}50$
m with signal bandwidth of 0.3 nm.
${\sim}50$
m with signal bandwidth of 0.3 nm.
The transfer function $H_{\text{PM}}$
(
$H_{\text{PM}}$
( $f$
) applied to the signal at the end of a single patch cord is then given by[Reference Penninckx and Beck10]
$f$
) applied to the signal at the end of a single patch cord is then given by[Reference Penninckx and Beck10]
 $$\begin{eqnarray}\left[\begin{array}{@{}c@{}}0\\ H_{\text{PM}}(f)\end{array}\right]=P\cdot M(f)\cdot \left[\begin{array}{@{}c@{}}0\\ 1\end{array}\right],\end{eqnarray}$$
where $P=[\begin{smallmatrix}0 & 0\\ 0 & 1\end{smallmatrix}]$
is the Jones matrix of a linear polarizer. Further, according to Equations (1) and (2), we derived the transfer function as
$P=[\begin{smallmatrix}0 & 0\\ 0 & 1\end{smallmatrix}]$
is the Jones matrix of a linear polarizer. Further, according to Equations (1) and (2), we derived the transfer function as
 $$\begin{eqnarray}H_{\text{PM}}\left(f\right)\propto 1+\frac{1}{\text{PER}_{\unicode[STIX]{x1D6FC}}}\exp \left[i\left(2\unicode[STIX]{x1D70B}f\unicode[STIX]{x0394}\unicode[STIX]{x1D70F}+\unicode[STIX]{x1D711}\right)\right],\end{eqnarray}$$
where $\text{PER}_{\unicode[STIX]{x1D6FC}}=\sqrt{\text{PER}_{0}\cdot \text{PER}_{1}}$
is determined by two connectors with PER of
$\text{PER}_{\unicode[STIX]{x1D6FC}}=\sqrt{\text{PER}_{0}\cdot \text{PER}_{1}}$
is determined by two connectors with PER of $\text{PER}_{0}$
and
$\text{PER}_{0}$
and $\text{PER}_{1}$
. According to Equation (3), one PM patch cord behaves like a two-wave interferometer. The interference curve is defined by three parameters: the peak wavelength depends on the relative phase
$\text{PER}_{1}$
. According to Equation (3), one PM patch cord behaves like a two-wave interferometer. The interference curve is defined by three parameters: the peak wavelength depends on the relative phase $\unicode[STIX]{x1D711}$
between the two principle axes, the modulation depth is a function of the total PER, and the frequency scale is proportional to the PMF DGD
$\unicode[STIX]{x1D711}$
between the two principle axes, the modulation depth is a function of the total PER, and the frequency scale is proportional to the PMF DGD $\unicode[STIX]{x0394}\unicode[STIX]{x1D70F}$
.
$\unicode[STIX]{x0394}\unicode[STIX]{x1D70F}$
. $H_{\text{PM}}(f)$
for a single PM patch cord is plotted in Figure 2(a) and shows a sinusoidal behavior. However, for a concatenation of
$H_{\text{PM}}(f)$
for a single PM patch cord is plotted in Figure 2(a) and shows a sinusoidal behavior. However, for a concatenation of $N$
PM patch cords with different
$N$
PM patch cords with different $\unicode[STIX]{x0394}\unicode[STIX]{x1D70F}$
, PER, and
$\unicode[STIX]{x0394}\unicode[STIX]{x1D70F}$
, PER, and $\unicode[STIX]{x1D711}$
, the transfer function is far more complicated than that for a single patch cord; Figure 2(b) shows the transfer function for a concatenation of three PM patch cords. As can be seen, for the front end with many polarization devices, the transmission spectrum will be rather uneven and complex.
$\unicode[STIX]{x1D711}$
, the transfer function is far more complicated than that for a single patch cord; Figure 2(b) shows the transfer function for a concatenation of three PM patch cords. As can be seen, for the front end with many polarization devices, the transmission spectrum will be rather uneven and complex.

Figure 2. Transfer functions of (a) one PM patch cord with a 6-m PMF and (b) three connected 1-, 2-, and 10-m PMFs. (c) Schematic of FM-to-AM conversion for a phase-modulated signal (modulation frequency is 22.82 GHz). PER: polarization extinction ratio.
Owing to the strong group birefringence of the PMF and crystals, the pulse will be distorted as long as its spectral bandwidth is on the order of or larger than the inverse of the DGD. For the phase-modulated pulse in the front end, the distortion appears as FM-to-AM conversion, as depicted in Figure 2(c). The distortion criterion $\unicode[STIX]{x1D6FC}$
is defined as[Reference Hocquet, Penninckx, Bordenave, Gouédard and Jaouën4]
$\unicode[STIX]{x1D6FC}$
is defined as[Reference Hocquet, Penninckx, Bordenave, Gouédard and Jaouën4]
 $$\begin{eqnarray}\unicode[STIX]{x1D6FC}=\frac{P_{\max }-P_{\min }}{(P_{\max }+P_{\min })/2},\end{eqnarray}$$
where $P_{\max }$
and
$P_{\max }$
and $P_{\min }$
are the maximum and minimum intensities, respectively.
$P_{\min }$
are the maximum and minimum intensities, respectively.

Figure 3. Transmission spectra of the front end measured at three different instants of time for randomly varying pressure applied to the PMF in the front end, corresponding to the distortion criteria of 34%, 12.5%, and 18.4%. The inset shows the phase-modulated spectrum of the signal. The red rectangular region indicates the wavelength range containing most of the signal power.
2.2 Effect of the nonuniform transmission spectrum
The FM-to-AM conversion is mainly due to the nonuniform spectral transmission. In high-power lasers for ICF, this distortion adversely affects the laser performance and can damage the optics or amplify instabilities of the plasma and thus prevent fusion ignition[Reference Vidal, Luce and Penninckx14]. The suppression of the FM-to-AM conversion is principally to compensate the nonuniform spectral transmission of the front end. The transmission spectrum of the front end (at point A in Figure 1) measured using a commercial spectrometer with a 60-nm fluorescence source, is shown in Figure 3. The input signal spectrum is shown in green in the inset of Figure 3. In the front end, the 22.82-GHz modulation causes much larger AM than the 3-GHz modulation[Reference Hocquet, Penninckx, Bordenave, Gouédard and Jaouën4], owing to its strong spectral broadening ability. Therefore, we focus on the FM-to-AM conversion under 22.82 GHz phase-modulation frequency in this paper. Owing to the filters in the fiber amplifiers, the bandwidth of the output spectrum is only 3 nm. As expected, the transmission spectrum is time-varying due to the effect of PMD. However, the situation is not as complicated as it might seem. Since the PERs of different connectors are different, the rotation angle $\unicode[STIX]{x1D703}_{\text{CON}i}$
, which is related to the PER, is a positive or negative random number; thus, the effects of different connectors may cancel each other out. To some extent, this simplifies the filtering function of the front end but makes it irregular. After transmission, the phase-modulated signal spectrum with a modulation frequency of 22.82 GHz is distorted at the front-end output. The signal spectrum is measured by using our home-made spectrometer with a resolution of 6 pm. As shown, the phase modulation results in distributed spectral line, confirming to the Fourier transformation. The spacing between wavelengths is in accordance with the phase-modulation frequency.
$\unicode[STIX]{x1D703}_{\text{CON}i}$
, which is related to the PER, is a positive or negative random number; thus, the effects of different connectors may cancel each other out. To some extent, this simplifies the filtering function of the front end but makes it irregular. After transmission, the phase-modulated signal spectrum with a modulation frequency of 22.82 GHz is distorted at the front-end output. The signal spectrum is measured by using our home-made spectrometer with a resolution of 6 pm. As shown, the phase modulation results in distributed spectral line, confirming to the Fourier transformation. The spacing between wavelengths is in accordance with the phase-modulation frequency.
In the front end, in general, the variation of the spectrum due to environment change is relatively slow. In order to better observe the variation of the spectrum and the effect of the variation on the FM-to-AM conversion experimentally, randomly varying pressure was exerted on one of the PMFs in the front end. Although for one single patch cord, the random phase shift only leads to the drifting of peak wavelength (see Figure 2(a)), in a concatenation of PM patch cords, it will result in time-varying modification of the entire spectrum profile. The blue, red, and black lines in Figure 3 show spectra measured at different instants of time, corresponding to the distortion criteria of 34%, 12.5%, and 18.4%. These results demonstrate that even very small variations in the spectrum may significantly change the FM-to-AM conversion. Such random and irregular variations of the spectrum are impossible to be compensated completely. However, for the high-power lasers built for ICF, the bandwidth of the phase-modulated pulse is discrete and narrow (only several Å, 1 Å $=$
0.1 nm). Thus, we only need to flatten the spectrum at the wavelengths of the spectral lines, or more precisely, to achieve equal transmittance for all lines, especially for the four high-energy lines. See the inset of Figure 3 (or Figure 8(a) for clarity), the transmission spectrum can be decomposed into two parts: a large-scale envelope (green dashed line in Figure 8(a)) and several small-scale structures. The modulation depth of the former is the product of axis rotations of a concatenation fiber, while that of the latter is the product of axis rotations at both ends of one fiber[Reference Penninckx, Beck, Gleyze and Videau9]. As depicted, the modulation depth of the large-scale envelope is deeper, and thus has more influence on the FM-to-AM conversion than the fine spectrum structure. The simulation result shows that the AM induced by the large-scale envelope is 10 times higher than by the fine structure. Therefore, the AM suppression can be reducible to the large-scale envelope compensation. This can be achieved by using a tunable linear filter. To respond to the variation of the transmission spectrum flexibly and accurately, the FSR, peak wavelength, and modulation depth of the filter should be decoupled.
$=$
0.1 nm). Thus, we only need to flatten the spectrum at the wavelengths of the spectral lines, or more precisely, to achieve equal transmittance for all lines, especially for the four high-energy lines. See the inset of Figure 3 (or Figure 8(a) for clarity), the transmission spectrum can be decomposed into two parts: a large-scale envelope (green dashed line in Figure 8(a)) and several small-scale structures. The modulation depth of the former is the product of axis rotations of a concatenation fiber, while that of the latter is the product of axis rotations at both ends of one fiber[Reference Penninckx, Beck, Gleyze and Videau9]. As depicted, the modulation depth of the large-scale envelope is deeper, and thus has more influence on the FM-to-AM conversion than the fine spectrum structure. The simulation result shows that the AM induced by the large-scale envelope is 10 times higher than by the fine structure. Therefore, the AM suppression can be reducible to the large-scale envelope compensation. This can be achieved by using a tunable linear filter. To respond to the variation of the transmission spectrum flexibly and accurately, the FSR, peak wavelength, and modulation depth of the filter should be decoupled.
3 Principle and performance of the filter
3.1 Structure and principle
Figure 4 shows the schematic of a multi-degrees of freedom (DOF) filter we proposed for the FM-to-AM compensation. The filter consists of an injection collimator with a fast-axis-blocked polarizing (PZ) pigtail to provide linearly polarized injection, a half-wave plate to change the modulation depth, a nematic liquid crystal (NLC) with a maximum phase retardance of 1.1 $\unicode[STIX]{x1D70B}$
at 1030 nm (Thorlabs, LCC1221-B) to adjust the peak wavelength, an auxiliary PMF to control the FSR, an axis-rotated PMF, and an inline polarizer (ILP). The axis-rotated PMF contains two pieces of PMF fused together with the axis of one piece aligned at
$\unicode[STIX]{x1D70B}$
at 1030 nm (Thorlabs, LCC1221-B) to adjust the peak wavelength, an auxiliary PMF to control the FSR, an axis-rotated PMF, and an inline polarizer (ILP). The axis-rotated PMF contains two pieces of PMF fused together with the axis of one piece aligned at $45^{\circ }$
to the axis of the other. All the pigtails of the fiber elements in the filter are PMFs except for that of the injection collimator. The half-wave plate is installed on a motorized rotation mount (Thorlabs, PRM1Z8) such that the wave-plate rotation angle can be precisely controlled with a computer. When building the filter, the optical axis of the wave plate is aligned with the polarization of the injection, while the value on the adjusting mount scale is
$45^{\circ }$
to the axis of the other. All the pigtails of the fiber elements in the filter are PMFs except for that of the injection collimator. The half-wave plate is installed on a motorized rotation mount (Thorlabs, PRM1Z8) such that the wave-plate rotation angle can be precisely controlled with a computer. When building the filter, the optical axis of the wave plate is aligned with the polarization of the injection, while the value on the adjusting mount scale is $0^{\circ }$
. The voltage applied to the NLC is adjusted with the computer elements, respectively. The insertion loss of the system, which primarily stems from the NLC and the splicing loss of the rotated PMF, is less than 2 dB, and does not change in the tuning process. This advantage makes the filter more applicable for practical use than the birefringent crystal.
$0^{\circ }$
. The voltage applied to the NLC is adjusted with the computer elements, respectively. The insertion loss of the system, which primarily stems from the NLC and the splicing loss of the rotated PMF, is less than 2 dB, and does not change in the tuning process. This advantage makes the filter more applicable for practical use than the birefringent crystal.

Figure 4. Schematic of a multi-degrees of freedom (DOF) filter (the blue arrows represent the practical polarization state of the laser, and the red arrows represent the optical axes of the elements). PZF: polarizing fiber, NLC: nematic liquid crystal, PMF: polarization-maintaining fiber, ILP: inline polarizer.
The length of the pigtail fibers for most fiber elements is 1 m, and that of the first piece of the rotated fiber is 0.5 m. The second piece of the rotated fiber and the pigtail of the ILP are cleaved to very small lengths and fused together to avoid the polarization rotation caused by the connector. The DGD coefficient $\unicode[STIX]{x1D700}$
of the PMF is 1.6 ps/m. In practice, the PER values of different connectors are different and generally lower than 30 dB, and thus the PER of all connectors is assumed to be 25 dB in the simulation.
$\unicode[STIX]{x1D700}$
of the PMF is 1.6 ps/m. In practice, the PER values of different connectors are different and generally lower than 30 dB, and thus the PER of all connectors is assumed to be 25 dB in the simulation.
Two key points should be mentioned while building the system.
First, to achieve decoupled control, the optical axis of the NLC (defined as the major axis of the liquid crystals in the absence of applied voltage) must be parallel to one of the principle axes of the pigtail of the second collimator; in this way, a pure phase shift can be applied without any amplitude modulation.
Second, it is necessary to use the ILP at the output to focus on only the component of the signal along the axis that will be used in practice. In addition, since the ILP, which is slow-axis-polarized, has no influence on the spectrum, the axis-rotated PMF is the key component to generate the spectral modulation and to increase the dynamic range of the filter. The dynamic range here is defined as the maximum tuning range of the modulation depth.
To minimize additional polarization mode coupling, the second piece of the axis-rotated PMF and the tail fiber of the ILP should be as short as possible.
We use Jones transfer matrices to describe the operating principle of the filter (for details, see Appendix A):
 $$\begin{eqnarray}\displaystyle M_{\text{filter}} & = & \displaystyle M_{\text{ILP}}\cdot M_{\text{PM2-R-PM1}}\cdot M_{\text{CON}}\cdot M_{\text{APM}}\cdot M_{\text{CON}}\nonumber\\ \displaystyle & & \displaystyle \cdot \,M_{\text{CPM}}\cdot M_{\text{LC}}\cdot M_{\unicode[STIX]{x1D706}/2}\cdot M_{\text{PZF}},\end{eqnarray}$$
where $M_{\text{filter}}$
is the Jones transfer matrix of the filter, and
$M_{\text{filter}}$
is the Jones transfer matrix of the filter, and $M_{\text{PZF}}$
,
$M_{\text{PZF}}$
, $M_{\unicode[STIX]{x1D706}/2}$
,
$M_{\unicode[STIX]{x1D706}/2}$
, $M_{\text{LC}}$
,
$M_{\text{LC}}$
, $M_{\text{CPM}}$
,
$M_{\text{CPM}}$
, $M_{\text{APM}}$
,
$M_{\text{APM}}$
, $M_{\text{CON}}$
,
$M_{\text{CON}}$
, $M_{\text{PM2-R-PM1}}$
, and
$M_{\text{PM2-R-PM1}}$
, and $M_{\text{ILP}}$
are matrices corresponding to the polarizing fiber, the half-wave plate, the liquid crystal, the pigtail of the second collimator, the auxiliary PMF, the connector, the axis-rotated PMF, and the ILP, respectively. After substituting Equation (5) into Equation (2), we can write the transfer function of the filter as
$M_{\text{ILP}}$
are matrices corresponding to the polarizing fiber, the half-wave plate, the liquid crystal, the pigtail of the second collimator, the auxiliary PMF, the connector, the axis-rotated PMF, and the ILP, respectively. After substituting Equation (5) into Equation (2), we can write the transfer function of the filter as
 $$\begin{eqnarray}\displaystyle H(f) & = & \displaystyle \sin \unicode[STIX]{x1D70C}\cdot \sin \unicode[STIX]{x1D703}_{\text{R}}-\unicode[STIX]{x1D702}\cdot \cos \unicode[STIX]{x1D70C}\cdot \cos \unicode[STIX]{x1D703}_{\text{R}}\nonumber\\ \displaystyle & & \displaystyle \cdot \,\exp \{-[i\unicode[STIX]{x1D711}_{\text{LC}}+i(2\unicode[STIX]{x1D70B}f\unicode[STIX]{x1D700}l_{\text{total}}+\unicode[STIX]{x1D711}_{\text{total}})]\}.\end{eqnarray}$$
Then, the intensity transfer function is
 $$\begin{eqnarray}\displaystyle |H(f)|^{2} & \propto & \displaystyle 1-\frac{2\tan \unicode[STIX]{x1D70C}\cdot \tan \unicode[STIX]{x1D703}_{\text{R}}}{\tan ^{2}\unicode[STIX]{x1D70C}\cdot \tan ^{2}\unicode[STIX]{x1D703}_{\text{R}}+1}\nonumber\\ \displaystyle & & \displaystyle \times \,\cos \{-[i\unicode[STIX]{x1D711}_{\text{LC}}+i(2\unicode[STIX]{x1D70B}f\unicode[STIX]{x1D700}l_{\text{total}}+\unicode[STIX]{x1D711}_{\text{total}})]\},\end{eqnarray}$$
where the effect of $\unicode[STIX]{x1D703}_{\text{CON}}$
is neglected for simplification because the rotations caused by the connectors are much smaller than the rotation angle of the axis-rotated PMF.
$\unicode[STIX]{x1D703}_{\text{CON}}$
is neglected for simplification because the rotations caused by the connectors are much smaller than the rotation angle of the axis-rotated PMF.
When comparing Equations (3) and (6), it is clear that the filter is principally similar to a PM patch cord. The peak wavelength, FSR, and modulation depth are determined by $\unicode[STIX]{x1D711}_{\text{LC}}+\unicode[STIX]{x1D711}_{\text{total}}$
,
$\unicode[STIX]{x1D711}_{\text{LC}}+\unicode[STIX]{x1D711}_{\text{total}}$
, $\unicode[STIX]{x1D700}l_{\text{total}}$
, and
$\unicode[STIX]{x1D700}l_{\text{total}}$
, and $\cos \unicode[STIX]{x1D70C}\cdot \cos \unicode[STIX]{x1D703}_{\text{R}}$
, respectively.
$\cos \unicode[STIX]{x1D70C}\cdot \cos \unicode[STIX]{x1D703}_{\text{R}}$
, respectively.
3.2 Performance of the filter
In this section, we constructed a system to investigate if the three factors can be decoupled as described above. Fortunately, it can be accomplished on certain conditions. And we constructed an experiment platform and testified it.
3.2.1 Tunability of the modulation depth
The value of $\unicode[STIX]{x1D703}_{\text{R}}$
has significant influence on the tunability of the modulation depth; therefore, it is important to choose an optimal value of
$\unicode[STIX]{x1D703}_{\text{R}}$
has significant influence on the tunability of the modulation depth; therefore, it is important to choose an optimal value of $\unicode[STIX]{x1D703}_{\text{R}}$
to achieve the best performance. Because
$\unicode[STIX]{x1D703}_{\text{R}}$
to achieve the best performance. Because $\unicode[STIX]{x1D703}_{\text{R}}$
only can be adjusted when splicing the rotated fiber, we should determine the best value for
$\unicode[STIX]{x1D703}_{\text{R}}$
only can be adjusted when splicing the rotated fiber, we should determine the best value for $\unicode[STIX]{x1D703}_{\text{R}}$
before the experiment.
$\unicode[STIX]{x1D703}_{\text{R}}$
before the experiment.
The modulation depth is related to $\unicode[STIX]{x1D703}_{\text{R}}$
and
$\unicode[STIX]{x1D703}_{\text{R}}$
and $\unicode[STIX]{x1D70C}$
. Here, we temporarily assume that
$\unicode[STIX]{x1D70C}$
. Here, we temporarily assume that $\unicode[STIX]{x1D70C}$
is constant to investigate the effect of
$\unicode[STIX]{x1D70C}$
is constant to investigate the effect of $\unicode[STIX]{x1D703}_{\text{R}}$
. According to Equation (7), the maximum dynamic range could be obtained for
$\unicode[STIX]{x1D703}_{\text{R}}$
. According to Equation (7), the maximum dynamic range could be obtained for $\unicode[STIX]{x1D703}_{\text{R}}=45^{\circ }$
. This can also be explained through the interference process of light from the two axes. As mentioned above, the filter behaves like a two-wave interferometer. If
$\unicode[STIX]{x1D703}_{\text{R}}=45^{\circ }$
. This can also be explained through the interference process of light from the two axes. As mentioned above, the filter behaves like a two-wave interferometer. If $\unicode[STIX]{x1D70C}$
is constant, and the effects of the connectors are neglected, the polarization mode coupling is realized through the axis rotation of the axis-rotated PMF. Thus, the strongest interference is obtained for
$\unicode[STIX]{x1D70C}$
is constant, and the effects of the connectors are neglected, the polarization mode coupling is realized through the axis rotation of the axis-rotated PMF. Thus, the strongest interference is obtained for $\unicode[STIX]{x1D703}_{\text{R}}=45^{\circ }$
.
$\unicode[STIX]{x1D703}_{\text{R}}=45^{\circ }$
.
Then, with the rotated PMF spliced at $45^{\circ }$
, the modulation depth can be adjusted solely by rotating the half-wave plate during the experiment. The influence of
$45^{\circ }$
, the modulation depth can be adjusted solely by rotating the half-wave plate during the experiment. The influence of $\unicode[STIX]{x1D70C}$
on the modulation depth was verified experimentally. In the experiment, the length of the auxiliary fiber was 3 m. At first, the second collimator was aligned at the proper angle to achieve the maximum modulation (corresponding to the yellow solid line in Figure 5). That is when the polarization direction after the wave plate was almost at
$\unicode[STIX]{x1D70C}$
on the modulation depth was verified experimentally. In the experiment, the length of the auxiliary fiber was 3 m. At first, the second collimator was aligned at the proper angle to achieve the maximum modulation (corresponding to the yellow solid line in Figure 5). That is when the polarization direction after the wave plate was almost at $45^{\circ }$
angle with the axis of the pigtail of the second collimator but not exactly, as the influence of the connectors, which contribute several degrees of rotation, should be considered in practice. In this case, the polarized injection was equally divided into two principle axes, and thus the strongest interference could be obtained at the rotation point of the rotated PMF.
$45^{\circ }$
angle with the axis of the pigtail of the second collimator but not exactly, as the influence of the connectors, which contribute several degrees of rotation, should be considered in practice. In this case, the polarized injection was equally divided into two principle axes, and thus the strongest interference could be obtained at the rotation point of the rotated PMF.

Figure 5. Variation of the transfer spectrum with rotation of the half-wave plate. The yellow and purple solid lines correspond to the maximum and minimum modulation and $\unicode[STIX]{x1D70C}=0^{\circ }$
and
$\unicode[STIX]{x1D70C}=0^{\circ }$
and $50^{\circ }$
, respectively, while the other solid lines correspond to
$50^{\circ }$
, respectively, while the other solid lines correspond to $\unicode[STIX]{x1D70C}=5^{\circ },10^{\circ },\ldots ,45^{\circ }$
. The auxiliary fiber length is 3 m.
$\unicode[STIX]{x1D70C}=5^{\circ },10^{\circ },\ldots ,45^{\circ }$
. The auxiliary fiber length is 3 m.
The variation of the transfer spectrum with rotation of the half-wave plate is shown in Figure 5. The yellow and purple solid lines correspond to the maximum and minimum modulation and to $\unicode[STIX]{x1D70C}=0^{\circ }$
and
$\unicode[STIX]{x1D70C}=0^{\circ }$
and $50^{\circ }$
, respectively, while the other solid lines correspond to
$50^{\circ }$
, respectively, while the other solid lines correspond to $\unicode[STIX]{x1D70C}=5^{\circ },10^{\circ },\ldots ,45^{\circ }$
. It should be mentioned that, in the experiment, the value on the mount scale was equal to the rotation angle of the axis of the half-wave plate, namely half of
$\unicode[STIX]{x1D70C}=5^{\circ },10^{\circ },\ldots ,45^{\circ }$
. It should be mentioned that, in the experiment, the value on the mount scale was equal to the rotation angle of the axis of the half-wave plate, namely half of $\unicode[STIX]{x1D70C}$
. The dashed lines from the bottom to the top correspond to
$\unicode[STIX]{x1D70C}$
. The dashed lines from the bottom to the top correspond to $\unicode[STIX]{x1D70C}$
of
$\unicode[STIX]{x1D70C}$
of $55^{\circ }$
–
$55^{\circ }$
– $70^{\circ }$
. This indicates that the modulation depth changed periodically with the adjustment of
$70^{\circ }$
. This indicates that the modulation depth changed periodically with the adjustment of $\unicode[STIX]{x1D70C}$
. Theoretically, the half-period should be
$\unicode[STIX]{x1D70C}$
. Theoretically, the half-period should be $45^{\circ }$
; however, owing to the low PER of the connectors and the splicing error of the rotated PMF, the half-period was
$45^{\circ }$
; however, owing to the low PER of the connectors and the splicing error of the rotated PMF, the half-period was ${\sim}53^{\circ }$
. In addition, the peak position had a slight shift during the rotation, which may be caused by the slight inclination of the plate surface.
${\sim}53^{\circ }$
. In addition, the peak position had a slight shift during the rotation, which may be caused by the slight inclination of the plate surface.
The dependence of the modulation depth (peak to peak) of the filter on the rotation angle $\unicode[STIX]{x1D70C}$
is further shown in Table 1. The maximum modulation was 13.8 dB (
$\unicode[STIX]{x1D70C}$
is further shown in Table 1. The maximum modulation was 13.8 dB ( $\unicode[STIX]{x1D70C}=0^{\circ }$
) corresponding to the strongest interference. The minimum modulation depth of nearly 0 dB (
$\unicode[STIX]{x1D70C}=0^{\circ }$
) corresponding to the strongest interference. The minimum modulation depth of nearly 0 dB ( $\unicode[STIX]{x1D70C}=53^{\circ }$
) was achieved when the polarization direction after the half-wave plate was almost parallel (or perpendicular) to the slow axis of the pigtail of the second collimator. In that case, the signal propagated only along the slow axis before the
$\unicode[STIX]{x1D70C}=53^{\circ }$
) was achieved when the polarization direction after the half-wave plate was almost parallel (or perpendicular) to the slow axis of the pigtail of the second collimator. In that case, the signal propagated only along the slow axis before the $45^{\circ }$
splicing point and therefore the signal was not influenced by the DGD. Although the signal existed on both axes after the
$45^{\circ }$
splicing point and therefore the signal was not influenced by the DGD. Although the signal existed on both axes after the $45^{\circ }$
splicing point, the lengths of the second piece of the axis-rotated PMF and the pigtail of the ILP were extremely small, and thus the effects of DGD of these two fibers on the spectrum modulation were negligible.
$45^{\circ }$
splicing point, the lengths of the second piece of the axis-rotated PMF and the pigtail of the ILP were extremely small, and thus the effects of DGD of these two fibers on the spectrum modulation were negligible.
Table 1. Evolution of modulation depth of the filter vs. rotation angle $\unicode[STIX]{x1D70C}$
.
$\unicode[STIX]{x1D70C}$
.
The experimental results shown in Table 1 are not always consistent with the simulation results due to (i) the PER deviation between in practice and in the simulation for different connectors and (ii) the alignment error, PER of the connectors, and splicing error of the rotated PMF in the experiment.
3.2.2 Tunability of the FSR
FSRs of the filter for various lengths of the auxiliary fiber are shown in Figure 6. According to Equation (7), this is determined by the group delay between the fast and slow waves, which is related to $\unicode[STIX]{x1D700}$
and the total length of the PMF including the pigtail fiber of the collimator (1 m), the auxiliary PMF, and the first piece before the splicing point (0.5 m) (see Figure 4). Thus, for 0-, 1.5-, 3-, and 5-m auxiliary fibers, the actual total fiber lengths affecting the FSR are 1.5, 3, 4.5, and 6.5 m, corresponding to the theoretical FSRs of 1.54, 0.76, 0.54, and 0.36 nm, respectively. The dashed lines in Figure 6 are the measured results. The peak shifting is owing to the vibration and pressure during the replacement of the auxiliary fiber. In order to clearly distinguish the variation of the FSR, the peaks are shifted to the same positions (see solid lines). The measured FSRs are 1.56, 0.7, 0.6, and 0.38 nm, showing agreement with the calculation results. Additionally, the modulation depths in Figures 6(a)–6(d) are slightly different, since the alignment angles of the connectors were slightly different for different auxiliary fibers in the experiment.
$\unicode[STIX]{x1D700}$
and the total length of the PMF including the pigtail fiber of the collimator (1 m), the auxiliary PMF, and the first piece before the splicing point (0.5 m) (see Figure 4). Thus, for 0-, 1.5-, 3-, and 5-m auxiliary fibers, the actual total fiber lengths affecting the FSR are 1.5, 3, 4.5, and 6.5 m, corresponding to the theoretical FSRs of 1.54, 0.76, 0.54, and 0.36 nm, respectively. The dashed lines in Figure 6 are the measured results. The peak shifting is owing to the vibration and pressure during the replacement of the auxiliary fiber. In order to clearly distinguish the variation of the FSR, the peaks are shifted to the same positions (see solid lines). The measured FSRs are 1.56, 0.7, 0.6, and 0.38 nm, showing agreement with the calculation results. Additionally, the modulation depths in Figures 6(a)–6(d) are slightly different, since the alignment angles of the connectors were slightly different for different auxiliary fibers in the experiment.

Figure 6. FSRs for various lengths of the auxiliary fiber. Plots (a)–(d) correspond to auxiliary fiber lengths of 0, 1.5, 3, and 5 m, respectively. The dashed lines represent the experimental results. The solid lines are obtained by shifting the dashed lines for better observation and comparison on the FSR variation.
Theoretically, the FSR of the filter has an extremely broad tunable range and can be adjusted from infinity (corresponding to $\unicode[STIX]{x1D700}l=0$
) to 0 (corresponding to
$\unicode[STIX]{x1D700}l=0$
) to 0 (corresponding to $\unicode[STIX]{x1D700}l=\infty$
). But in practice, it is limited by the finite length of the pigtail fiber of the collimator and the first piece before the splicing point.
$\unicode[STIX]{x1D700}l=\infty$
). But in practice, it is limited by the finite length of the pigtail fiber of the collimator and the first piece before the splicing point.
3.2.3 Tunability of the peak wavelength
The peak wavelength of the filter can be adjusted by changing the driving voltage applied to the NLC, which changes the phase retardance of the NLC. In this part, the modulation depth was adjusted to the maximum value to accurately measure the variation of the peak wavelength, and the auxiliary fiber was not used. Since the transmission spectrum of the filter is sinusoidal, we chose one of the peaks at 1053.33 nm as the reference when the driving voltage applied to the NLC was 0 V (the reference peaks are marked with vertical dashed lines in Figure 7(a)).

Figure 7. (a) Transfer spectra of the filter at different driving voltages. (b) Dependence of the peak wavelength (triangles) and peak power (black line) on the NLC voltage. The inset shows the retardance performance of the NLC. (c) Wavelength change with the phase retardance of the NLC. The auxiliary fiber length is 0 m.
The transfer spectra of the filter at different driving voltages and the variation of the peak wavelength with the driving voltage are shown in Figures 7(a) and 7(b), respectively. The peak wavelength shifts from 1053.33 nm to 1052.53 nm as the voltage increases from 0 to 10 V, while the peak power (black line) is almost constant, meaning that the modulation depth is almost unchanged in this case. The behavior of the peak wavelength (shown in Figure 7(b)) is proportional to that of the phase retardance provided by the NLC (see the inset of Figure 7(b)). This can explain why the peak wavelength shifts much faster when the voltage increases from 1 V to 5 V than for the voltage in the ranges of 0–1 V and 5–7 V, and why the peak wavelength is almost unchanged when the voltage increases from 7 V to 10 V, as shown in Figure 7(a).
The experimental and simulation results for the relationship between the peak wavelength and the phase retardance are shown in Figure 7(c). The experimental results (red rhombs) agree well with the simulation results (blue stars). The linear relationship indicates that our filter is suitable for closed-loop control. The total wavelength shift is ${\sim}0.8$
nm corresponding to
${\sim}0.8$
nm corresponding to $\unicode[STIX]{x0394}\unicode[STIX]{x1D711}_{\text{LC}}$
(the change in
$\unicode[STIX]{x0394}\unicode[STIX]{x1D711}_{\text{LC}}$
(the change in $\unicode[STIX]{x1D711}_{\text{LC}}$
) of
$\unicode[STIX]{x1D711}_{\text{LC}}$
) of ${\sim}1.1\unicode[STIX]{x1D70B}$
(0.55
${\sim}1.1\unicode[STIX]{x1D70B}$
(0.55 $\unicode[STIX]{x1D706}$
) for the auxiliary fiber length of 0 m. The total shift can be easily calculated as
$\unicode[STIX]{x1D706}$
) for the auxiliary fiber length of 0 m. The total shift can be easily calculated as $(\unicode[STIX]{x0394}\unicode[STIX]{x1D711}_{\text{LC}}/2\unicode[STIX]{x1D70B})\cdot \text{FSR}$
. If
$(\unicode[STIX]{x0394}\unicode[STIX]{x1D711}_{\text{LC}}/2\unicode[STIX]{x1D70B})\cdot \text{FSR}$
. If $\unicode[STIX]{x0394}\unicode[STIX]{x1D711}_{\text{LC}}$
is 2
$\unicode[STIX]{x0394}\unicode[STIX]{x1D711}_{\text{LC}}$
is 2 $\unicode[STIX]{x1D70B}$
, the total shift of the peak wavelength is equal to the period of the filter (1.56 nm for a 0-m auxiliary fiber). Thus, for
$\unicode[STIX]{x1D70B}$
, the total shift of the peak wavelength is equal to the period of the filter (1.56 nm for a 0-m auxiliary fiber). Thus, for $\unicode[STIX]{x0394}\unicode[STIX]{x1D711}_{\text{LC}}$
of
$\unicode[STIX]{x0394}\unicode[STIX]{x1D711}_{\text{LC}}$
of ${\sim}1.1\unicode[STIX]{x1D70B}$
, the total shift should be 0.858 nm, which is very close to our experimental result. This also indicates that the total shift of the peak wavelength changes with variation of FSR. The total shift of the peak wavelength decreases with increasing length of the auxiliary PMF. For the NLC used here, the total shifts of the peak wavelength are 0.858, 0.386, 0.33, and 0.209 nm for the auxiliary PMF lengths of 0, 1.5, 3, and 5 m, respectively.
${\sim}1.1\unicode[STIX]{x1D70B}$
, the total shift should be 0.858 nm, which is very close to our experimental result. This also indicates that the total shift of the peak wavelength changes with variation of FSR. The total shift of the peak wavelength decreases with increasing length of the auxiliary PMF. For the NLC used here, the total shifts of the peak wavelength are 0.858, 0.386, 0.33, and 0.209 nm for the auxiliary PMF lengths of 0, 1.5, 3, and 5 m, respectively.
The peak wavelength is influenced not only by the phase retardance $\unicode[STIX]{x1D711}_{\text{LC}}$
of the NLC but also by the phase accumulated in several pieces of PMFs in the filter, namely
$\unicode[STIX]{x1D711}_{\text{LC}}$
of the NLC but also by the phase accumulated in several pieces of PMFs in the filter, namely $\unicode[STIX]{x1D711}_{\text{total}}$
. Considering that
$\unicode[STIX]{x1D711}_{\text{total}}$
. Considering that $\unicode[STIX]{x1D711}_{\text{total}}$
fluctuates randomly with environmental conditions (mainly influenced by pressure), the PMFs should be well fixed to avoid the influence of the environment. In practice, stable encapsulation should be used for the PMFs in the filter to achieve better performance.
$\unicode[STIX]{x1D711}_{\text{total}}$
fluctuates randomly with environmental conditions (mainly influenced by pressure), the PMFs should be well fixed to avoid the influence of the environment. In practice, stable encapsulation should be used for the PMFs in the filter to achieve better performance.
4 Compensation experiment and discussion
4.1 Suppression of FM-to-AM conversion and discussion
In this section, we show the experimental results for FM-to-AM suppression by using the proposed filter. Here, the compensation process for State 3 in Figure 3 is demonstrated as an example. The spectrum is shown in Figure 8(a). As mentioned above, the strong AM is mainly contributed by the large-scale envelope (green dashed line) of the transmission spectrum. In order to achieve the best compensation, one should carefully choose the length of the auxiliary fiber to ensure the FSR of the filter consistent with that of the large-scale envelope. See the green dashed line in Figure 8(a), where the scale of the envelope is approximately 0.4 nm. Therefore, we used a 5-m auxiliary fiber in the filter, which corresponds to the FSR of 0.38 nm.

Figure 8. (a) Transmission spectra before (black line) and after (blue line) compensation. The green dashed line indicates the big-scale envelope which has the main effect on the FM-to-AM conversion. The numbers represent the transmittance values for each spectral line. (b) Temporal profiles of the output pulses before ( $\unicode[STIX]{x1D6FC}\approx 18\%$
) and after (
$\unicode[STIX]{x1D6FC}\approx 18\%$
) and after ( $\unicode[STIX]{x1D6FC}\approx 3.2\%$
) compensation.
$\unicode[STIX]{x1D6FC}\approx 3.2\%$
) compensation.
In the experiment, the temporal profile was measured by a high-speed oscilloscope with a bandwidth of 30 GHz (Agilent, DSO93004 L) together with a high-speed photodetector with a bandwidth of 45 GHz (Newport, 1014). The distortion criterion of the pulse was calculated by a computer in real time (see Figure 1). The transmission spectrum was measured by a commercial spectrograph. In order to investigate the compensation performance of the filter, we measured the spectra before (at point A) and after the filter (at point B) (see Figure 1) simultaneously. Note that, for clarity, the measuring instruments at point A are not shown. In order to achieve the full-period adjustment of the peak wavelength, we used a full-wave LC retarder (Thorlabs, LCC1113-B), which could provide phase retardance in the range of 0–2 $\unicode[STIX]{x1D70B}$
, instead of the LCC1112-B retarder used previously. The damage threshold of the NLC is approximately 3.56 J/cm
$\unicode[STIX]{x1D70B}$
, instead of the LCC1112-B retarder used previously. The damage threshold of the NLC is approximately 3.56 J/cm $^{2}$
for nanosecond pulses, which is much higher than the nonlinear threshold of the transmission fiber. Thus, the highest power this fiber filter could bear is dependent on the nonlinear threshold of fibers.
$^{2}$
for nanosecond pulses, which is much higher than the nonlinear threshold of the transmission fiber. Thus, the highest power this fiber filter could bear is dependent on the nonlinear threshold of fibers.
The transmission spectrum and the temporal profiles before and after compensation in the range of 1052.75–1053.26 nm (indicated with the red rectangle in Figure 7) are shown in Figures 8(a) and 8(b), respectively. This shows that, the AM can be well suppressed by carefully adjusting the half-wave plate and the NLC in the filter at a fixed length of the auxiliary fiber (5 m). Since fibers and elements in a system are generally fixed, the scale of the envelope, which depends on the time retardance $\unicode[STIX]{x0394}\unicode[STIX]{x1D70F}$
between two polarization modes, is almost invariable. Thus, for a certain system, the length of the auxiliary fiber is a constant value which does not need to be changed during the compensation. It is true that the FSR of the transmission spectrum would change if the length of the transmission fiber in the system changed. However, the filter has a high tolerance for the variation of the FSR of the system. The simulation results show that the filter with 5-m auxiliary fiber can suppress the AM below 7% in the FSR range from 1.8 to 0.25 nm. See the blue line in Figure 8(a). The values of transmittance for the spectral lines of the signal are nearly identical after the compensation, and the distortion criterion is significantly suppressed from 18.4% to 3.2% in several seconds. Although the transmission spectrum was not flattened entirely, the peak of the large-scale envelope was adjusted to coincide with the signal center frequency, and thus could greatly decrease the amount of AM[Reference Rothenberg, Browning and Wilcox5]. The residual FM-to-AM conversion stems from the distortion of two lines with transmittance values of 0.92 and 0.81 (the central peak and the third sideband in the long wave). Nevertheless, since the energy of these two components is small, the residual FM-to-AM conversion is also small.
$\unicode[STIX]{x0394}\unicode[STIX]{x1D70F}$
between two polarization modes, is almost invariable. Thus, for a certain system, the length of the auxiliary fiber is a constant value which does not need to be changed during the compensation. It is true that the FSR of the transmission spectrum would change if the length of the transmission fiber in the system changed. However, the filter has a high tolerance for the variation of the FSR of the system. The simulation results show that the filter with 5-m auxiliary fiber can suppress the AM below 7% in the FSR range from 1.8 to 0.25 nm. See the blue line in Figure 8(a). The values of transmittance for the spectral lines of the signal are nearly identical after the compensation, and the distortion criterion is significantly suppressed from 18.4% to 3.2% in several seconds. Although the transmission spectrum was not flattened entirely, the peak of the large-scale envelope was adjusted to coincide with the signal center frequency, and thus could greatly decrease the amount of AM[Reference Rothenberg, Browning and Wilcox5]. The residual FM-to-AM conversion stems from the distortion of two lines with transmittance values of 0.92 and 0.81 (the central peak and the third sideband in the long wave). Nevertheless, since the energy of these two components is small, the residual FM-to-AM conversion is also small.
4.2 Closed-loop experiment and discussion
In PMFs, the relative phase between two axes varies temporally due to fluctuations of temperature and strain. This results in a time-varying transmission spectrum. Thus, the pulse distortion criterion in the front end based on PMFs may fluctuate in a range from 3% to over 18% in several minutes[Reference Qiao, Wang, Fan, Li, Jiang, Li, Huang and Lin17]. It is impossible to suppress the PMD-induced FM-to-AM conversion at the minimum over a long time using a static filter. As mentioned above, the FSR of the system generally did not change a lot. Therefore, to achieve the real-time compensation, a closed-loop software was developed to automatically control the rotation of the half-wave plate and adjust the voltage applied to the NLC.
In the experiment, the temporal profile of pulses was measured by an oscilloscope and transferred to a computer. Then, the real-time distortion criterion of pulses, which is used as the feedback signal, was calculated once per second by a home-made software[Reference Chou, Valley, Hernandez, Bennett, Pelz, Heebner, Di Nicola, Rever and Bowersa20]. Proportional–integral–derivative (PID) algorithm[Reference Ang, Chong and Li21] was used to control the elements in the filter to automatically find the state of the minimum modulation depth and keep the FM-to-AM conversion at minimum over a long time. During the compensation, the half-wave plate needs to be controlled constantly, while the NLC was adjusted once only if the AM could not be well suppressed through the half-wave plate. This is owing to the different contributions of the modulation depth and the peak drift on the amount of AM. The modulation depth is induced by the polarization coupling of the whole system. This is a result of the accumulative effect of each fiber, and hence strongly relates to the environmental variations. The time-varying modulation depth has a significant impact on the amount of AM. Therefore, for the long-term suppression, the rotation angle of the half-wave plate of the filter should be continuously adjusted to respond to the change of the modulation depth. Meanwhile, the peak drift stems from the variation of the relative phase of the fast and slow waves[Reference Rothenberg, Browning and Wilcox5]. This would occur as the temperature or fiber stress changes. Nevertheless, the scale of the envelope is so large that this small drift just has a few impacts on the amount of AM in a short time. Only if the time is so long (decades of minutes) that the amount of the peak drift is comparable with the scale of the envelop, the NLC of the filter needs to be adjusted to rectify the peak of the transmission spectrum.
Owing to the linear relationship between the rotation angle and the modulation depth, and the voltage of NLC and the peak wavelength, the algorithm is simple and has a very fast calculation speed. Therefore, for this system, the response time is mainly limited by the calculation speed of the modulation depth. It should be mentioned that the real-time transmission spectrum could be used as a feedback signal as well. However, the algorithms for spectral recognition and feedback signal calculation are extremely complicated and time-consuming, so the approach is not suitable for our application.
The values of distortion criterion $\unicode[STIX]{x1D6FC}$
before (at point A in Figure 1) and after the filter (at point B) were monitored simultaneously for nearly 3 h, as shown in Figure 9. Using feedback control, the fluctuation after the filter could be reduced to 2%–6.5%. Compared with the fluctuation of 3%–18% before the filter, the FM-to-AM conversion was suppressed considerably. However, although the FM-to-AM conversion could be suppressed to 2% under the optimal conditions, this suppression could not be maintained for a long time. This is related to the principle of the PID algorithm. In the algorithm, the proportional gain
$\unicode[STIX]{x1D6FC}$
before (at point A in Figure 1) and after the filter (at point B) were monitored simultaneously for nearly 3 h, as shown in Figure 9. Using feedback control, the fluctuation after the filter could be reduced to 2%–6.5%. Compared with the fluctuation of 3%–18% before the filter, the FM-to-AM conversion was suppressed considerably. However, although the FM-to-AM conversion could be suppressed to 2% under the optimal conditions, this suppression could not be maintained for a long time. This is related to the principle of the PID algorithm. In the algorithm, the proportional gain $K_{\text{P}}$
is the key parameter for the adaptive compensation process and has strong influence on the compensation speed and the system performance. In the control software,
$K_{\text{P}}$
is the key parameter for the adaptive compensation process and has strong influence on the compensation speed and the system performance. In the control software, $K_{\text{P}}$
was reduced (increased) by degrees with the decreasing (increasing) of the FM-to-AM conversion. However, the variation of the PMD-induced FM-to-AM conversion was random. A strong and sudden disturbance added on the PMF may result in a dramatic change of the FM-to-AM conversion[Reference Qiao, Wang, Fan, Li, Jiang, Li, Huang and Lin17]. If it appeared at the moment when the FM–AM conversion was suppressed to a small value, the system would not be able to respond sufficiently fast due to the small
$K_{\text{P}}$
was reduced (increased) by degrees with the decreasing (increasing) of the FM-to-AM conversion. However, the variation of the PMD-induced FM-to-AM conversion was random. A strong and sudden disturbance added on the PMF may result in a dramatic change of the FM-to-AM conversion[Reference Qiao, Wang, Fan, Li, Jiang, Li, Huang and Lin17]. If it appeared at the moment when the FM–AM conversion was suppressed to a small value, the system would not be able to respond sufficiently fast due to the small $K_{\text{P}}$
. In this situation, the FM-to-AM conversion would keep increasing until
$K_{\text{P}}$
. In this situation, the FM-to-AM conversion would keep increasing until $K_{\text{P}}$
was sufficiently large to make the PID loop respond to this variation. To solve this problem, we will further improve the calculation rate of the modulation depth and use the elements with higher adjustment speed to advance the response time.
$K_{\text{P}}$
was sufficiently large to make the PID loop respond to this variation. To solve this problem, we will further improve the calculation rate of the modulation depth and use the elements with higher adjustment speed to advance the response time.

Figure 9. FM-to-AM conversion before and after compensation monitored for 3 h.
5 Conclusion
In summary, the FM-to-AM conversion in the PM front end induced by PMD was analyzed. In order to suppress the FM-to-AM conversion, we carefully discussed the effect of the transmission spectrum on the amount of AM. It is revealed that the large-scale envelope reduced by the accumulative effect of PMD had a major impact. The result indicates that it is possible to use a decoupled multi-DOF spectral filter to suppress the PMD-induced FM-to-AM conversion.
Then, we proposed a novel multi-DOF spectral filter. The operating principle of the filter was analyzed, and its decoupled controllability was verified through experiment and simulation. It is shown that the modulation depth, peak wavelength, and FSR of the filter could be adjusted independently, which is suitable to respond to the variation of the transmission spectrum of the PM front end. The results show that the modulation depth of the filter can be tuned in the range of 0–13.8 dB by rotating the half-wave plate when $\unicode[STIX]{x1D703}_{\text{R}}=45^{\circ }$
(corresponds to the largest dynamic range). Theoretically, the FSR of the filter can be continuously changed from infinity (corresponding to
$\unicode[STIX]{x1D703}_{\text{R}}=45^{\circ }$
(corresponds to the largest dynamic range). Theoretically, the FSR of the filter can be continuously changed from infinity (corresponding to $\unicode[STIX]{x1D700}l_{\text{total}}=0$
) to 0 (corresponding to
$\unicode[STIX]{x1D700}l_{\text{total}}=0$
) to 0 (corresponding to $\unicode[STIX]{x1D700}l_{\text{total}}=\infty$
) by using different length auxiliary PMFs. The total shift of the peak wavelength is related to both the phase retardance of the NLC and FSR of the filter. For an NLC that can provide a retardance of 1.1
$\unicode[STIX]{x1D700}l_{\text{total}}=\infty$
) by using different length auxiliary PMFs. The total shift of the peak wavelength is related to both the phase retardance of the NLC and FSR of the filter. For an NLC that can provide a retardance of 1.1 $\unicode[STIX]{x1D70B}$
, the total wavelength shift is equal to 0.55FSR, i.e., 0.858 nm for a 0-m auxiliary PMF and 0.209 nm for a 5-m auxiliary PMF. Using an NLC with a large phase retardance can improve the peak wavelength tunability.
$\unicode[STIX]{x1D70B}$
, the total wavelength shift is equal to 0.55FSR, i.e., 0.858 nm for a 0-m auxiliary PMF and 0.209 nm for a 5-m auxiliary PMF. Using an NLC with a large phase retardance can improve the peak wavelength tunability.
Finally, the filter with closed-loop control using a PID algorithm was applied to automatically compensate for the PMD-induced FM-to-AM conversion in the front end of a high-power laser facility; and it exhibits excellent performance. According to the results, the pulse distortion criterion could be suppressed from 18% to 3.2% within a short time and maintained below 6.5% for over 3 h with the closed-loop control.
The proposed filter can also be applied to suppression of the FM-to-AM conversion caused by other filtering effects in high-power laser systems, owing to its good controllability and flexibility. In addition, it can be used to implement spectral filtering for fiber laser cavities, frequency-comb generation, or other applications that require controllable real-time spectral shaping.
Acknowledgements
This work was supported by the International Partnership Program of Chinese Academy of Sciences (No. 181231KYSB20170022).
Appendix A. Filter modeling
The filter can be modeled with a Jones transfer matrix as follows:
 $$\begin{eqnarray}\displaystyle M_{\text{filter}} & = & \displaystyle M_{\text{ILP}}\cdot M_{\text{PM2-R-PM1}}\cdot M_{\text{CON}}\cdot M_{\text{APM}}\nonumber\\ \displaystyle & & \displaystyle \cdot \,M_{\text{CON}}\cdot M_{\text{CPM}}\cdot M_{\text{LC}}\cdot M_{\unicode[STIX]{x1D706}/2}\cdot M_{\text{PZF}},\nonumber\end{eqnarray}$$
where $M_{\text{filter}}$
is the Jones transfer matrix of the filter, and
$M_{\text{filter}}$
is the Jones transfer matrix of the filter, and $M_{\text{PZF}}$
,
$M_{\text{PZF}}$
, $M_{\unicode[STIX]{x1D706}/2}$
,
$M_{\unicode[STIX]{x1D706}/2}$
, $M_{\text{LC}}$
,
$M_{\text{LC}}$
, $M_{\text{CPM}}$
,
$M_{\text{CPM}}$
, $M_{\text{APM}}$
,
$M_{\text{APM}}$
, $M_{\text{CON}}$
,
$M_{\text{CON}}$
, $M_{\text{PM2-R-PM1}}$
, and
$M_{\text{PM2-R-PM1}}$
, and $M_{\text{ILP}}$
are matrices corresponding to the polarizing fiber, the half-wave plate, the liquid crystal, the pigtail of the second collimator, the auxiliary PMF, the connector, the axis-rotated PMF, and the ILP. The pigtail of the first collimator is a fast-axis-blocked PZ fiber, so
$M_{\text{ILP}}$
are matrices corresponding to the polarizing fiber, the half-wave plate, the liquid crystal, the pigtail of the second collimator, the auxiliary PMF, the connector, the axis-rotated PMF, and the ILP. The pigtail of the first collimator is a fast-axis-blocked PZ fiber, so $M_{\text{PZF}}$
is
$M_{\text{PZF}}$
is
 $$\begin{eqnarray}M_{\text{PZF}}=\left[\begin{array}{@{}c@{}}0\\ 1\end{array}\right],\end{eqnarray}$$
and $M_{\unicode[STIX]{x1D706}/2}$
can be expressed as
$M_{\unicode[STIX]{x1D706}/2}$
can be expressed as
 $$\begin{eqnarray}M_{\unicode[STIX]{x1D706}/2}=\left[\begin{array}{@{}cc@{}}\cos (2\unicode[STIX]{x1D6FE}) & \sin (2\unicode[STIX]{x1D6FE})\\ \sin (2\unicode[STIX]{x1D6FE}) & -\text{cos}(2\unicode[STIX]{x1D6FE})\end{array}\right],\end{eqnarray}$$
where $\unicode[STIX]{x1D6FE}$
is the angle between the polarization direction and the optical axis of the half-wave plate. When the optical axis of the half-wave plate is aligned with the polarization of the injection, we have
$\unicode[STIX]{x1D6FE}$
is the angle between the polarization direction and the optical axis of the half-wave plate. When the optical axis of the half-wave plate is aligned with the polarization of the injection, we have $2\unicode[STIX]{x1D6FE}=\unicode[STIX]{x1D70C}$
. Thus,
$2\unicode[STIX]{x1D6FE}=\unicode[STIX]{x1D70C}$
. Thus, $M_{\unicode[STIX]{x1D706}/2}$
is equivalent to
$M_{\unicode[STIX]{x1D706}/2}$
is equivalent to $M_{\unicode[STIX]{x1D706}/2}=[\!\begin{smallmatrix}\cos \unicode[STIX]{x1D70C} & \sin \unicode[STIX]{x1D70C}\\ \sin \unicode[STIX]{x1D70C} & -\text{cos}\unicode[STIX]{x1D70C}\end{smallmatrix}\!]$
.
$M_{\unicode[STIX]{x1D706}/2}=[\!\begin{smallmatrix}\cos \unicode[STIX]{x1D70C} & \sin \unicode[STIX]{x1D70C}\\ \sin \unicode[STIX]{x1D70C} & -\text{cos}\unicode[STIX]{x1D70C}\end{smallmatrix}\!]$
.
In the filter, the optical axis of the NLC is parallel to the slow axis of the next PMF, the transfer matrix of the NLC $M_{\text{LC}}$
is
$M_{\text{LC}}$
is
 $$\begin{eqnarray}M_{\text{LC}}=\left[\begin{array}{@{}cc@{}}1 & 0\\ 0 & \unicode[STIX]{x1D702}e^{-i\unicode[STIX]{x1D711}_{\text{LC}}}\end{array}\right],\end{eqnarray}$$
where $\unicode[STIX]{x1D702}$
and
$\unicode[STIX]{x1D702}$
and $\unicode[STIX]{x1D711}_{\text{LC}}$
are the relative loss and phase retardance of the slow and fast axes, respectively. Here, the optical axis of the NLC is aligned to the slow axis of the next PMF. The matrices for the connector and the PMF have been shown in Equation (1). The matrix of the axis-rotated PMF
$\unicode[STIX]{x1D711}_{\text{LC}}$
are the relative loss and phase retardance of the slow and fast axes, respectively. Here, the optical axis of the NLC is aligned to the slow axis of the next PMF. The matrices for the connector and the PMF have been shown in Equation (1). The matrix of the axis-rotated PMF $M_{\text{PM2-R-PM1}}$
is
$M_{\text{PM2-R-PM1}}$
is
 $$\begin{eqnarray}\displaystyle & & \displaystyle M_{\text{PM2-R-PM1}}=M_{\text{PM2}}M_{\text{R}}M_{\text{PM1}}=\left[\begin{array}{@{}cc@{}}1 & 0\\ 0 & e^{-i(2\unicode[STIX]{x1D70B}f\unicode[STIX]{x1D700}l_{2}+\unicode[STIX]{x1D711}_{\text{p2}})}\end{array}\right]\nonumber\\ \displaystyle & & \displaystyle \qquad \times \,\left[\begin{array}{@{}cc@{}}\cos \unicode[STIX]{x1D703}_{\text{R}} & -\text{sin}\unicode[STIX]{x1D703}_{\text{R}}\\ \sin \unicode[STIX]{x1D703}_{\text{R}} & \cos \unicode[STIX]{x1D703}_{\text{R}}\end{array}\right]\left[\begin{array}{@{}cc@{}}1 & 0\\ 0 & e^{-i(2\unicode[STIX]{x1D70B}f\unicode[STIX]{x1D700}l_{1}+\unicode[STIX]{x1D711}_{\text{p1}})}\end{array}\right],\end{eqnarray}$$
where $M_{\text{PM1}}$
is the matrix of the first piece of the rotated PMF,
$M_{\text{PM1}}$
is the matrix of the first piece of the rotated PMF, $M_{\text{R}}$
represents the effect of the alignment angle of the rotated PMF,
$M_{\text{R}}$
represents the effect of the alignment angle of the rotated PMF, $M_{\text{PM2}}$
represents the effects of the second piece of the rotated PMF and the pigtail of the ILP,
$M_{\text{PM2}}$
represents the effects of the second piece of the rotated PMF and the pigtail of the ILP, $\unicode[STIX]{x1D703}_{\text{R}}$
is the alignment angle between the two pieces in the axis-rotated PMF,
$\unicode[STIX]{x1D703}_{\text{R}}$
is the alignment angle between the two pieces in the axis-rotated PMF, $l_{1},l_{2}$
are the lengths of the first and the second piece of the axis-rotated PMF, respectively,
$l_{1},l_{2}$
are the lengths of the first and the second piece of the axis-rotated PMF, respectively, $\unicode[STIX]{x1D700}$
denotes the DGD coefficient, and
$\unicode[STIX]{x1D700}$
denotes the DGD coefficient, and $\unicode[STIX]{x1D711}_{\text{p}}$
is the relative phase between the two axes. Finally, for the fast-axis-blocked ILP placed at the end of the filter, the Jones matrix can be written as [Reference Penninckx, Beck, Gleyze and Videau9]
$\unicode[STIX]{x1D711}_{\text{p}}$
is the relative phase between the two axes. Finally, for the fast-axis-blocked ILP placed at the end of the filter, the Jones matrix can be written as [Reference Penninckx, Beck, Gleyze and Videau9]
 $$\begin{eqnarray}M_{\text{ILP}}=\left[\begin{array}{@{}cc@{}}0 & 0\\ 0 & 1\\ \end{array}\right].\end{eqnarray}$$
Here, since the injection fiber of the ILP is taken into account in the matrix for the second piece of the rotated PMF, it is not included in Equation (A 5).


 Open access