Introduction
The sustained ultra-low fertility has been found in almost all high-income countries in East and South East Asia. In 2014, the total fertility rate (TFR) was 1.19 (children per woman) in Singapore, 1.23 in Hong Kong, 1.21 in South Korea, 1.17 in Taiwan, and 1.42 in Japan (DGBAS, 2014; HKCSD, 2015; KOSIS, 2015; MHLW, 2014; NPTD, 2014). The transition from very high to very low fertility over the past few decades has resulted in a rapidly ageing population and a shrinking labour force (P. Straughan et al., Reference Straughan, Chan and Jones2008). These rapid demographic changes have a tremendous impact on social and economic development. Concerned with these consequences, many countries have adopted pro-natalist policies with the aim of slowing down, if not reversing, the fertility decline. We examine whether these policies are effective.
Most previous studies were mainly focused on the outcome of the policies, evaluating the effectiveness of pro-natalist policies in terms of actual changes in TFR. However, attributing the observed changes in fertility rates to some specific pro-natalist policies is difficult, as there are many other unmeasured factors which might be responsible for the observed changes. Moreover, the policy impact evaluation – even based on very sophisticated modelling – often leads to pessimistic conclusions (G. Jones et al., Reference Jones, Straughan and Chan2008). Unlike previous studies, the objective of this study is to identify the most influential groups in determining the TFR and to assess the targeting of pro-natalist measures adopted by the government.
Here, we focus on the case of Singapore, where the TFR has declined continuously over the last decade – a period when various pro-natalist policies have been strengthened significantly. Specifically, we conduct an elasticity analysis based on a stochastic model to assess the roles of different subgroups of women (classified by their age, marital status and parity levels) in determining the TFR and identify those who can have the largest influence on TFR as potential pro-natalist targets. Then we review Singapore's pro-natalist measures to examine whether the potential groups identified have been targeted by current policies. In this way, this study can provide practical implications for Singapore and may also generate insights for other low-fertility high-income Asian countries.
This study is structured as follows. We first review the existing literature on the effectiveness and targeting of pro-natalist policies. We then give a brief overview of the fertility transition as well as the development of population policies in Singapore. In the Data and Method section, we explain the details and advantages of the stochastic model and elasticity analysis. In the Results section, we present our findings and examine the possible targeting mismatch in the current pro-natalist policies. Finally, we draw out conclusions from our analysis and discuss the policy implications.
Literature Review
The effectiveness of pro-natalist policies is theoretically based on the economic theory of fertility, according to which the demand for children depends on individual preference and the cost of children – including the direct cost and the opportunity cost (Becker, Reference Becker1960; Cigno, Reference Cigno1991; Ermisch and Ogawa, Reference Ermisch and Ogawa1994; Gauthier and Hatzius, Reference Gauthier and Hatzius1997; Willis, Reference Willis1973). It is believed that policies that can help reduce the cost will increase people's demand for children. The so-called baby bonus, child allowance, tax relief, and tax rebate have been introduced in many countries (for example, in Australia and Singapore), to compensate for the direct spending on children. Maternity and parental leave benefits as well as childcare facilities and services can compensate for mothers’ lost earnings due to childbearing and childrearing, and help them combine work and family. But whether these measures can finally encourage couples to have more children depends on two prerequisites: that (a) people's demand for ‘the quality of children’ (i.e. the human capital of children, such as educational or occupational attainment) does not change so that quantity is not affected by ‘quality’; and that (b) people's desire for children does not change (Ermisch and Ogawa, Reference Ermisch and Ogawa1994; L.E. Jones et al., Reference Jones, Schoonbroodt and Tertilt2008).
Empirically, most studies conclude that pro-natalist policies have a positive but small impact on fertility (Gauthier, Reference Gauthier2013). On one hand, it may be because the financial support in most countries is still inadequate compared to the actual cost of children (Gauthier, Reference Gauthier2013). On the other hand, nowadays the two prerequisites have been greatly challenged in reality. With the increasing parental expectation for children's education – especially in these high-income Asian societies, the demand for ‘the quality of children’ is rising and the expenditure on each child is surging (Jones, Reference Jones2012a). Thus, due to the quality-quantity tradeoff, policies may not increase people's demand for the number of children. Meanwhile, the fertility decline is accompanied by rising educational attainment and financial independence of women as well as changing values towards marriage and childbearing. Currently, many features of the Second Demographic Transition (a transition driven by ideational changes with emphasis on self-realisation, leading to changes in family and social behaviours, such as rise in divorce and cohabitation and delay in marriage and childbearing) have already spread to these Asian countries, indicating that aspirations for self-actualisation are increasing while preferences for children may have declined (Lesthaeghe, Reference Lesthaeghe2010).
However, it is still believed that the centrality of marriage and childbearing has not been shaken in Asia (Raymo et al., Reference Raymo, Park, Xie and Yeung2015). Though greatly delayed, the majority still desire marriage if they can find a suitable partner. Though cohabitation is rising, out-of-wedlock births are still not socially acceptable in Asian countries. Though fewer and fewer couples desire three or more children, ‘having at least one’ is still the mainstream in Asian societies like Singapore, whereas only 3 per cent of married couples intended to be childless (NPTD, 2013). Within this context, Lutz and Skirbekk (Reference Lutz and Skirbekk2005) have suggested ‘tempo policies’ (policies targeting the timing of family formation and childbearing) for countries like Japan, South Korea and Singapore, to facilitate family formation and low-order births at a younger age for those who desire marriage and children, so that the TFR may be raised effectively before the ‘low fertility trap’ is established.
Despite no significant impact on the TFR at the population level, there exists considerable heterogeneity of policy impacts across subgroups in a population, especially across parity-specific groups (Gauthier, Reference Gauthier2013). Regarding the impact on women with different numbers of children, findings are inconsistent across countries. The universal baby bonus in Australia is found to have a positive effect on second births (Drago et al., Reference Drago, Sawyer, Shreffler, Warren and Wooden2011); in Hungary, second and third births are found to be more responsive to child-related benefits (Gábos et al., Reference Gábos, Gál and Kézdi2009); child allowances in the UK encourage early motherhood as well as third and fourth births (Ermisch, Reference Ermisch1988); in Canada, Milligan (Reference Milligan2005) has found that cash benefits have a strong impact on third or higher-order children in Quebec. However, it is also evidenced that policies targeting first births may have a larger effect on the fertility rate at the population level than targeting third births (Gauthier and Hatzius, Reference Gauthier and Hatzius1997). One possible explanation for these mixed findings is that, at the micro level, as people make transitions to the first, second, third or higher-order births, the marginal cost of each child varies widely from country to country and, although some subgroups respond to pro-natalist incentives positively, if the size of these groups is too small, policies may not lead to a big change in the total fertility rate at the population level.
Investigating the composition of women at childbearing age and assessing the roles of different subgroups in determining the fertility trends could have important implications for pro-natalist policies. Previous studies of East and South-East Asian countries have demonstrated that the composition of women of reproductive ages has changed dramatically, when compared with previous decades. As a result of a rapid increase in singlehood, marriage is becoming a crucial factor that indirectly affects the future trajectory of fertility. With a rising proportion of children born to older women, fertility is ageing; the recovery of delayed births is weak (i.e. people starting to have children after a period of childbearing postponement), with a decline in three-child families and increase in one-child families (Atoh et al., Reference Atoh, Kandiah and Ivanov2004; Frejka et al., Reference Frejka, Jones and Sardon2010; P. Straughan et al., Reference Straughan, Chan and Jones2008). If policies can affect the groups of women who are most influential in changing the TFR, a significant increase in the fertility rate might be seen.
Background of Singapore: Transitions of Fertility and Policies
Singapore has witnessed dramatic socioeconomic and demographic changes in the past decades. Rapid industrialisation and urbanisation have been accompanied by prolonged fertility decline, population ageing and increasing in-migration. At present, the issue of low fertility is one of the biggest demographic challenges to Singapore's sustainable development. Within this context, the Singapore Government has shifted the focus of its population policies from the initial anti-natalism to pro-natalism. Compared to other high-income Asian economies with ultra-low fertility (such as Japan, South Korea, Hong Kong and Taiwan), Singapore started earlier and has gone further in the development of pro-natalist policies (Jones, Reference Jones2012b).
Figure 1 shows the fertility transition of Singapore, together with the transition of its population policies. The TFR of Singapore started to decline even before its independence. In 1965 when Singapore gained independence from Malaysia, its TFR was 4.6 children per woman. At the beginning, in order to speed up the socioeconomic development, the government adopted family planning programmes to control the population growth (Yap and Gee, Reference Yap and Gee2015). From 1965 to 1986, when anti-natalist policies were implemented, the TFR decreased continuously and at a rapid rate, reaching the replacement level in 1975. Ever since, Singapore has become a country with sub-replacement fertility.
Figure 1. The transitions of fertility and population policies in Singapore during 1957–2015
In 1987 when TFR was only 1.6 children per woman, the Singapore Government announced a selectively pro-natalist new population policy, with the slogan ‘Three or more, if you can afford it’, replacing the previous population control policies (Wong and Yeoh, Reference Wong and Yeoh2003; Yap and Gee, Reference Yap and Gee2015). With this policy transition, a series of measures was introduced such as a special tax rebate to help with the additional financial burden, a subsidy for children enrolled in childcare centres, and priority in public housing allocation for families with children. The measures have been gradually enhanced and added to over the years. In 2001, the Singapore Government repackaged existing pro-natalist policies as ‘Marriage and Parenthood Package’ (M&P Package), which was further enhanced in 2004, 2008 and 2013. The latest enhancement was in January 2015. Currently, this package ‘comprises a comprehensive range of measures to address our evolving needs as we move through life – from marriage, to becoming parents, and raising children’ (HEYBABY, 2015).
Through several enhancements of the M&P Package, the financial support to families which relates to childbearing and childrearing has become increasingly generous, including the baby bonus (which consists of cash gifts and co-savings) and tax measures. We will revisit these financial measures in the Results section, where we compare the target groups these measures are aimed at with the groups identified by our analysis.
After realising the ineffectiveness of financial incentives (Jones, Reference Jones2012a), the Singapore Government added other pro-natalist measures in every enhancement of the M&P Package over the past decade. Various kinds of leave were being implemented to help working parents have more time with children: 16-week paid maternity leave for mothers; two-week paid paternity leaves for fathers (one week is mandatory and the additional week is voluntary and at the discretion of employers); six-days unpaid infant care leave per year for each parent. To create a family-friendly working environment, the Work-Life Grant was set up to encourage employers to implement work-life strategies and flexible working arrangements. These two measures aim to reduce work-life conflicts. As women nowadays have children at older ages, a series of schemes has also been employed to meet the medical needs in conception and delivery. For instance, the government helps co-fund up to 75 per cent of the cost of couples’ Assisted Reproduction Technology (ART). To reduce the cost in childcare and infant care, the government has provided subsidies, which were enhanced in 2013 to S$300 per month and S$600 per month, respectively. The Foreign Domestic Work Levy (about S$145 concession per month) and Grandparent Caregiver Relief (about S$3,000) are also available.
Up until now, many studies on Singapore have evaluated the impact of these pro-natalist measures, both quantitatively and qualitatively; a series of surveys has also been conducted to investigate the public perception of these policies (Sun, Reference Sun2012; Teo, Reference Teo2010; Zhang et al., Reference Zhang, Jean Yeung and Hsiao-Li Sun2012). Most of these studies conclude that, in terms of fertility rates, the impact of existing pro-natalist policies is modest at best (Quah, Reference Quah2003; Saw, Reference Saw2005; P. T. Straughan et al., Reference Straughan, Chan and Jones2008; Teo, Reference Teo2010). Here, instead of examining the impact or outcome of the policies, this paper aims to identify the most influential groups in determining Singapore's TFR and assess the targeting of pro-natalist policies adopted by the government.
Data and Method
Data source
The data required for the analysis are the age-parity specific fertility rates for married women (APSFR) and the age-specific first marriage rates of women at childbearing ages (ASMR). The study period was from 2000 to 2010.
The APSFRs are calculated by dividing the number of the (j+1)th births born to married women at age n and parity j by the number of married women at age n and parity j. As the denominator is the population of married women at real risk of having (j+1)th birth, the APSFR is actually an incidence rate. Since out-of-wedlock births are very rare in Singapore (less than 2 per cent), the APSFR can be a good proxy for the age-specific probability of the parity transitions at the population level. Though the data on age-specific fertility rates are publicly available, APSFRs are not, and we therefore had to devise our own estimation. Data for resident women by age, marital status and parity come from the 2000 and 2010 population censuses as well as the 2005 general household survey. Data for resident births by mother's age and parity in 2000, 2005 and 2010, were obtained with the assistance of the National Population and Talent Division, Prime Minister's Office. APSFRs are computed based on these data.
The ASMRs are calculated by dividing the number of first marriages in each age group by the number of never-married resident women in the age group. This is also an incidence rate, reflecting the age-specific probability of first marriages at the population level. The data for never-married resident women by age group come from the 2000 and 2010 population censuses as well as the 2005 general household survey. The data for first marriages by age groups in 2000, 2005 and 2010, are from published statistics on Marriages and Divorces.
The stochastic model for family formation and parity transitions
Due to the small proportion of non-marital births in Singapore, we assume that all single women will enter into marriage before the transition to parenthood. For ease of illustration, it is also assumed that each woman can have a maximum of three children over her reproductive life span (as there are very few births of the fourth and higher orders); that one woman can give birth to one child at most each year; and that marriage and childbirth cannot happen in the same year. Here, the case of having multiple births is not considered in our analysis.
Based on these assumptions, we construct a stochastic model to describe the family formation and parity transitions of women over their reproductive years, as shown in Figure 2. The vertical arrow represents the family formation of never-married women. And the three horizontal arrows (from left to right) represent the parity transition of married women from parity 0 to 1, 1 to 2, and 2 to 3.
Figure 2. Family formation and parity transitions
According to the model, a woman at age n may be in any of the five states: ‘never-married’, ‘married with 0 child’, ‘married with 1 child’, ‘married with 2 children’, or ‘married with 3 children’. These five states are denoted as U(0), M(0), M(1), M(2), and M(3), respectively. The stationary probability vector of these five states at age n (i.e. the distribution of a hypothetical cohort of women at age n) is denoted by:
 $$\begin{equation*}
{\pi _n} = \left( {{\pi _{u,n}}\left( 0 \right),{\pi _{m,n}}\left( 0 \right),{\pi _{m,n}}\left( 1 \right),{\pi _{m,n}}\left( 2 \right),{\pi _{m,n}}\left( 3 \right)} \right)
\end{equation*}$$
$$\begin{equation*}
{\pi _n} = \left( {{\pi _{u,n}}\left( 0 \right),{\pi _{m,n}}\left( 0 \right),{\pi _{m,n}}\left( 1 \right),{\pi _{m,n}}\left( 2 \right),{\pi _{m,n}}\left( 3 \right)} \right)
\end{equation*}$$
Initially, all women of a hypothetical cohort are in state U(0), and so the stationary probability vector at the beginning is π15 = (1, 0, 0, 0, 0). This means that all women are unmarried and with no children at age 15.
As Figure 2 shows, during a certain year, a never-married woman either remains single, or enters into marriage; a married woman with no child either remains childless, or has the first child; similarly, those at parity 1 or 2 can either remain unchanged, or have another child. Hence, there are four probabilities governing any transition at age n: mn denotes the probability of a never-married woman getting married; p m, n (1), p m, n (2), and p m, n (3) denote the probabilities of married women with 0, 1 or 2 children making transitions to first, second or third births, respectively.
And the matrix equation below is used to specify the dynamics in Figure 2, as a hypothetical cohort of women move from age n to n+1:
 $$\begin{equation*}
\left( {\arraycolsep4pt\begin{array}{@{}*{1}{c}@{}} {{\pi _{u,n + 1}}\left( 0 \right)}\\ {{\pi _{m,n + 1}}\left( 0 \right)}\\ {{\pi _{m,n + 1}}\left( 1 \right)}\\ {{\pi _{m,n + 1}}\left( 2 \right)}\\ {{\pi _{m,n + 1}}\left( 3 \right)} \end{array}} \right)=
{T_n}\left( {\arraycolsep4pt\begin{array}{@{}*{1}{c}@{}} {{\pi _{u,n}}\left( 0 \right)}\\ {{\pi _{m,n}}\left( 0 \right)}\\ {{\pi _{m,n}}\left( 1 \right)}\\ {{\pi _{m,n}}\left( 2 \right)}\\ {{\pi _{m,n}}\left( 3 \right)} \end{array}} \right)
\end{equation*}$$
$$\begin{equation*}
\left( {\arraycolsep4pt\begin{array}{@{}*{1}{c}@{}} {{\pi _{u,n + 1}}\left( 0 \right)}\\ {{\pi _{m,n + 1}}\left( 0 \right)}\\ {{\pi _{m,n + 1}}\left( 1 \right)}\\ {{\pi _{m,n + 1}}\left( 2 \right)}\\ {{\pi _{m,n + 1}}\left( 3 \right)} \end{array}} \right)=
{T_n}\left( {\arraycolsep4pt\begin{array}{@{}*{1}{c}@{}} {{\pi _{u,n}}\left( 0 \right)}\\ {{\pi _{m,n}}\left( 0 \right)}\\ {{\pi _{m,n}}\left( 1 \right)}\\ {{\pi _{m,n}}\left( 2 \right)}\\ {{\pi _{m,n}}\left( 3 \right)} \end{array}} \right)
\end{equation*}$$
Here, Tn , the transition matrix at age n, is given by:
 $$\begin{equation*}
{T_n} = \left( {\arraycolsep4pt\begin{array}{@{}*{5}{c}@{}} {1 - {m_n}}&0&0&0&0\\ {{m_n}}&{1 - {p_{m,n}}\left( 1 \right)}&0&0&0\\ 0&{{p_{m,n}}\left( 1 \right)}&{1 - {p_{m,n}}\left( 2 \right)}&0&0\\ 0&0&{{p_{m,n}}\left( 2 \right)}&{1 - {p_{m,n}}\left( 3 \right)}&0\\ 0&0&0&{{p_{m,n}}\left( 3 \right)}&1 \end{array}} \right)
\end{equation*}$$
$$\begin{equation*}
{T_n} = \left( {\arraycolsep4pt\begin{array}{@{}*{5}{c}@{}} {1 - {m_n}}&0&0&0&0\\ {{m_n}}&{1 - {p_{m,n}}\left( 1 \right)}&0&0&0\\ 0&{{p_{m,n}}\left( 1 \right)}&{1 - {p_{m,n}}\left( 2 \right)}&0&0\\ 0&0&{{p_{m,n}}\left( 2 \right)}&{1 - {p_{m,n}}\left( 3 \right)}&0\\ 0&0&0&{{p_{m,n}}\left( 3 \right)}&1 \end{array}} \right)
\end{equation*}$$
The TFR measures the expected number of children a hypothetical cohort of women would have, if they were subject to the fertility rates of a given year through their lifetime. Here, by assuming that the fertility rate of women aged 50 and over is negligible, TFR can be computed from the following equation:
 $$\begin{eqnarray*}
{\rm{TFR}} &=& 0 \times {\pi _{u,50}}\left( 0 \right) + 0 \times {\pi _{m,50}}\left( 0 \right) + 1 \times {\pi _{m,50}}\left( 1 \right) + 2 \times {\pi _{m,50}}\left( 2 \right) \\
&&+\, 3 \times {\pi _{m,50}}\left( 3 \right)\\
&=& \left( {0\;0\;1\;2\;3} \right){T_{49}}{T_{48}} \cdot \cdot \cdot {T_{15}}\left( {\arraycolsep4pt\begin{array}{@{}*{1}{c}@{}} 1\\ 0\\ 0\\ 0\\ 0 \end{array}} \right)
\end{eqnarray*}$$
$$\begin{eqnarray*}
{\rm{TFR}} &=& 0 \times {\pi _{u,50}}\left( 0 \right) + 0 \times {\pi _{m,50}}\left( 0 \right) + 1 \times {\pi _{m,50}}\left( 1 \right) + 2 \times {\pi _{m,50}}\left( 2 \right) \\
&&+\, 3 \times {\pi _{m,50}}\left( 3 \right)\\
&=& \left( {0\;0\;1\;2\;3} \right){T_{49}}{T_{48}} \cdot \cdot \cdot {T_{15}}\left( {\arraycolsep4pt\begin{array}{@{}*{1}{c}@{}} 1\\ 0\\ 0\\ 0\\ 0 \end{array}} \right)
\end{eqnarray*}$$
To estimate the TFR, the realistic values for the parameters mn , P m, n (1), P m, n (2), and P m, n (3) (where n = 15 to 49) are required. For ease of computation, we make several assumptions and adjustments. Due to the lack of data for single years of age, we categorise women's age into seven 5-year age groups (covering the ages of 15 to 49), and assume that women in the same age group have the same probabilities of marriage or parity transitions. Hence, there are in total 4 × 7 = 28 parameters (i.e. mn , P m, n (1), P m, n (2), and P m, n (3) for seven 5-year age groups). Let θ1. . . θ28 denote these 28 parameters, and mathematically TFR can be regarded as a complex function of them, that is, TFR = f (θ1. . .θ28). The ASMRs and APSFRs are used as realistic values for the 28 parameters in the calculation of TFR. Since we only model transitions up to parity 3, to reduce the potential underestimation, we use births of parity 3 and higher parities as the numerator and we use the number of married women with 2 children as the denominator to compute the ASPFR for parity 3.
After establishing a mathematical function for TFR based on the stochastic model above, we introduce the concept of fertility elasticity. Elasticity is originally an economic concept. In economics, price elasticity, for instance, measures the impact on the demand of a product when its price changes, often interpreted as the percentage change of demand per 1 per cent change in the price (Gans et al., Reference Gans, King and Mankiw2011). Analogously, we define the fertility elasticity as the percentage change of TFR per 1 per cent change in each of the 28 parameters (i.e. the ASMR and APSFR for seven age groups). The following expression is used to calculate the fertility elasticity to θi :
 $$\begin{equation*}
{\eta _{\theta i}} = \frac{{\Delta \left( {{\rm{TFR}}} \right)/TFR}}{{\Delta {\theta _i}/{\theta _i}}} = \frac{{\Delta \left( {{\rm{TFR}}} \right)}}{{\Delta {\theta _i}}} * \frac{{{\theta _i}}}{{TFR}} = \frac{{\partial \left( {{\rm{TFR}}} \right)}}{{\partial {\theta _i}}} * \frac{{{\theta _i}}}{{TFR}}
\end{equation*}$$
$$\begin{equation*}
{\eta _{\theta i}} = \frac{{\Delta \left( {{\rm{TFR}}} \right)/TFR}}{{\Delta {\theta _i}/{\theta _i}}} = \frac{{\Delta \left( {{\rm{TFR}}} \right)}}{{\Delta {\theta _i}}} * \frac{{{\theta _i}}}{{TFR}} = \frac{{\partial \left( {{\rm{TFR}}} \right)}}{{\partial {\theta _i}}} * \frac{{{\theta _i}}}{{TFR}}
\end{equation*}$$
The result can be interpreted as that, given 1 per cent change in θi , the TFR will change by ηθ i per cent. The advantage of using fertility elasticity is that it enables us to quantify the impact on TFR given a hypothetical change in the marriage or fertility rate of a certain subgroup. The higher the elasticity, the more sensitive the TFR to changes in the parameter, and the more influential the subgroup. Thus, by comparing the elasticities across subgroups, we are able to identify the group(s) of women who are most influential in the determination of Singapore's TFR, so that policies targeting them may have the largest impact on the overall fertility. This analysis was mainly performed using the Matlab software programme. We first calculated the partial derivative of TFR with respect to each parameter (i.e.∂(TFR)/∂θ i ). And then based on these partial derivatives, we estimated fertility elasticities with respect to the 28 parameters.
Results
The changing composition of women at childbearing age from 2000–2010
We estimated the proportion for each subgroup of women aged 15–49 by age group, marital status and parity, and visualised changes of these proportions from 2000–2010 in Figure 3. The exact values can be found in Table A1 of the Appendix. In 2010, the never-married-and-childless women aged 15–19, 20–24, and 25–29 were the three largest subgroups (accounting for 12.8 per cent, 10.6 per cent, and 7.2 per cent of all women at childbearing age, respectively); and next to them were the groups of married-with-two-children women aged 35–39, 40–44 and 45–49.
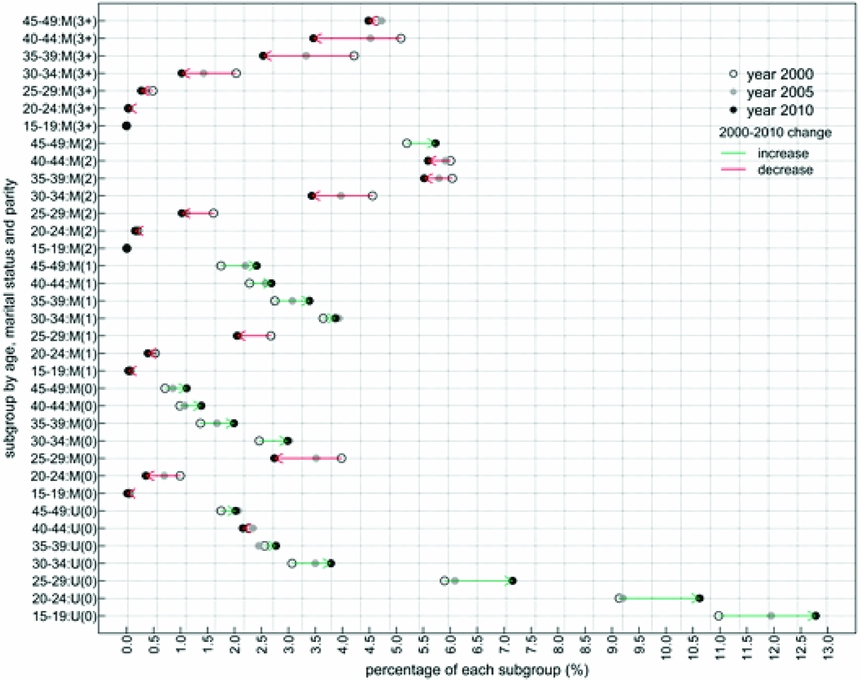
Figure 3. Changes in the composition of women at childbearing age over 2000–2010
The decade 2000–2010 witnessed some changes in the composition of women of childbearing age. The proportion of never-married-and-childless women increased across almost all age groups – especially those under age 35 (see Figure 3). To some extent, it reflects the delay of family formation and the increase of non-marriage in Singapore. At the same time, there were pronounced shifts in the age-parity distribution of married women. The great reduction in proportions of married women with two or more children in the 25–44 age groups (i.e. 25–44 year-old women in the states of M(2) and M(3+) in Figure 3), indicates a decline in large families. Regarding married women at low parities (i.e. parity 0 or 1), the proportion of those aged below 30 decreased while that of those aged 30 and over increased (see Figure 3). Such changes reflect the postponement of parenthood, the weak recovery of second or higher-order births, and the increase of childless (or childfree) marriage. On one hand, these compositional changes are related to the expansion of the educational system, the increase of women's participation in the labour market, and the changing attitudes and values regarding marriage and childbearing. On the other hand, they help predict the rising roles of single women as well as married women at low parities, in the determination of Singapore's fertility.
The incidence rates of marriage and parity transitions for subgroups
We then estimated the incidence rates of marriage and parity transitions for all subgroups (i.e. the ASMR for never-married women and the APSFR for married women). Table 1 shows the trends of ASMRs and APSFRs during 2000–2010. As shown in the table, the ASMRs declined greatly in younger age groups (those under age 30) and increased in the 30–39 age groups. In 2010, the ASMR of the 25–29 age group declined to 140 (number of marriages per 1,000 single women) while that of the 30–34 age group increased to 109 (see Table 1). Such changes reflect the shifting pattern of marriages in Singapore.
Table 1. The ASMRs and APSFRs over 2000–2010
Source: Authors’ calculations
Note: the estimates here refer to the number of events per 1,000 persons at risk.
Regarding the transition from parity 0 to 1, the 15–19 age group has the highest fertility rate of parity 1. This is probably because there is often a significant association between marriage and first births among adolescents and young adult women due to the unintended premarital pregnancy. The fertility rate of parity 1 in the 20–24 age group was increasing over the decade, especially in the period 2005–2010. The APSFRs of parity 1 for the 25–29, 30–34, and 35–39 age groups first declined during 2000–2005 and then rebounded during 2005–2010. This is probably due to the recovery of delayed first births, which might have been facilitated by the extension of the monetary incentives for the first child in the M&P Package since 2004 (NPTD, 2014).
Table 1 also reveals a declining propensity to make transitions to parity 2 and parity 3+ in the period of 2000–2010: in 2010, the APSFRs of parity 2 in the 20–24, 25–29 30–34 age groups reduced by about 22 per cent, 35 per cent and 33 per cent, respectively, compared to the rates in 2000; the APSFRs of parity 3+ in the 25–29, 30–34 and 35–39 age groups decreased by 21 per cent, 34 per cent and 30 per cent, respectively. Besides, it needs to be mentioned that the APSFRs of the 15–19 age group are relatively more volatile, as the denominator (i.e. the number of married women at risk of having a second or third in this age group) is rather small and often fluctuates.
Figure 4 visualises the APSFRs in 2000 and 2010. One commonality between the two years is that the APSFRs for parity 1 are higher than rates for parity 2, while APSFRs for parity 3+ are the lowest. Also, there is one notable change in this decade: in 2000, the APSFRs of parity 1 and 2 were at a similar level among those aged 25 and over; whereas, in 2010, the gap between the two widened considerably, due to a great reduction in the APSFR of parity 2.

Figure 4. The patterns of APSFRs in 2000 and 2010
Fertility elasticity
The changing composition of women at childbearing age, and the shifting patterns of ASMRs and APSFRs may have indicated some potential groups who could be relatively more influential in determining Singapore's TFR. Here, we further quantified the importance of each subgroup by estimating the fertility elasticity.
As introduced before, the fertility elasticity can be interpreted as the percentage change of TFR given 1 per cent change in the ASMR or APSFR of a certain subgroup. It measures the sensitivity of TFR to changes in marriage or fertility rates of a subgroup. We used a panel of spider graphs (in Figure 5) to demonstrate the patterns of fertility elasticities in 2000, 2005 and 2010. The exact values of elasticities can be found in Appendix, Table A2.
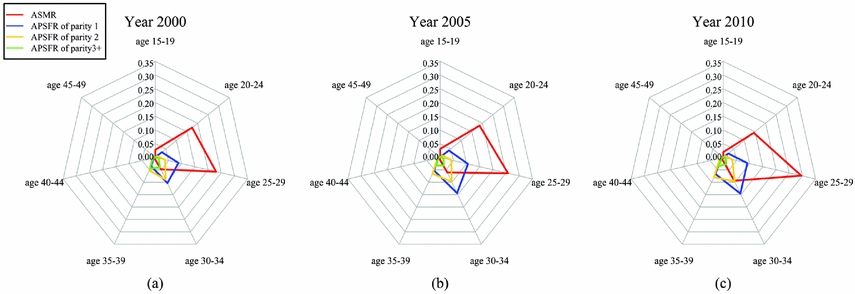
Figure 5. Fertility elasticities in 2000, 2005 and 2010: percentage change of TFR given 1% change in the ASMR or APSFR
Figure 5 (c) reveals that, in 2010, the TFR is most sensitive to the ASMR of the 25–29 age group, with elasticity of 0.296. This means that, given 1 per cent increase (or decrease) in the marriage rate of this age group, TFR will increase (or decrease) by 0.296 per cent. Besides, TFR is also very sensitive to the APSFR of parity 1 in the 30–34 age group (with elasticity of 0.146), and to the ASMR of the 20–24 age group (with elasticity of 0.144). These results imply that the 20–29 year-old single women, and the married-and-childless women in the 30–34 age group are the subgroups that are very influential in determining Singapore's fertility. If policies can facilitate the family formation and first births of these groups, the TFR may be raised effectively. Besides, it is worth noting that the elasticities to APSFRs of parity 3+ are very small.
Furthermore, the comparison of fertility elasticities in 2000, 2005 and 2010 has shown some commonalities and some variations. From 2000–2010, Singapore's TFR seems to have been most sensitive to changes in ASMRs and APSFRs of parity 1, while rather insensitive to APSFRs of parity 3+. At the same time, the elasticity to ASMRs has largely shrunk in the 20–24 age group while it rapidly increased in the 25–29 and 30–34 age groups. Such a trend is consistent with the prevalent practice of delaying marriage in Singapore. The elasticity to APSFRs of parity 1 and 2 has become much larger in the 30–39 age groups. Moreover, Figure 5 also reveals a contraction in elasticities to APSFRs of parity 3+, indicating the declining role of third and higher order births in affecting Singapore's fertility.
Actual target groups implied by current policies
As the analysis above assessed roles of subgroups (by women's age, marital status, and parity) in influencing the TFR, we further reviewed Singapore's pro-natalist measures in the recent decade, to examine whether the groups we identified have been targeted by policies. Most of these measures were under the M&P Package.
Marriage is targeted by this package in two main approaches – developing dating programmes to help singles find a partner, and introducing attractive housing schemes for courting and married couples. The original Social Development Unit (SDU), which was set up to help highly educated singles enter into marriage, and the original Social Development Service which targeted non-graduates, have been merged (in 2009) and renamed the Social Development Network (SDN). Currently, the SDN accredits, supports and coordinates with private match-making agencies to equip singles with relationship/dating skills and create opportunities for them to find a life partner (SDN, 2014). There are also various housing schemes under the M&P Package for couples in setting up a home: newly married couples who are first-time home buyers can enjoy the scheme ‘Priority Allocation for First Timers’; courting couples can enjoy special housing access before their marriage registration through the ‘Fiancé/Fiancée Scheme’, while ‘Staggered Down payment’ and ‘CPF Housing Grants’ have been provided to help couples with the cost of buying their first homes.
The financial incentives that aim to reduce the cost of having children provide differentiated payments to women at different parity levels. They mainly consist of the baby bonus and tax measures. Under the baby bonus, parents can receive cash gift (i.e. maternity payment) and co-savings top-ups. The co-savings refer to savings paid into a child's Child Development Account by parents, which are matched dollar-for-dollar by the Singapore Government. Tax measures include tax reliefs and tax rebates. Table 2 shows the specifics of these financial benefits by birth order and their variations in 2001–2015. In 2001, monetary incentives were mainly for second and third births and, later on, were extended to first births as well as the fourth and higher orders. It can be seen clearly that these incentives are parity-specific, and discriminate in favour of third and higher-order births. In 2015, when adding up all kinds of monetary support, the benefits for the fifth and subsequent child were about twice the amount for the first and second child.
Table 2. The financial benefits by birth order
Source: National Population and Talent Division, Singapore
Note: aTax rebates in 2001 for second child depended on mother's age (ranging from $5000 to $20,000), and here the minimum level is shown; bTax Reliefs include Qualifying Child Relief, Handicapped Child Relief, and Grandparent Caregiver Relief, all of which have no birth-order target, and here we only show those varying across birth orders; cHigher relief for children below age 12.
Discussion and Conclusion
Our fertility elasticity analysis demonstrates that the role of marriage has become more important in boosting Singapore's TFR, especially marriages among women aged 25–29. We also reveal that the Singapore Government has targeted the most influential group we identified, with marriage promotion policies. As the delay of marriage may depress the TFR through the ‘tempo effect’ as well as the ‘tempo-quantum interaction’ (i.e. when changes in the timing affects the final number of births), facilitating marriage at a younger age may weaken these two fertility-depressing effects, and help expand the window of childbearing for women (Lutz and Skirbekk, Reference Lutz and Skirbekk2005).
Currently, one of the major barriers to family formation among the young people is the expensive housing. The housing policies may have helped in slowing down the marriage retreat in Singapore, compared to higher singlehood rates in other high-income Asian societies (like Hong Kong and Taiwan). Marriage and housing are so closely related in Singapore that a marriage proposal is often paraphrased as ‘Do you want a flat’ (Strijbosch, Reference Strijbosch2015). However, it may still not be as effective as expected. Couples who have applied for flats under the Housing and Development Board (HDB) via its housing schemes have to wait some years to actually get the keys to their homes. This has the effect of delaying marriage, particularly if couples are particular about where they want to live. The Proximity Housing Grants may also influence their choice, but at present there are fewer flats available in mature estates where parents of young couples are likely to live. However, conscious of this, the Singapore Government has started building more flats and giving other grants to families to live together. It is also not very easy for young couples to accumulate enough savings to afford the down payment, despite some financial assistance programmes.
The dating service under the SDN may have played a limited role. According to a 2012 survey on attitudes and perceptions of singles towards marriage and having children, it has been shown that single women in Singapore prefer their life partners to be taller, older, richer, higher educated, more intelligent and more successful than themselves (NUS, 2013), reflecting a strong aspiration of marrying up. But the fact is that the number of female graduates has already outnumbered their male counterparts. And the SDN seems not to be a platform where women can find such ideal mates. The Social Development Unit (SDU), which preceded the SDN, was and continues to be stigmatised as ‘Single, Desperate and Ugly’ (Strijbosch, Reference Strijbosch2015).
Although the Singapore Government has actively encouraged marriage, these efforts seem not to have been as successful as expected. The preceding discussion on housing policies implies that one area where government could improve matters would be to enhance accessibility to affordable housing for young unmarried or married couples, in terms of both increasing the supply and reducing the price. To support marriage, a standalone ‘marriage-only’ policy may not work, as many barriers to marriage may not be removed by policies only directed at marriage (Heard, Reference Heard2011; Lichter, Reference Lichter2001). In Singapore and other East Asian countries, marriage is now often viewed as a package – tightly linked with childbearing, childrearing and other family obligations (Jones, Reference Jones2007; Raymo et al., Reference Raymo, Park, Xie and Yeung2015; Rindfuss et al., Reference Rindfuss, Choe, Bumpass and Tsuya2004). At the same time, women now are more encouraged to realise their potentials in education and careers. Thus, the interplay of these two forces has led to marriage delay. Therefore, an effective marriage promotion calls for improvements: in labour market policies which reduce economic uncertainties and facilitate more rapid achievement of career aspirations (Heard, Reference Heard2011; NUS, 2013), in social policies which reduce the opportunity cost of marriage and childbearing as well as increase support to those married couples and parents (McDonald, Reference McDonald2006b; NUS, 2013), and also in policies which enhance the gender equity both outside and inside the household (McDonald, Reference McDonald2009).
The comparison of fertility elasticities to different parity transitions from 2000–2010, also highlights the rising importance of first births – especially among women aged 30–34, and the declining role of higher order births in determining Singapore's TFR. However, at present, pro-natalist polices in Singapore are actually giving priorities to third-and higher-order births, seen from the steeply parity-progressive monetary incentives (see Table 2), which may to some extent explain the ineffectiveness in reversing the fertility trends. Moreover, the qualitative studies have given some insights into why people are insensitive to such financial support. With the high and rising cost of living in Singapore, the cash gift is still insufficient and has lost its attractiveness, as it is perceived as a lump-sum ‘reimbursement or compensation, rather than as an extra benefit’ or ‘a long-term support’ (Jones, Reference Jones2012b; Sun, Reference Sun2012). Meanwhile, the co-savings and tax rebates are perceived to benefit highly educated and high-income families, rather than being a strong incentive to their counterparts (Sun, Reference Sun2012).
The mismatch between the potential target groups and the actual target groups indicates that more support should be provided to facilitate low-order births, especially first births. Then the question would be how to facilitate and what specific policies should be implemented. Existing studies on the driving forces behind the delay of first births may shed some light on this question. Nowadays young couples postpone their first birth until they finish their education, secure a stable job, achieve a good income, and become well-established in their careers (Ahn and Mira, Reference Ahn and Mira2001; Andersson, Reference Andersson2002; De la Rica and Iza, Reference De la Rica and Iza2005; De Wit and Ravanera, Reference De Wit and Ravanera1998). To stop the continuous increase in age at marriage and first birth, tempo policies have been recently suggested by scholars (Bongaarts, Reference Bongaarts2008; Lutz and Skirbekk, Reference Lutz and Skirbekk2005). These policies include increasing the efficiency of the education system to shorten schooling years, labour market policies to reduce unemployment and employment uncertainties. Rather than simply enhancing financial support for first births, an integrated policy package is needed to raise the TFR effectively. And to achieve a long-term and significant fertility reversal, the policies should also be enduring (McDonald, Reference McDonald2006a). These implications may also be applicable to other East Asian low-fertility countries, as their ultra-low fertility is also accompanied by great delays in marriage and parenthood.
The continuous declining fertility trends seem to imply the failure of Singapore's policies. However, it may be too premature to draw such a conclusion. On one hand, Singapore's fertility declined at a slower pace and the lowest level was also much higher in comparison with other high-income Asian economies, indicating the potential impact of its pro-natalist action (Jones, Reference Jones2012a). On the other hand, demographers have cautioned that the policy impact in earlier years of its implementation appear to be weak, but will be effective in the longer term (Castles, Reference Castles2003; McDonald, Reference McDonald2006b). The so-called long-term policy impact on Singapore's fertility remains a research gap to be addressed in the future.
There are several limitations in our study. First, we have not incorporated the cross-border marriages into our elasticity analysis. In Singapore, cross-border marriages do help fulfil the family formation and childbearing aspirations of some people – especially men in low socioeconomic status. To some extent, such rise in the transnational marriages reflects the distortion of the local marriage market where hypergamous marriages are widely desired. Local women tend to feel the marriage squeeze more than men, as men are more involved in transnational marriages than women, and men tend to have more choices. Second, the elasticity analysis is based on several assumptions that are made to facilitate our computations, which consequently do not fully model the exact parity transitions in real life. Owing to data limitations, we have assumed that all births in Singapore are within marriage. If data for out-of-wedlock births is available, the elasticity analysis can be extended to assess the role of non-marital fertility. However, in our study, the impact of the omission is limited (as non-marital births account for less than 2 per cent of total births). Moreover, we have only taken into account subgroups by demographic characteristics, and future research can further investigate roles of subgroups by couples’ socioeconomic status in the determination of fertility.
Acknowledgements
We are grateful to the reviewers for their suggestions and the data made available by the Government of Singapore. This research is supported by the Strategic Public Policy Research Grant on population policy (SPPR-HKU-12) at the University of Hong Kong, Hong Kong SAR, China (for Yip).
Appendix
Table A1. The composition of women at childbearing age in 2000, 2005 and 2010
Table A2. Fertility elasticities to the ASMRs and APSFRs in 2000, 2005, and 2010