


INTRODUCTION
Kuhn (1980a) published a general algorithm, calculating by approximation the shift of the equilibrium line in response to small climatic changes. For such a calculation well founded data of the heat balance must be available. This algorithm has already been used for comparing recent positions of the equilibrium line in the Alps and for those of the younge r Dryas (Kuhn 1980b). Another paper deals with the climatically conditioned shifts of the equilibrium line in the Andes (Kuhn 1981).
The reactions of large ice sheets in relation to climatic changes are the main subject of current studies (Ambach 1980; Mercer 1978; Radok and others 1982). An altitudinal shift of the equilibrium line leads to simultaneous changes of the areas of ablation and accumulation. For example, if the equilibrium line is raised, the area of ablation becomes larger while the area of accumulation becomes smaller by the same amount.
An extension of Kuhn’s algorithm to the Greenland Ice Cap is elaborated in the present paper, since comprehensive heat balance studies and other glaciological investigations were made in the area of ablation and accumulation during the International Glaciological Greenland Expedition. These studies concentrate on the profile Equip Sermia - Station Centrale - Jarl Joset - Cecilia Nunatak (EGIG profile).
KUHN’S ALGORITHM
An altitudinal shift of the equilibrium line results from disturbances of the steady state, ie with disturbances in specific cumulative accumulation (δc), in net radiation balance (δR) and in temperature (δTa). For a steady state of the equilibrium line, Kuhn (1980b) gives the following condition;

where δc, δR, δTa stand for the above-mentioned disturbances,  being gradients which in the present state have been taken from measurements. Ah is the altitudinal shift of the equilibrium line, a is the heat transfer coefficient, τ is the number of days of ablation at the equilibrium line, and L the specific heat of the ice melt. Equation 1 is based on the idea that the specific net balance equals zero at the end of the balance year in the new position of the equilibrium line, regardless of the disturbances δc, δR, δTa.
In the algorithm the following approaches are made: - For the sensible heat flux (Hs) the formulation (Kuhn 1979)
- The mass loss by evaporation is negligible (Ambach 1963)
- Changes of the latent heat flux HL and of the
altitudinal gradient ![]() are zero
- The dependence of c, R and Ta on the attitude is taken into account in the region of the equilibrium line using the altitudinal gradients
are zero
- The dependence of c, R and Ta on the attitude is taken into account in the region of the equilibrium line using the altitudinal gradients  and
and  - The duration of the ablation season is assumed to be constant, regardless of the disturbances δc, δR, δTa
APPLICATION TO THE EGIG-PROFILE
The data necessary for applying Eq. (1) are taken from data measured in the EGIG profile. The characteristics of the heat balance used for modelling are published in detail elsewhere (Ambach to be published).
Explanation of


18O analyses on cores in the EGIG profile showed averaged water equivalents of the annual net accumulation to have been constant back to 600 A.D. (Reeh and others 1978). Hence, δc = 0 is assumed. The altitudinal gradient  is taken frommeasurements of winter accumulation in regions between 600 and 1240 m a.s.1. (Ambach 1963, p 298, Table 53).
The fact that the melt water in the region of the equilibrium line is completely transformed into superimposed ice (DeQuervain 1969) has been taken into account. In the case of superimposed ice formation, the heat necessary for melting one annual layer is higher by a factor of 5/3 than it is in the case of melting an annual layer without any formation of superimposed ice (Ambach, to be published). Hence it holds

where Q1, Q” (MJm-2) are the amounts of heat necessary for melting for both cases, with and without superimposed ice, respectively. In analogy, m1 and m” (kgm 2) are the melted masses. In connection with Kuhn’s algorithm this means that in the case of complete formation of superimposed ice, the gradient of cumulative accumulation must be higher by a factor of 5/3 to allow for the mass actually melted. Because of the formation of superimposed ice, the rounded off value of


According to Kuhn (1980b), only the change of the long wave downward radiation with the air temperature (6R = 6A) needs to be taken into account in the change of the net radiation balance. The short wave radiation flux, the albedo and the long wave upward radiation flux of the surface remain constant. According to the Stefan-Boltzmann law for δR = 6A it results
with ε + being the relative emissivity at an average cloudiness of 5/10, which is calculated from the measured dependence of the long wave radiation balance on the cloudiness. Using values measured in the area of ablation (Ambach 1963, p 70, Figure 20) an average of e = 0.92 is obtained. With σ = 5.67 × 10⁻⁸Wm−2K−4 and T - 273.15 Ft it holds

Explanation of

The altitudinal gradient of the air temperature was obtained by comparing measurements at the climate station of Jakobshavn (40 m a.s.1.) on the west coast and at Camp IV EGIG 1959 (1013 m a.s.l.) in the ablation area. For the duration of the ablation season, -0.73° C/100 m is obtained on average (Ambach 1977, p 35). For very large glaciers, Braithwaite (unpublished) obtained values for the temperature gradient < -0.6 C/100m, due to advection. The 10 m snow-temperatures in the accumulation area are about -1 C/100m (DeQuervain 1969), This is due to the cooling of the snow cover with increasing altitude on account of the heat balance, so that the air temperature cannot be substituted by the 10 m snow temperature The gradient of -0.73°C/100 m may thus be considered as a representative value.
For calculating the heat transfer coefficient a the measurements made in the ablation area are ‘used (Ambach 1977, p 41, Table 9b). For 38 days of melting ice surface, the value for Alpine valley glaciers given by Kuhn (1979), is obtained here too:
It must be taken into account that at the equilibrium line there exists first of all an old snow surface and because of the formation of superimposed ice, the snow surface is changed into an ice surface. Owing to the lower roughness of the snow surface the shear velocity obtained here will be smaller than that of an ice surface by a factor of 0.627 which is confirmed by measurements in the area of accumulation (Ambach 1979, p 47, Figure 2). At the equilibrium line during the ablation season there wil be an old snow surface for 2/3 of the period (α = 1.08 MJm−2d−1 °C−1). Hence a weighted mean value of α = 1.29 MJm−2d−1 °C−1 is assumed.
RESULTS
Altitudinal shift of the equilibrium line by changes in air temperature
The relations

are used for transforming Equation (1) into

Altitudinal shift of the equilibrium line by changes in coludiness
A change in cloudiness in general also causes a change in the net radiation balance. For calculating the influence of the cloudiness, the expression δR in Eq. (2b) is expanded as follows:

Eq. (3) then reads

where δw stands for a change in cloudiness in tenths, and β is a numerical value resulting from the dependence of net radiation balance on cloudiness.
This dependence has been studied in detail for the EGIG profile in the areas of ablation and accumulation In the area of ablation, the net radiation balance decreases as the cloudiness increases, in the case of a melting ice surface (Ambach 1977, p 21, Figure 4, right side). In the area of accumulation with dry snow surface, however, the net radiation balance was found to increase with increasing cloudiness. The differences in the net radiation balance with clear sky and covered sky, amounted to +2.8 MJm-2d-1 in the area of ablation, and -3.0 MJm -2d-1 in the area of accumulation, A’ melting old snow surface lies between the two cases, so that here net radiation balance may be taken’ as approximation, independent of cloudiness.
At the equilibrium line there is a melting old snow surface during 2/3 of the ablation season, with ß = 0, whereas for 1/3 of the ablation season there exists a melting ice surface with ß = -0.28 MJm-2d-1 per one tenth of cloudiness assumed in the following calculations.

In Eq. (4) the altitudinal shift of Ah is expressed by two terms: the shift for a temperature disturbance at constant cloudiness ∆h(δTa), and the shift for a cloudiness disturbance at constant temperature ∆h(δw), reading


Using the numerical values of α = 1.29 MJm−d−1°C−1, α' = 0.37 MJm−2d−1°C−1,  0.3336 Mlkg-1 and β = -0.093 MJm-2d-1 per one tenth of cloudiness, the following expressions for Equations (4a,b) are obtained:


Figure 1 shows Eq. (4a', 4b'), ![]() (kg/m2 m being a parameter. With the values of
(kg/m2 m being a parameter. With the values of 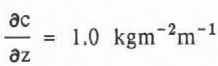 and τ = 35 d, representative for the EGIG profile, the attitudinal shifts of the equilibrium line
 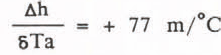 and
and 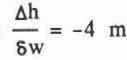 per tenth of cloudiness are obtained. 6w
These figures hold under the condition of constant value of T, unaffected by climatic disturbances. Hence the influence of cloudiness on the shift of the equilibrium line may be neglected under realistic assumptions. The implications of the gradient of the cumulative accumulation for mass balance modelling will appear in detail elsewhere (Ambach and Kuhn, to be published).
CONCLUSIONS
In this paper, the equilibrium line in the EGIG profile is assumed at the attitude of 1240 m a.s.l. with a horizontal distance of 37 km from the ice margin. The slope at the equilibrium line is about 1 m to 100 m (Seckel 1977, Anlage 2). For an altitudinal shift of the equilibrium line by 100 m, a 27% change of the ablation area will be obtained. Similarly, the specific net ablation averaged over the ablation area will change by 27%, if the altitudinal gradient of specific net ablation remains unaffected by changes in climate. Kuhn (to be published) however, demonstrates that the altitudinal gradient of specific net ablation most probably is affected by the climate.
Assuming that the melt water is totally converted to the loss in mass and neglecting possible refreezing, the loss in mass by melting is obtained as follows:
where Sa is the ablation area in a sector of the EGIG profile, â being the mean specific net ablation in this sector. The loss in mass by melting is therefore increased by about 60% if the equilibrium line is raised by 100 m of altitude. Analogous calculations can be made for other regions of the Greenland Ice Cap.

Fig. 1. Altitudinal Shifts of the equilibrium line ![]() (scale a) and
(scale a) and ![]() (scale b) versus the duration of the ablation season
(scale b) versus the duration of the ablation season 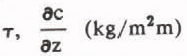 being the parameter. With the values of τ = 35d and of
  the shifts read
  and
and 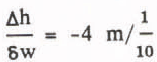 cloudiness at the equilibrium line of the EGIG profile.

