


Introduction
In the Americas, the raccoon strain of rabies virus (RRV) has emerged, since its first identification in Florida in the 1940s, as a significant wildlife disease having serious implications for both public and animal health [Reference Jenkins, Perry and Winkler1]. As a result of the ongoing host to host spread and anthropogenic effects, which introduced raccoon rabies into Virginia and West Virginia in the 1970s and initiated the mid-Atlantic raccoon rabies outbreak, this disease has now spread throughout the eastern seaboard of the USA. Despite a number of control measures to combat the spread of this epizootic [Reference Slate2] including extensive efforts to maintain immunity of host populations at border areas of the eastern USA and neighbouring Canadian provinces [Reference Rosatte3], the disease has crossed into Canada on several occasions [Reference Nadin-Davis, Muldoon and Wandeler4–Reference Rees7]. Such invasions have necessitated extensive and costly responses to eliminate infected animals and prevent the establishment of raccoon rabies in indigenous Canadian populations. To aid in efforts to better understand the spread of the disease in the USA and thus reduce the risk for future northern expansion into Canada, improved understanding of factors that influence viral dissemination is being sought.
In this regard, molecular epidemiological studies have been helpful. A study of 74 partially sequenced isolates of mid-Atlantic raccoon rabies recovered from several US states identified seven distinct lineages of the virus that had emerged since the initiation of this disease focus [Reference Biek8]. Two of these lineages, NE1 and NE2, have circulated in distinct areas of the northeastern USA, including eastern New York state, while a third, NW1, was the primary lineage responsible for populating western areas of New York. Another study also identified two distinct spatially segregated lineages circulating in New York [Reference Szanto9], NY-east and NY-west, the latter of which was responsible for a raccoon rabies outbreak in the province of Ontario between 1999 and 2005 [Reference Rosatte3]. Subsequent recent studies of raccoon rabies epidemiology have taken advantage of highly parallel sequencing technologies to develop a high throughput method for whole genome sequencing (WGS) of RRVs and this approach enables more detailed identification of viral variants and their spread across the landscape at the local level [Reference Nadin-Davis10].
Phylogenetic analysis of whole genome sequences of RRV isolates from an incursion of raccoon rabies into the province of Quebec, beginning in 2006 and continuing into 2009 when the last case was reported [Reference Rees7], was recently shown to be the result of cross-border spread from Vermont state [Reference Trewby11]. The identification of multiple incursions of the virus into Quebec and backflow into Vermont highlighted the porous nature of the border with respect to viral movement and the need for better understanding of the factors contributing to the spread and maintenance of this epizootic within Vermont. In this study whole genome sequences of an expanded cohort of 121 RRV samples collected across Vermont between 2005 and 2011 and specimens from New York and other neighbouring states, have been characterised phylogenetically. Together with detailed case records of the original incursion of this epizootic, the viral phylogenies reveal how topographical landscape features have impacted disease spread throughout Vermont in the 1990s; additional cross-state movements of raccoon rabies have occurred since then to generate the complex pattern of viral variants circulating in recent years.
The sequences generated during these studies have also allowed an examination of the potential role of the skunk in viral maintenance. The striped skunk is the primary maintenance host for a number of rabies viral variants across North America and is the most frequent secondary species infected by a number of other variants [Reference Blanton12]. Indeed during the campaign to eradicate the arctic fox variant from southern Ontario, it became clear that skunks were playing a role in the persistence of the virus within certain counties [Reference Nadin-Davis, Muldoon and Wandeler13]. Furthermore, cases in skunks constituted a high proportion of all cases of raccoon-variant rabies during the initial period of an outbreak in New Brunswick in 2000 [Reference Nadin-Davis, Muldoon and Wandeler4] and in Ohio reported case numbers of RRV in skunks was often higher than those in raccoons [Reference Blanton12]. All of these observations suggest the possibility that skunks play an active role in the persistence of multiple rabies virus variants. We, therefore, aimed to use our viral genomic data to examine the role skunks may have played in the spread and maintenance of RRV in Vermont.
Methods
Surveillance data
Records of all rabies positive cases documented in Vermont between 1994 and 2012 were compiled into a single database. Bat cases were removed as were cases of red fox rabies, identified in many instances by antigenic typing, that circulated in the northern half of Vermont in the early 1990s up until 1996; after that time fox rabies disappeared from the state following successful oral rabies vaccination campaigns to control fox rabies in Ontario, Canada [Reference MacInnes14]. All remaining cases were considered to be due to the raccoon rabies epizootic. Since not all positive cases were sub-typed, rare instances of bat transmission to non-flying terrestrial species could be included in this dataset but the overall impact of such cases on the resulting analysis would be minimal.
RRV samples
Samples of RRV-infected brain tissue were obtained from state rabies laboratories in Albany, New York and Burlington, Vermont as well as from the Poxvirus and Rabies Branch of the Centers for Disease Control and Prevention, Atlanta, Georgia. Metadata associated with these samples, including host species, the location of origin to the township level and date of recovery, was also compiled. Of the 160 viral samples sequenced in support of these studies, the breakdown of host species included 92 raccoons, 52 skunks and 16 other species, comprising three equines, seven bovines, five gray foxes and one woodchuck.
RNA extraction, reverse transcription-polymerase chain reaction (RT-PCR) and sequencing
Extraction of total brain RNA by a hybrid TRIzol/MagMax system and amplification of the RRV genome as overlapping RT-PCR products was performed as described previously [Reference Nadin-Davis10]. Amplicons were purified using a Gene Jet PCR purification kit and WGS was performed by either Sanger or Illumina technologies; the data were assembled to generate consensus sequences using programs of the DNASTAR Lasergene software package (v. 11) and exported as individual fasta files as described [Reference Nadin-Davis10].
Sequence analysis
Whole genome sequences were aligned using the MEGA5.1 software [Reference Tamura15]. This dataset was then edited to create individual alignments of the five RABV genes and all six datasets were subjected to pairwise distance calculations using the distance function in MEGA5.1. This analysis examined heterogeneity across the genome and identified samples representative of the different lineages as described below. Sequence data for 20 representative isolates were edited to generate concatenated N and G gene sequences for comparison with corresponding sequences of 10 isolates that had defined major RRV lineages previously [Reference Biek8]. Using this dataset with the best fitting Tamura 3-parameter model of nucleotide substitution with a gamma distribution of rates (T92 + G) a Maximum Likelihood phylogenetic tree was constructed with MEGA5.1.
A time-scaled phylogeny of the whole genome sequences was constructed using the program BEAST v1.8.2 [Reference Drummond16] in conjunction with BEAGLE [Reference Ayres17], with parameter settings as described in [Reference Trewby11], as follows: the GTR + G model of nucleotide substitution [Reference Tavaré and Miura18] was used, with sequences partitioned into coding and non-coding regions and a relaxed molecular clock model with branch rates drawn from an exponential distribution [Reference Drummond19] and a Bayesian skyline demographic prior [Reference Drummond20]. The clock rate prior was set to a normal distribution with mean 1.44 × 10⁻⁴ nucleotide substitutions per site (based on results from [Reference Brunker21]) with a wide standard deviation to allow for uncertainty and truncated at 0 and 0.15 nucleotide substitutions per site, with tip dates calibrated using the recorded year of sampling. Two independent BEAST analyses were run for 108 MCMC iterations with a burn-in of 5 × 10⁶ and convergence was evaluated visually in Tracer v1.6.0 and based on estimated sample size values greater than 200. Results were summarised as a maximum clade credibility tree using TreeAnnotator v1.8.2 and visualised using the package ggtree [Reference Yu22] in R v3.4.0 [23].
Variant mapping
The township from which each sample originated was used to determine latitude and longitude co-ordinates for mapping using the ArcView GIS software, version 10.1. In addition, by combining the dated surveillance data with the viral phylogeny, the inferred emergence and flow of viral variants during the raccoon rabies outbreak throughout Vermont has been superimposed on a county map of the state.
Inference of phylogenetic clustering and host association
If skunks act as an alternative maintenance host for RRV in Vermont [Reference Viana24], one would expect clustering of skunk-associated isolates as well as raccoon-associated isolates along the phylogeny. The program BaTS v2 [Reference Parker, Rambaut and Pybus25] was used to test for evidence of phylogenetic clustering by host species in the Vermont RRV isolates. BaTS computes three measures of the association between phylogeny and tip traits for the observed tree: the association index [Reference Wang26], the parsimony score [Reference Slatkin and Maddison27] and the maximum clade size for each trait. The observed values are then compared with null distributions of the values generated by randomising the tip traits on the phylogeny. This generates a P-value for each of the measures, calculated as the proportion of null randomisations with a value as or more extreme than the value calculated for the observed tree. Tip traits were assigned as ‘raccoon’, ‘skunk’ and ‘other’ based on recorded host species and the analysis was run across the full BEAST posterior tree distribution with significance evaluated using 1000 null randomizations. To evaluate host associations along the entire phylogeny, rather than just the tips, ancestral trait reconstruction was conducted in BEAST using settings as described above, with the additional inclusion of the host species (‘raccoon’, ‘skunk’ or ‘other’) as a discrete trait associated with each sequence [Reference Lemey28]. Significant transitions between host species were allowed to be asymmetric and identified using Bayesian stochastic search variable selection, with Bayes factors (BF) calculated in the program SpreaD3 v0.9.6 [Reference Bielejec29]. The number of transitions between host species along the phylogeny was estimated using Markov Jump counts [Reference Minin and Suchard30]. The analysis was run in duplicate, with an MCMC length of 5 × 10⁸ for Markov Jump count analyses and 5 × 10¹⁰ for the Bayesian stochastic search variable selection analyses. Duplicate runs were combined and checked visually for convergence using Tracer v1.6.0, resulting in effective sample sizes of greater than 200 for all parameters.
Results
Surveillance records for RRV in Vermont
All case records of rabies-positive samples recovered between 1994 and 2012 and deemed to be the result of the RRV variant are summarised according to year and host (Fig. 1). A listing of all cases based on county of origin is also provided (Supplementary Table S1). After the initial entry of RRV into the southwestern region of the state in 1994 high numbers of cases were reported in the following few years as the epizootic expanded very quickly throughout much of Vermont. This was followed by a cyclical pattern of case numbers with a total of 1375 laboratory-confirmed cases reported over this 19-year period. While the raccoon was the most frequently reported species (65.5% of all cases), skunks also made up a significant proportion (26.6%) of cases while other wildlife (5.0%), companion animals (1.0%) and livestock (1.8%) all constituted a relatively small percentage of the total. This host representation was reflected, approximately, in the samples processed for sequencing which comprised 57.5% raccoons, 32.5% skunks and 10.0% all other species.
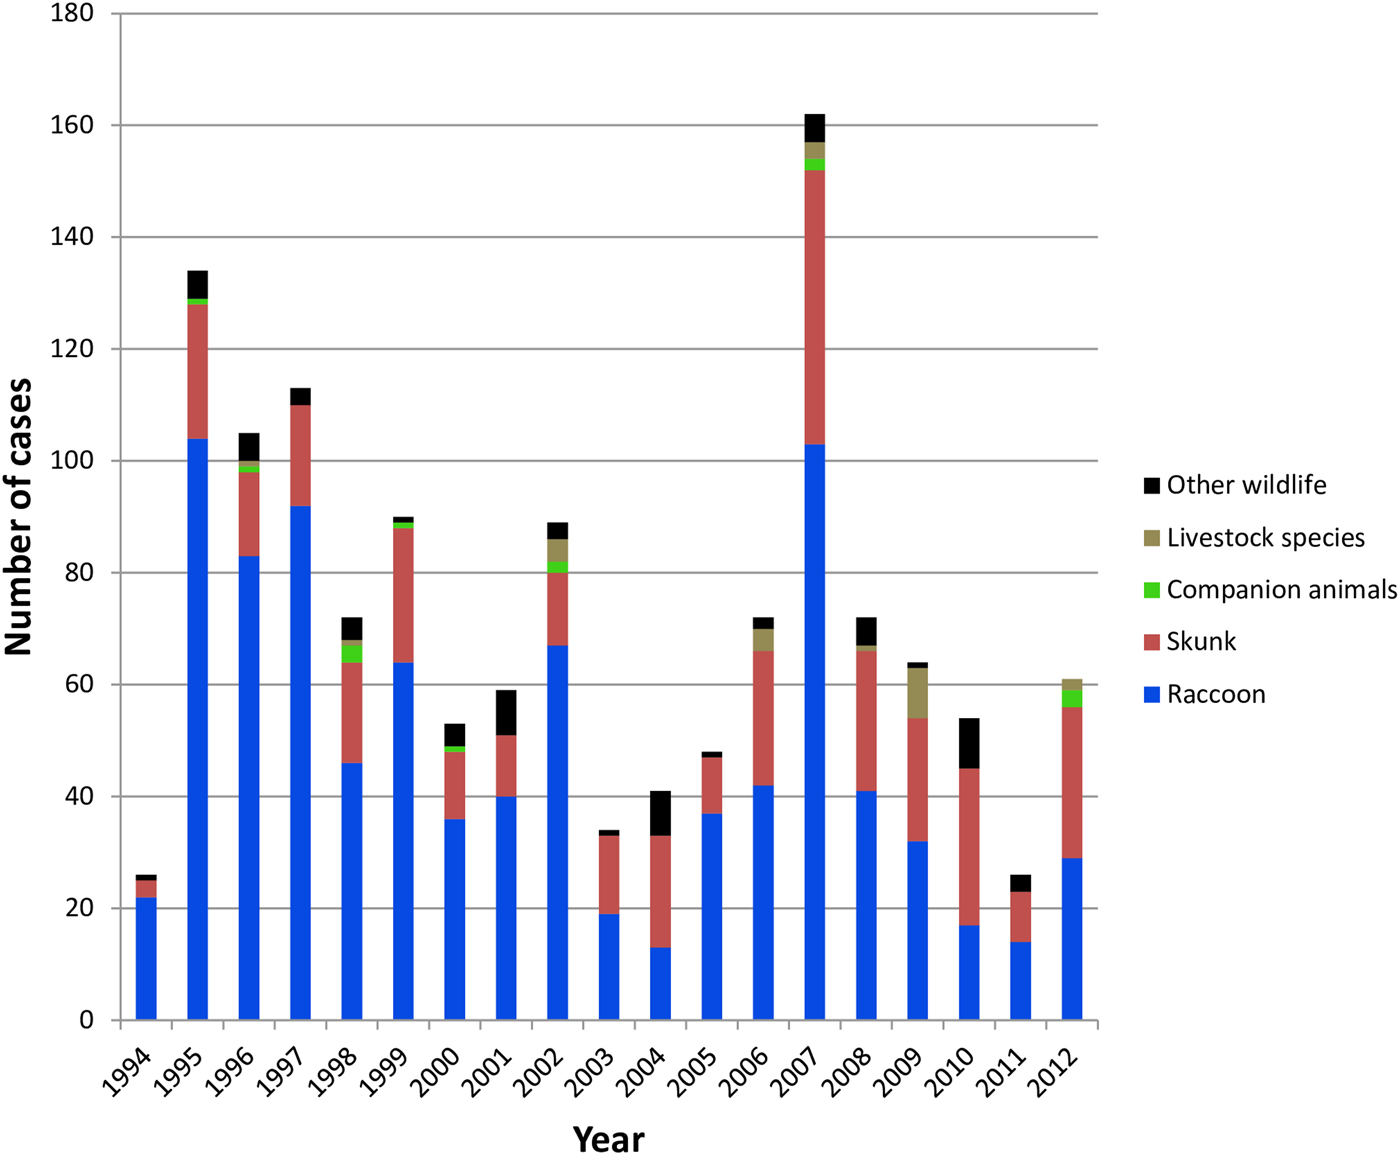
Fig. 1. Summary of laboratory-confirmed RRV cases in Vermont between 1994 and 2012 grouped according to host type.
Phylogenetic analysis of the RRV in Vermont and neighbouring states
According to the availability of archival samples, a total of 121 Vermont samples, collected between 2005 and 2011 (see Table S2), were characterised by WGS. Genome length varied from 11 923 to 11 925 while the alignment comprised 11 933 positions due to a small number of indels. Synonymous single base substitutions comprised the vast majority of differences within this dataset and all indels occurred in non-coding regions. Pairwise base differences for each of the five coding regions varied considerably (Table 1) and often failed to differentiate between samples while WGS was able to discriminate between all but six sample pairs, thus illustrating the improved phylogenetic resolution possible with WGS compared with single gene sequencing as noted previously [Reference Nadin-Davis10].
Table 1. Number of pairwise base differences for different genomic regions of the 121 sequences comprising the Vermont sample set
Alignment comprised a total of 11 933 positions.
a Out of total of 7270 sequence pairs.
To explore the evolutionary origins of these Vermont RRV samples, their sequences were used for a phylogenetic analysis together with 39 samples recovered from neighbouring US states, including 34 samples (recovered between 1990 and 2011) from areas of New York state in close proximity to the New York-Vermont state line. The resulting tree (Fig. 2) divides all samples into at least eight distinct groups, designated I to VIII, all strongly supported by high posterior probability values. Further sub-division of some of these groups was also strongly supported (Fig. 2). The spatial distribution of all viral variants identified in these two states is illustrated for three time periods (Fig. 3).
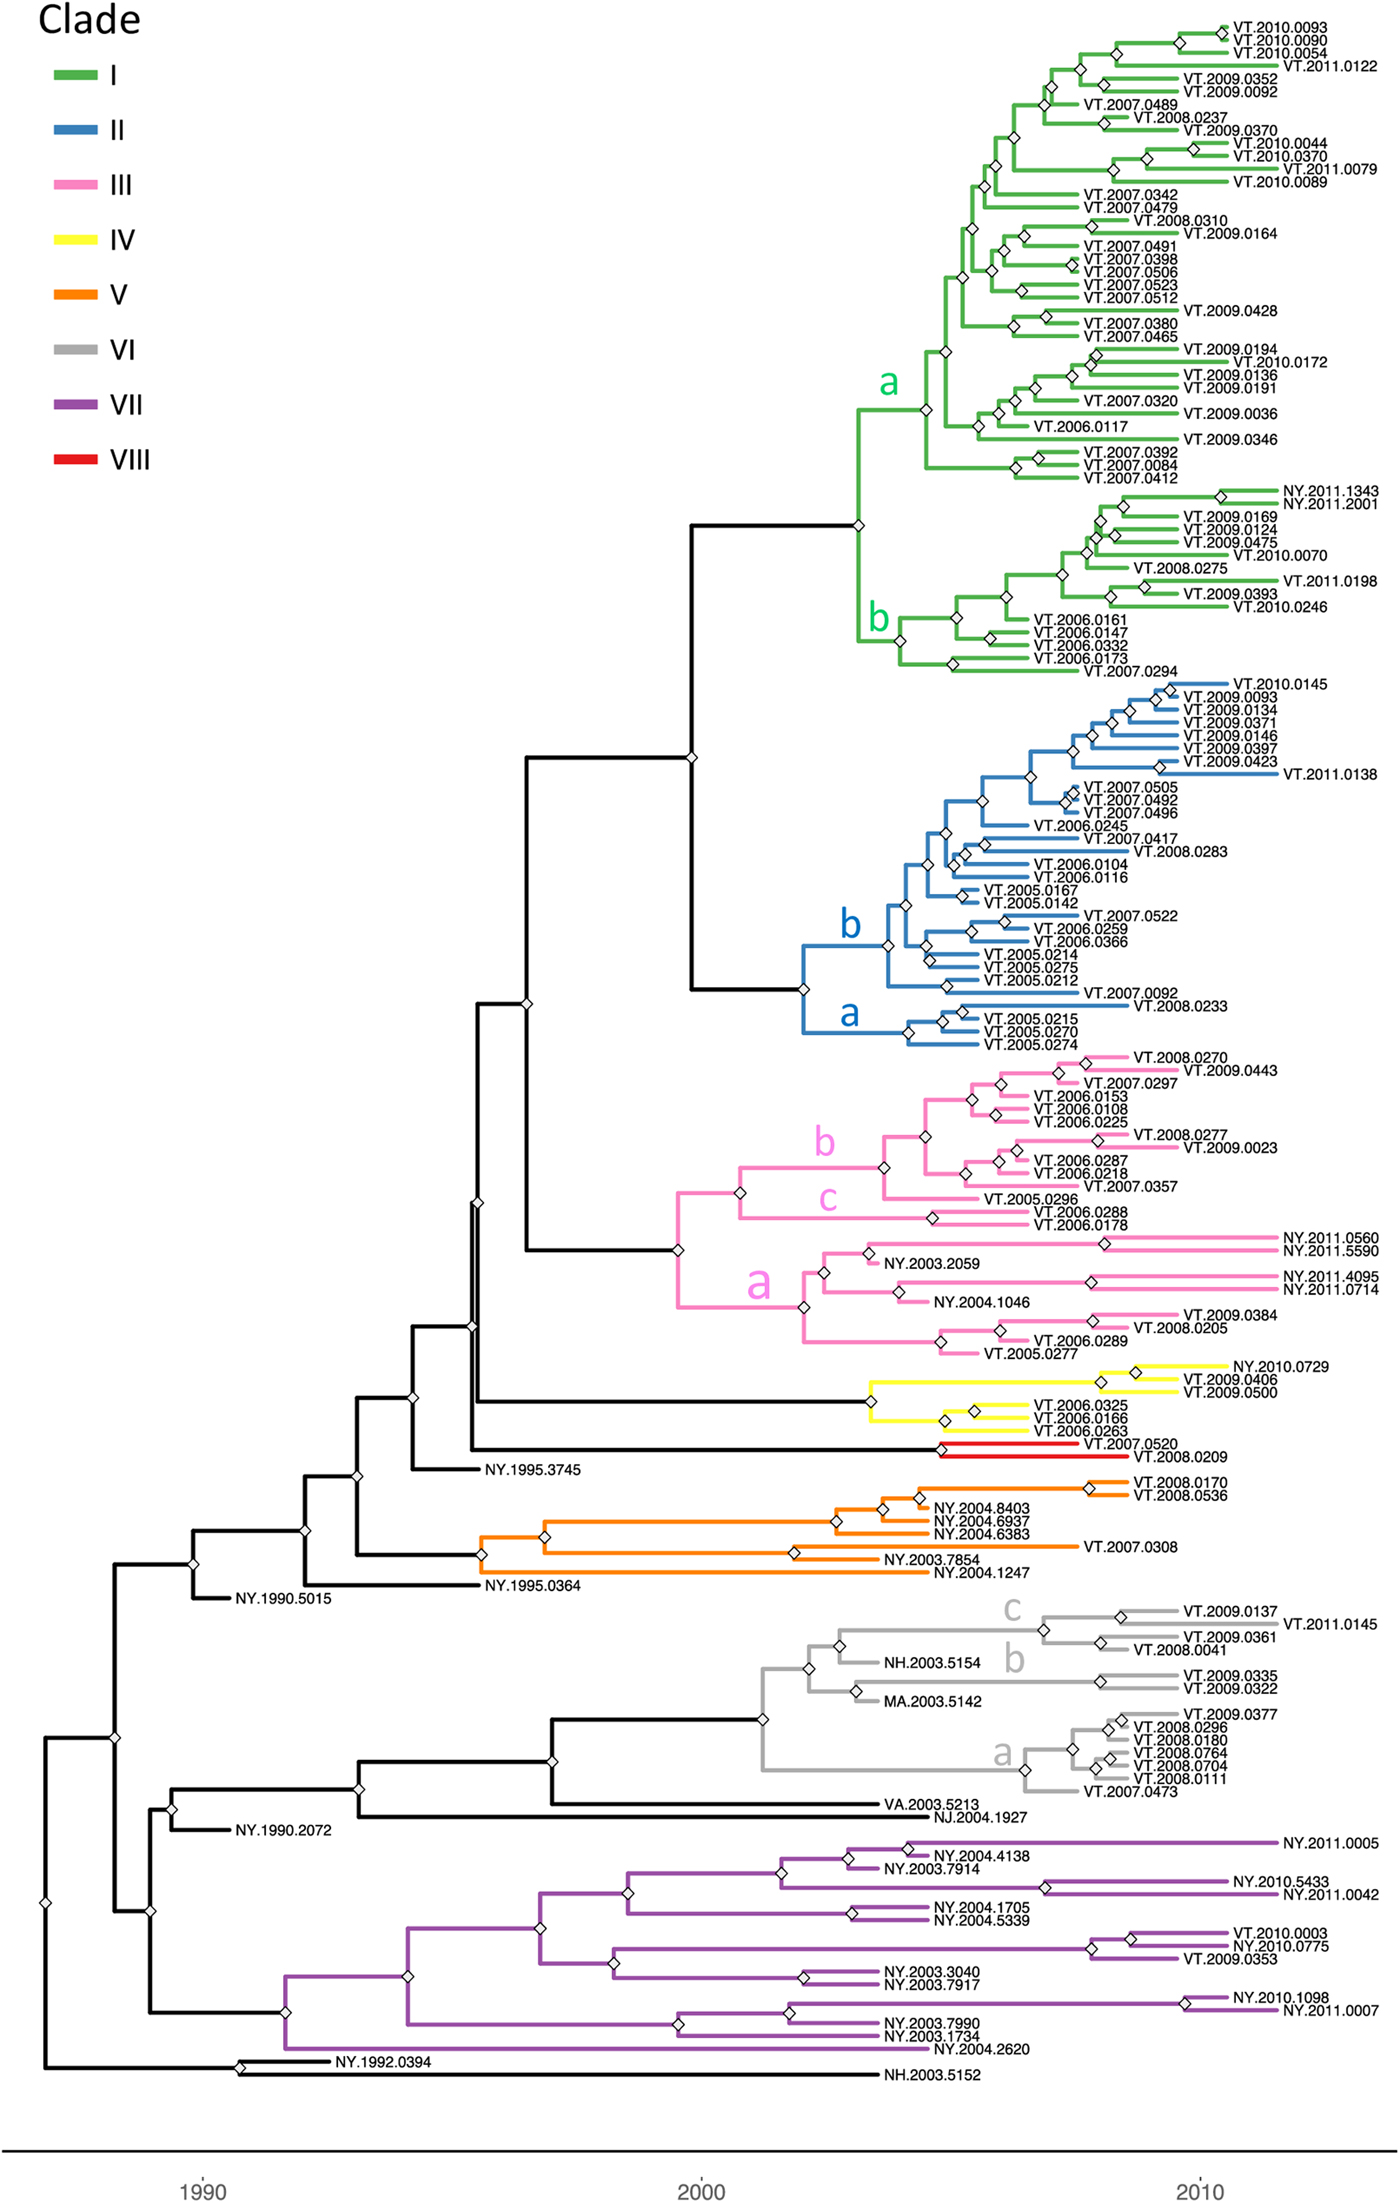
Fig. 2. Time-scaled Bayesian phylogeny (maximum clade credibility tree) of 160 whole genome raccoon rabies virus (RRV) sequences from Vermont and neighbouring regions. Branch colours indicate the clades as described in the text and nodes with posterior probability of greater than 90% are marked with grey diamonds. The letters a, b and c on some branches indicate sub-groups of these clades as described in the text. The timescale is indicated by the bar at the base of the plot.
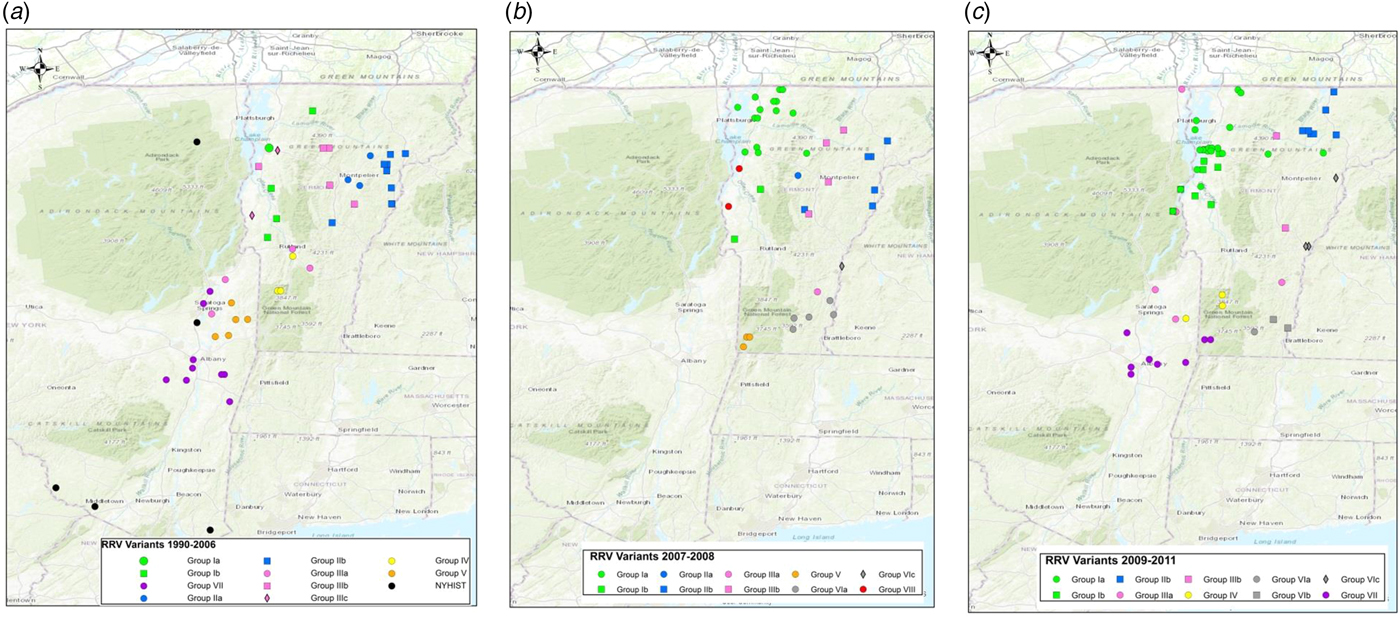
Fig. 3. Maps of Vermont and neighbouring regions showing the spatial distribution of RRV variants (colour-coded as in Fig. 2) over three periods: (a), 1990–2006; (b), 2007–2008; (c), 2009–2011. Each viral group and sub-group represented is identified in the key at the bottom of the map. Only samples from Vermont and New York are shown due to lack of detailed spatial data for samples from other states.
The heterogeneous group I included 49 Vermont samples recovered predominantly from the northwestern portion of the state between 2006 and 2011. With the exception of four isolates, all of the group I viruses originated from an area bound by Lake Champlain to the west and the Green Mountain range to the east and extending from Rutland county as far north as the Canadian border with a significant number recovered from the centrally located city of Burlington. Further division into two subgroups (Ia and Ib) was well supported with both types well dispersed throughout the area. Two group Ib isolates, collected just across the state line in neighbouring New York in 2011, apparently represent a recent incursion from Vermont back into New York. Three additional isolates of sub-group Ia collected in 2008, 2009 and 2011, were recovered from east of the Green mountain range and appear to represent a breakout of this variant into the north-eastern part of the state.
Group II comprised 29 isolates which were further differentiated, with strong support, into two sub-groups (IIa and IIb) (Fig. 2). They were distributed across the northeastern region of Vermont, east of the Green mountain range (Fig. 3). Group IIa variants came from the region surrounding Montpelier while the IIb variants were distributed more widely up to the state line with New Hampshire and as far north as the Quebec border.
Group III viruses, comprising 18 Vermont and six New York isolates recovered between 2003 and 2011, were further sub-divided with strongly support into three spatially separated sub-groups (Fig. 2). Members of sub-group IIIa were recovered from the southeastern region of Vermont, a low lying area cutting through the Green mountain range and in neighbouring areas of New York. Twelve sub-group IIIb samples were recovered throughout the study period from the central region of Vermont east of the Green mountain range in an area that also harboured group II viruses. The two group IIIc samples came from Addison county west of the Green mountain range.
Group IV consisted of five Vermont isolates, all recovered in 2006–2009 from an area north of the community of Bennington in the southwestern corner of the state and a single New York sample recovered from just across the border in 2010. The three group V samples, recovered from Vermont in 2007–2008, also from Bennington county, were closely related to five New York samples recovered from counties immediately across the state line. Group VII included 15 New York samples originating from the region around Albany since 2003 and just two Vermont samples, recovered from Bennington in 2009 and 2010, which were closely related to a sample (NY.2010.0775) from Berlin township that lies just west of the intersection of the New York-Vermont-Massachusetts state lines. Group VIII was composed of just two specimens recovered further north just east of the New York-Vermont state line south of Lake Champlain (Fig. 3).
All group VI isolates, present in Vermont, New Hampshire and Massachusetts, appeared to originate from a progenitor dated to 2001 (Fig. 2) although all the Vermont samples in this lineage were recovered from 2007 onwards. Of the three well-supported sub-groups (Fig. 2), the VIa and VIb Vermont viruses were all recovered from Windham county in the southeastern corner of the state between 2007 and 2009; a single sample from Massachusetts (MA.2003.5142) clustered as an outlier with the two VIb samples. A 2003 New Hampshire isolate (NH.2003.5154) grouped as an outlier to four VIc viruses recovered further north along the Vermont-New Hampshire state line in 2008–2009.
To place these viral groups into context with prior analyses, sequences from 20 samples representative of our dataset were compared with 10 isolates that had defined distinct lineages of the mid-Atlantic raccoon strain previously including one early VT sample recovered in 1994 [Reference Biek8]. Supplementary Figure S1 illustrates that most of the groups defined in this study cluster with members of the NE2 lineage, previously identified as the NY-east grouping [Reference Szanto9], while group VI samples clustered with members of the NE1 lineage.
Host association and phylogenetic cluster analysis
Tests for association between phylogeny and host species gave non-significant results for association index (observed mean 9.26, P-value 0.41) and maximum clade size (observed mean 7.11 and P-value 0.1 for raccoons; observed mean 3.4 and P-value 0.53 for skunks; and observed mean 1.02 and P-value 1 for other hosts) and the parsimony score metric was also non-significant at an alpha level of 0.05 (observed mean 54.14, P-value 0.06) (Table 2). These results, therefore, provide no evidence to support phylogenetic clustering by host species in these samples.
Table 2. Results of the phylogenetic cluster analysis examining the potential role of the striped skunk as a maintenance host for RRV in Vermont
The analysis was conducted in program BaTS [Reference Parker, Rambaut and Pybus25]. For an explanation of the summary statistics presented see [Reference Parker, Rambaut and Pybus25–Reference Slatkin and Maddison27].
Discrete trait reconstruction in BEAST revealed a strong association with the raccoon host for most branches within the RRV phylogeny, especially branches closer to the root (Fig. 4). In contrast, host association was more uncertain towards the tree tips and suggested several instances of potential cross-species transmission. BF analysis provided strong support for transitions from raccoon to skunk (BF: 11050) and raccoon to other species (BF: 45), as well as from skunk to raccoon (BF: 306). All other transitions were not supported (BF < 3). Markov jump counts gave a mean of 2.56 transitions from raccoon to skunk (95% HPD 0.68–4.89), 0.94 transitions from raccoon to other species (95% HPD 0.05–2.05) and 1.192 transitions from skunk to raccoon (95% HPD 0.01–2.75).
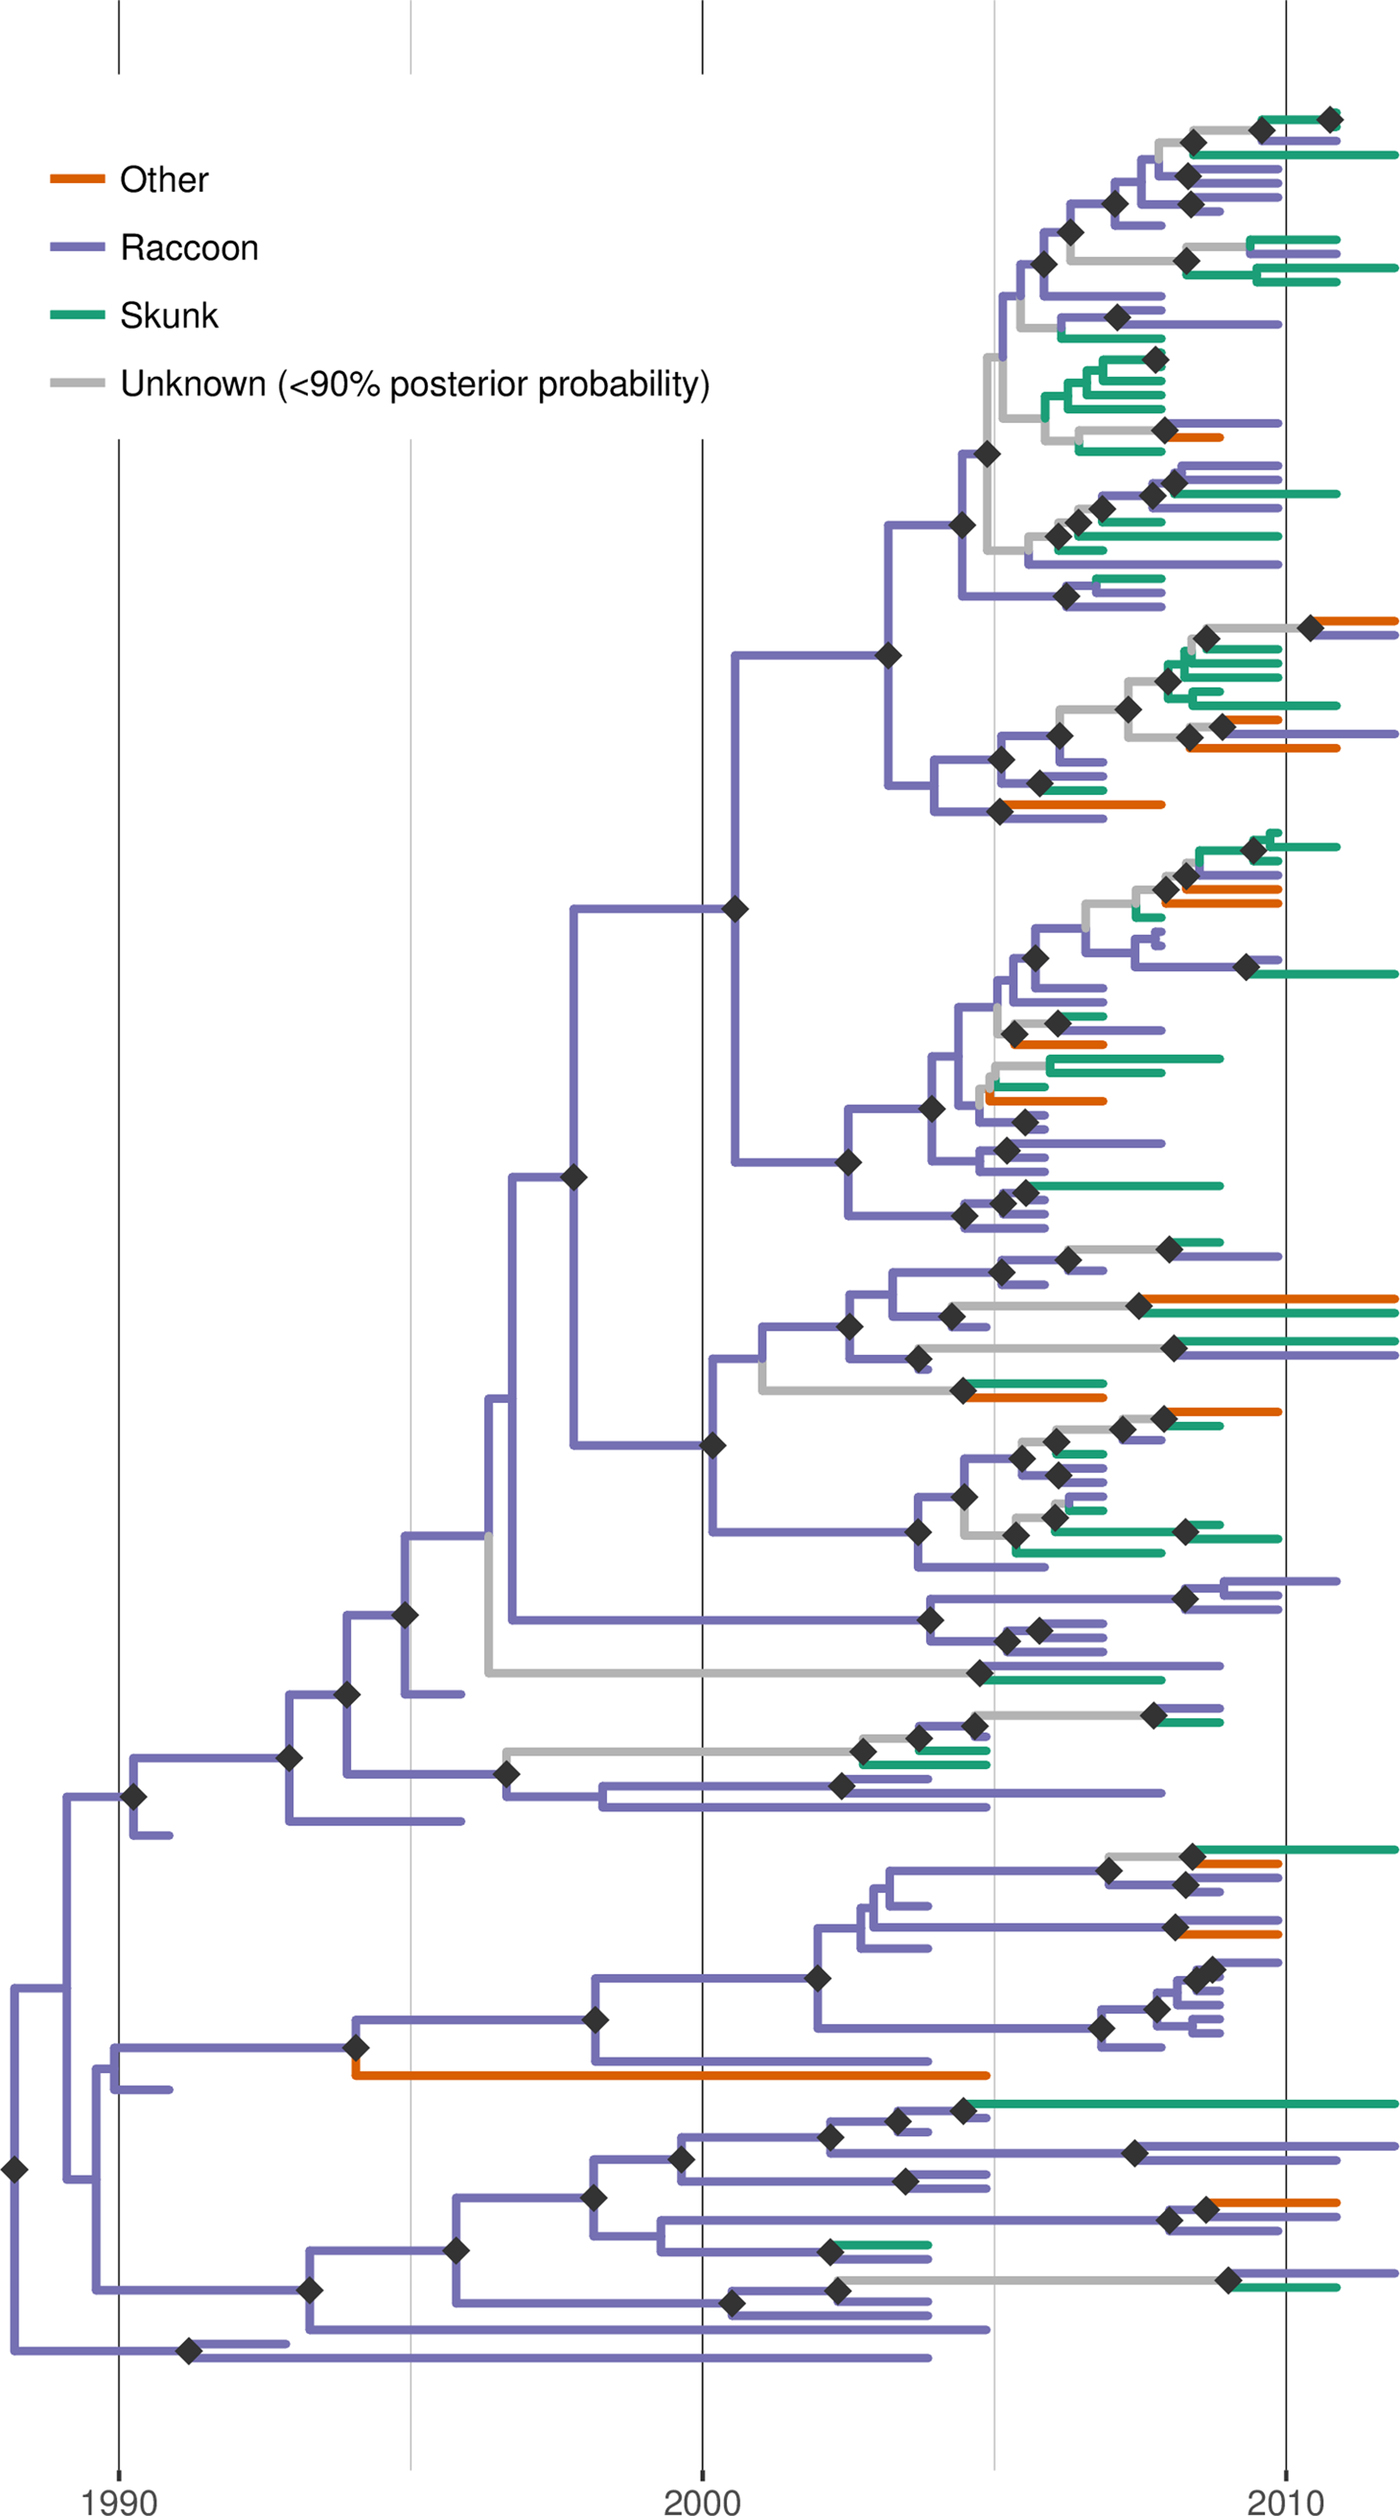
Fig. 4. Time-scaled Bayesian phylogeny (maximum clade credibility tree) of 160 whole genome sequences of raccoon rabies virus (RRV) from Vermont and neighbouring regions with host association estimated using discrete trait analysis in BEAST based on the host species from which each isolate was sampled. Branches are coloured according to host species (raccoon, skunk or other), unless the posterior probability of the association for none of the host species was >0.9, in which case branches are shown in grey. Dark grey diamonds indicate nodes with >0.9 posterior probability support. The timescale is indicated by the bar at the base of the plot.
Discussion
RRV phylogeny and landscape effects
Consideration of the surveillance records of raccoon rabies cases in Vermont over 19 years together with a detailed phylogeographic analysis of samples recovered over a 7-year period has generated a clearer picture of the emergence and spread of this outbreak. The common origins of many of these viruses with those present in New York support previous claims based upon surveillance data and limited phylogenetic analysis [Reference Biek8] that the Vermont outbreak originated from neighbouring regions of New York. However, for the first time the data also suggest multiple incursions of RRV into Vermont over the study period, the probable flow of the virus back into New York in some instances and more recent, distinct incursions of RRV from states to the east of Vermont. Several topographical features have acted as barriers to viral spread (Fig. 3) and this is believed to have resulted in the emergence of many viral sub-types in a scenario summarised in Figure 5 and further described below.
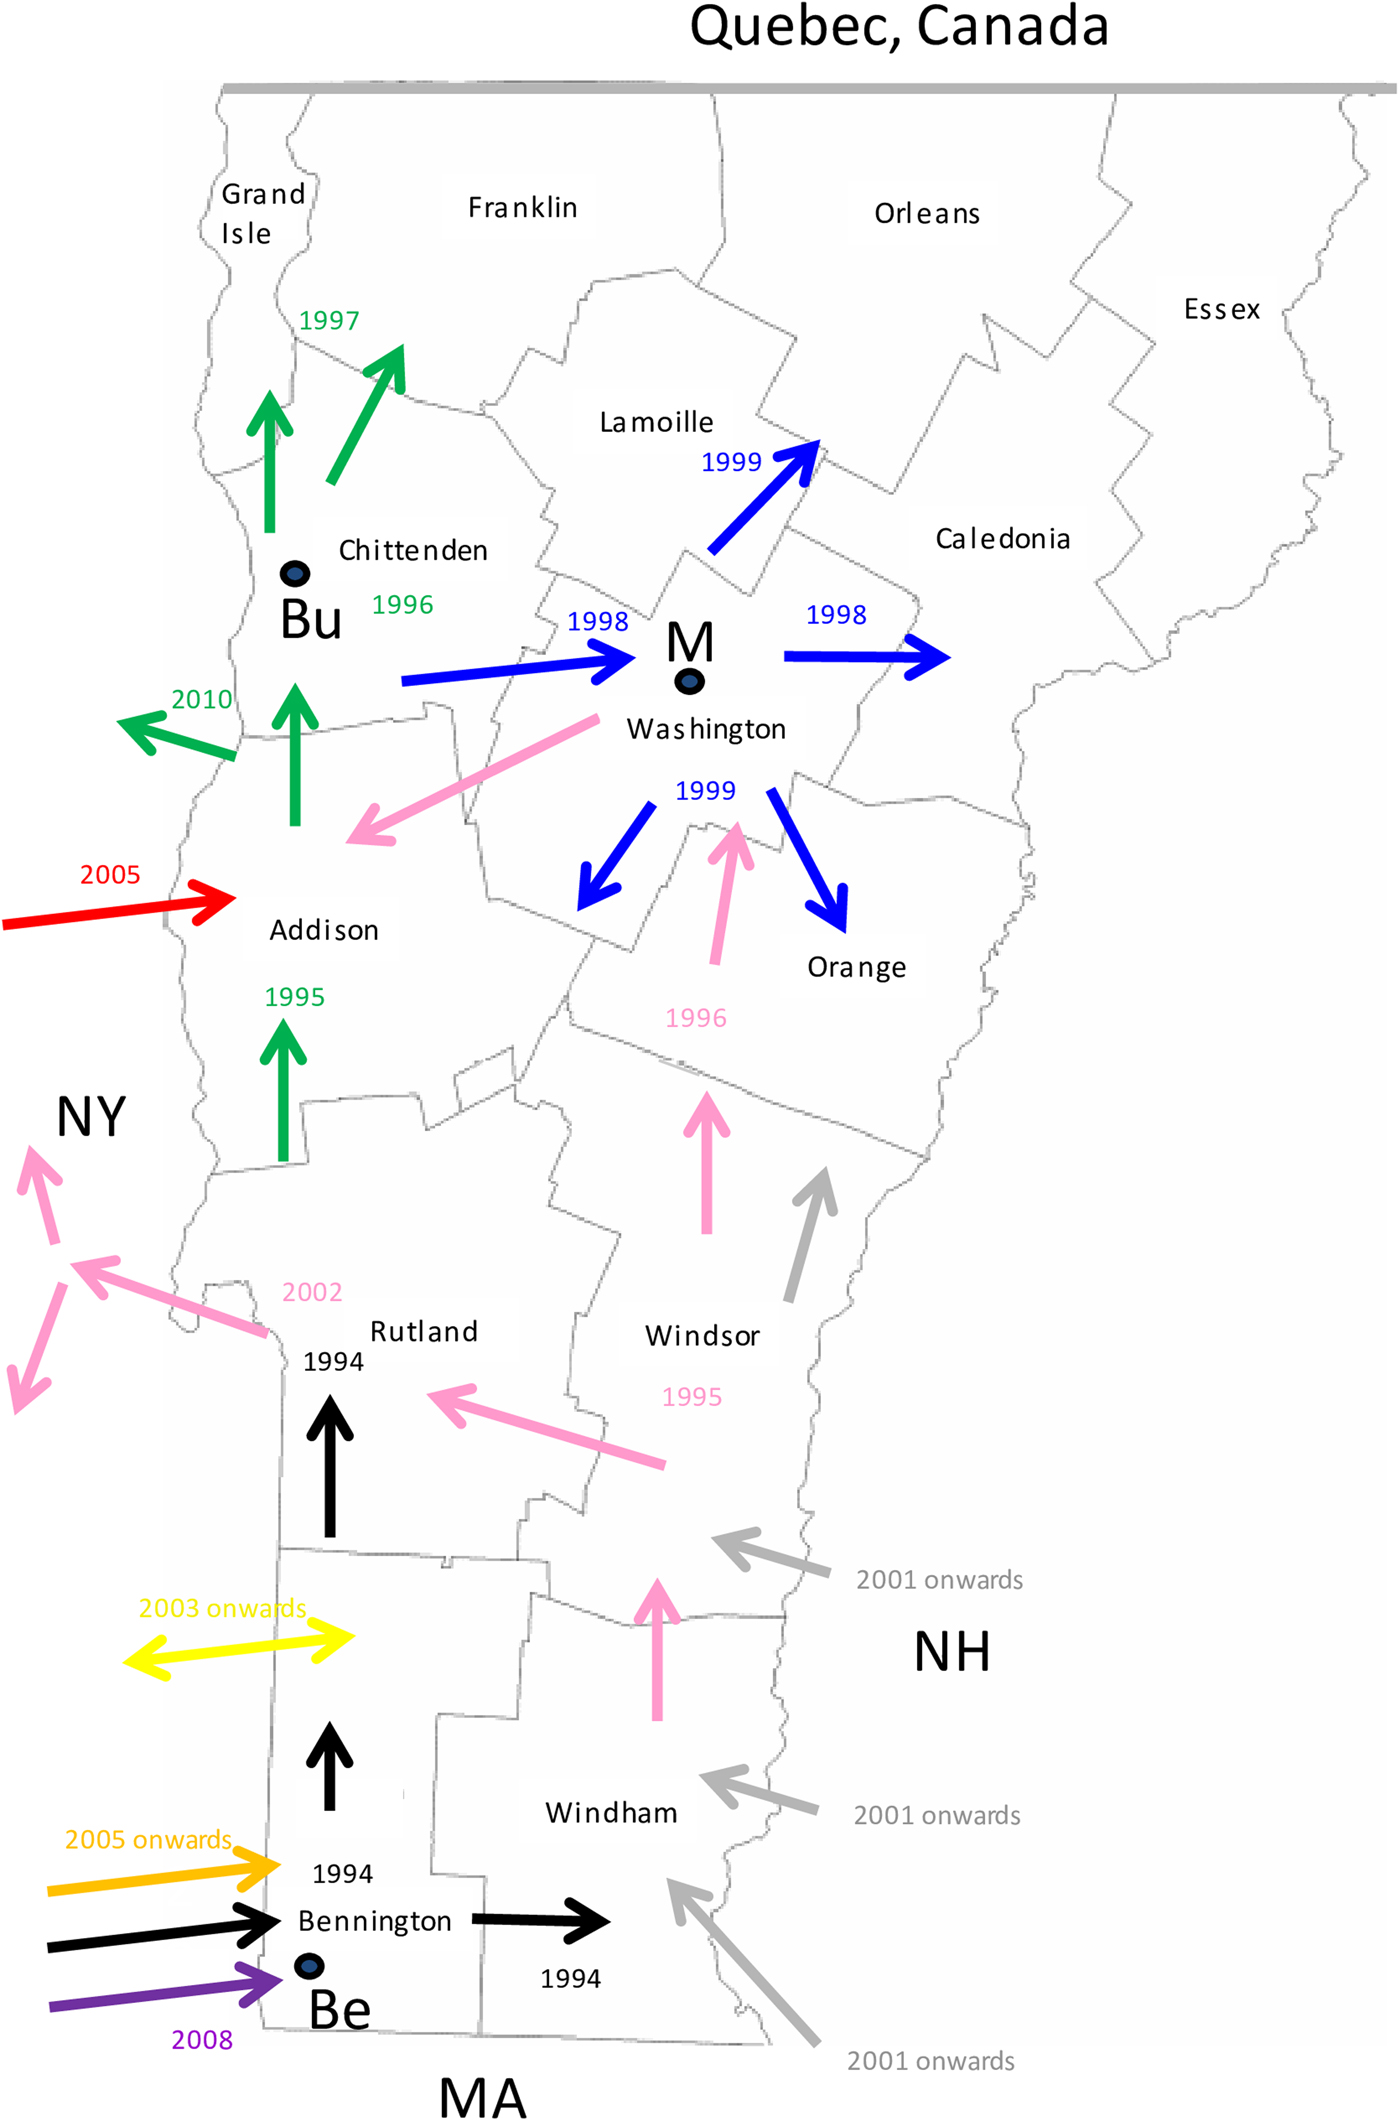
Fig. 5. A map of the state of Vermont showing the counties and the proposed direction of movement of the RRV variants identified in this study. Arrows are colour coded to represent the progenitor of Groups I, II and III (black) and the 8 VT groups as in Figure 2. The year in which the viral group entered an area is also indicated with the same colour coding. The locations of the following towns are indicated thus: Be, Bennington; Bu, Burlington; M, Montpelier.
Entry of RRV into Bennington county, in south-western Vermont (Supplementary Table S1), was first recorded in 1994 [Reference Wandeler5]. The responsible virus, which was closely related to viruses circulating in eastern New York during the mid1990s (NY.1995.3745, NY.1995.0364), then spread both northwards and eastwards to emerge into variants represented by clades I, II and III, all of which had a common origin. The north moving front spread along the east side of the Hudson River west of the Green mountain range to reach the north-western counties of the state by 1997. This virus has continued to circulate in the north-western area, west of the Green mountains, to emerge into group I with further division into Ia and Ib sub-types.
The Group II viruses emerged from a group I variant in the late 1990s as the outbreak spread eastwards into the northern counties of Lamoille, Washington and Orleans and continued to circulate in these and neighbouring counties throughout 2005–2011. Eastern spread of RRV at that time may have occurred due to forces similar to those that have resulted in eastwards movement of group Ia viruses more recently as discussed below.
Group III viruses emerged from an early offshoot of the original viral progenitor and are thus most likely derived from the viruses that spread eastwards into Windham county in 1994 and then moved northwards through Windsor, Orange and Caledonia counties in subsequent years. Accordingly, despite their distinct origins, viruses of groups II and III have in recent years occupied extensively overlapping ranges. Geographical segregation of group III has led to the emergence of three distinct sub-types. Viruses of sub-type IIIa have been recovered only from the southern parts of Vermont including a low-lying area in Rutland county as well as in the Hudson valley region of New York. The most likely explanation of the distribution and timeframe of recovery of this sub-type is an eastwards spread from Vermont back into New York, following a breach of the Green mountain range. The IIIb and IIIc subtypes have also been recovered from Addison county, suggesting that the second breach of this range occurred further north.
Since the initial incursion of RRV into Vermont in 1994, our phylogenies suggest that multiple additional incursions have occurred. Both groups IV and VIII emerged independently from early New York viruses that circulated in the 1990s but based on the limited numbers of isolates of each they appear to circulate in highly localised areas close to the state line. While group IV samples were recovered from Vermont in 2006–2009, a single New York sample of this type recovered from just across the border in 2010 may represent cross-border spread back into New York. In contrast, groups V and VII represent independent RRV variants that circulated in New York as early as 2003 but were recovered from southwestern Vermont only in 2007 and 2009, respectively. RRV appears to move relatively freely between Bennington county in southwestern Vermont and neighbouring New York counties due to the absence of any major landscape features that would limit raccoon movements. Spread between the two states further north in the Hudson valley south of Lake Champlain seems to be much less frequent, consistent with the prior identification of major waterways as significant barriers to RRV transmission [Reference Smith31].
Recovery of all Vermont group VI samples, primarily from the southeastern part of the state from 2007 onwards, suggests that these viruses entered Vermont more recently, probably as multiple incursions from New Hampshire and/or Massachusetts, given their clear sub-division into three well-supported sub-groups, VIa,b,c, (Fig. 2). Unfortunately, due to the lack of additional samples from these other states, no additional conclusions can be made regarding the emergence of these viruses.
While the spread of raccoon rabies by animal-to-animal transmission would be expected to limit the rate of spread of the disease according to the range size of individuals, our study did raise the possibility that anthropogenic factors could have contributed to this spread in some instances. For example, during the first 3 years of the outbreak, between 1994 and 1997, the disease spread approximately 240 km up the western side of the state. This rapid rate of spread of the epizootic was notable given that studies of raccoon movements in Ontario had suggested that most animals travel less than 5 km per year from their initial capture site [Reference Rosatte32], distances in line with radio-collar studies of raccoons in New Jersey [Reference Roscoe33]; however, the latter study also reported increased linear movement of rabid raccoons compared with non-rabid animals and suggested that such a behavioural change would help perpetuate the virus by accelerating its rate of spread and increasing the chance for transmission to naïve hosts. However, given the rapid rate of spread, an alternative possibility is that some diseased animals were transported long distances either intentionally or inadvertently, by human activity. Long distance RRV spread has been identified previously [Reference Smith34] and may involve events such as ‘hitch-hiking’ of infected animals on transport trucks. Such events could explain the rapid movement of raccoon rabies in those early years and might also explain the appearance of three group Ia viruses, recovered between 2008 and 2011, in the north-eastern part of the state well outside the normal range of that variant. The highway connection between the cities of Burlington and Montpelier might result in increased chances of human-mediated animal movements; alternatively, the lower elevation of this area may have been more conducive to eastwards spread of rabies in the raccoon population compared with regions further south where the Green mountain range acts as a significant barrier.
Skunks are a transmission but not a maintenance host of RRV in Vermont
Despite the high proportion of skunks infected with RRV in this dataset, the phylogenetic clustering analysis failed to identify any clades that were specifically associated with this host, providing no evidence to support the role of skunks in viral maintenance. However, contrary to our expectations, we also failed to detect significant clusters of viruses associated with raccoons, despite the fact that this species is well established as the main reservoir host for RRV. A possible explanation for this result is that any strong host associations in Vermont are likely to be obscured by the relative high frequency of cross-species transmission and detection of RRV in skunks and other species, resulting in clades being associated with a mix of different hosts. Phylogenetic clustering would be expected to have limited ability to detect host associations under such circumstances.
Applying discrete trait analysis to infer host associations along the entire RRV phylogeny found that most branches, especially those in more basal positions, were strongly associated with raccoons, consistent with this species being the prime maintenance host for RRV in Vermont. As expected, given the dominant role of raccoons as host, transitions (interpretable as cross-species transmission events) from raccoons to skunks and from raccoons to other species received strong BF support. However, somewhat surprisingly, the analysis also revealed strong BF support for transitions from skunk to raccoon, albeit at a lower frequency than in the opposite direction. This finding implies at least temporary persistence of the virus in skunk populations followed by cross-species transmission back into the raccoon host. According to the inferred host associations mapped onto the MCC tree (Fig. 4), there are a few instances where such host shifts from raccoons into skunk are evident and a few branches which can be confidently linked to skunks as hosts, indicating that if anything, such switches must have been rare and short-lived. It is also worth noting that the observed patterns of host association could at least be partially due to our opportunistic (and thus potentially biased) sampling: if the probability of detecting an infected animal was higher for skunks than raccoons in certain areas (for example due to local variation in relative abundance), this could generate a false signal of local association with skunks, even if this species acted strictly as a dead-end host. However, in the absence of further information, we are unable to assess this possibility. Based on the current data and results, we conclude that skunks are not a maintenance host for RRV in Vermont but that we also cannot rule out that some skunk-to-skunk transmission might be occurring.
Conclusions
The highly resolved phylogenies provided by WGS analysis of RRVs recovered from Vermont and neighbouring states has revealed the complex pattern of viral variants that circulated across the state over a 7-year period (2005–2011). Interrogation of phylogeographic and surveillance data has permitted the development of a likely scenario describing how topographical landscape features have resulted in the emergence of this complex situation. Information regarding the identification of bottlenecks that limit RRV spread and areas that support frequent disease transmission should facilitate more targeted and effective control of rabies in the raccoon, the only species which appears to drive this epizootic in Vermont.
Supplementary material
The supplementary material for this article can be found at https://doi.org/10.1017/S0950268818001759.
Acknowledgements
We are most grateful to the following for provision of RRV-infected samples together with related metadata in support of the molecular epidemiological analysis presented in this work: Laura Kamhi, Rabies Unit, Vermont Public Health Laboratory, Burlington, Vermont; Robert Rudd, Rabies Laboratory, New York State Department of Health, Albany, New York; L. Orciari, Rabies Group, CDC, Atlanta, Georgia. We thank Mary Sheen and Sarah Kamm for excellent technical assistance. This work was supported by the National Institutes of Health (L.R., grant number RO1 AI047498).
Conflict of interest
None.


