


Introduction
Scholars have long been interested in the distinctive political preferences of different social groups (Berelson et al., Reference Berelson, Lazarsfeld and McPhee1954; Blais, Reference Blais2005). One of the most distinctive and understudied groups, particularly in Canada, is the lesbian, gay and bisexual (LGB) community. Research from Canada (Perrella et al., Reference Perrella, Brown and Kay2012, Reference Perrella, Brown, Kay and Tremblay2019) and elsewhere (Hertzog, Reference Hertzog1996; Turnbull-Dugarte, Reference Turnbull-Dugarte2020b) shows that LGB voters share a set of distinctive political preferences, constituting what Hertzog (Reference Hertzog1996) calls a “lavender vote.” LGB voters prefer left-of-centre parties and endorse left-leaning positions on a range of issues, including issues unrelated to LGB rights. In Canada, this means that LGB voters are the least likely to vote Conservative, although LGB voters seem to split over their left-of-centre party preferences (Perrella et al., Reference Perrella, Brown and Kay2012, Reference Perrella, Brown, Kay and Tremblay2019).
As Perrella et al. (Reference Perrella, Brown and Kay2012) note, despite LGB voters’ distinctive attitudes, they are understudied in Canada. This is partly because surveys rarely ask respondents to indicate their sexual identities and because, even if they do, surveys rarely sample enough respondents to study the attitudes of sexual minorities. While scholars working in the field of LGB political behaviour have been careful to stress that the LGB community is “not a homogeneous community” (Perrella et al., Reference Perrella, Brown, Kay and Tremblay2019: 76), the constraints imposed by existing data have often forced scholars to group lesbian, gay and bisexual voters together. This leaves us with an important unanswered question: Is the LGB vote uniform across groups within the queer community, with lesbian, gay and bisexual voters sharing similar political attitudes? Or do notable political differences exist within the LGB community?
Different mechanisms have been offered to explain the distinctive left-wing preferences of LGB voters. Taken together, the presumption is that LGB identities are taken up in a context in which LGB individuals must fight for their rights (Schaffner and Senic, Reference Schaffner and Senic2006), their identities are stigmatized (Egan, Reference Egan2012; Swank, Reference Swank2019), they have strong ties to the LGB community (Bailey, Reference Bailey1999; Sherrill, Reference Sherrill1996) and they become attached to parties that advocate pro-LGBTQ+ policies (Turnbull-Dugarte, Reference Turnbull-Dugarte2020c). However, Canada has become more accepting of sexual minorities, most notably with the legalization of same-sex marriage across Canada in 2005. Public opinion has moved as well. The Canadian Election Study (CES) has regularly asked respondents to place their feelings toward gay and lesbian people on a scale from 0 to 100, where 0 means they really dislike them and 100 that they really like them. The mean score increased from 45 in 1993 to 73 in 2019 (see Figure 1 in the online appendix). We study LGB political attitudes a decade and a half after same-sex marriage was legalized, after many of the mechanisms driving the distinctiveness of the LGB vote may have weakened. We use data from the 2019 CES (Stephenson et al., Reference Stephenson, Harell, Rubenson and Loewen2020) (n = 37, 822, including 3,201 respondents who self-identify as LGB). To our knowledge, this is the largest sample of LGB voters ever surveyed in Canada. The large sample size allows us to identify differences among the political attitudes of gay men, lesbian women, bisexual men, bisexual women, and heterosexual men and women.

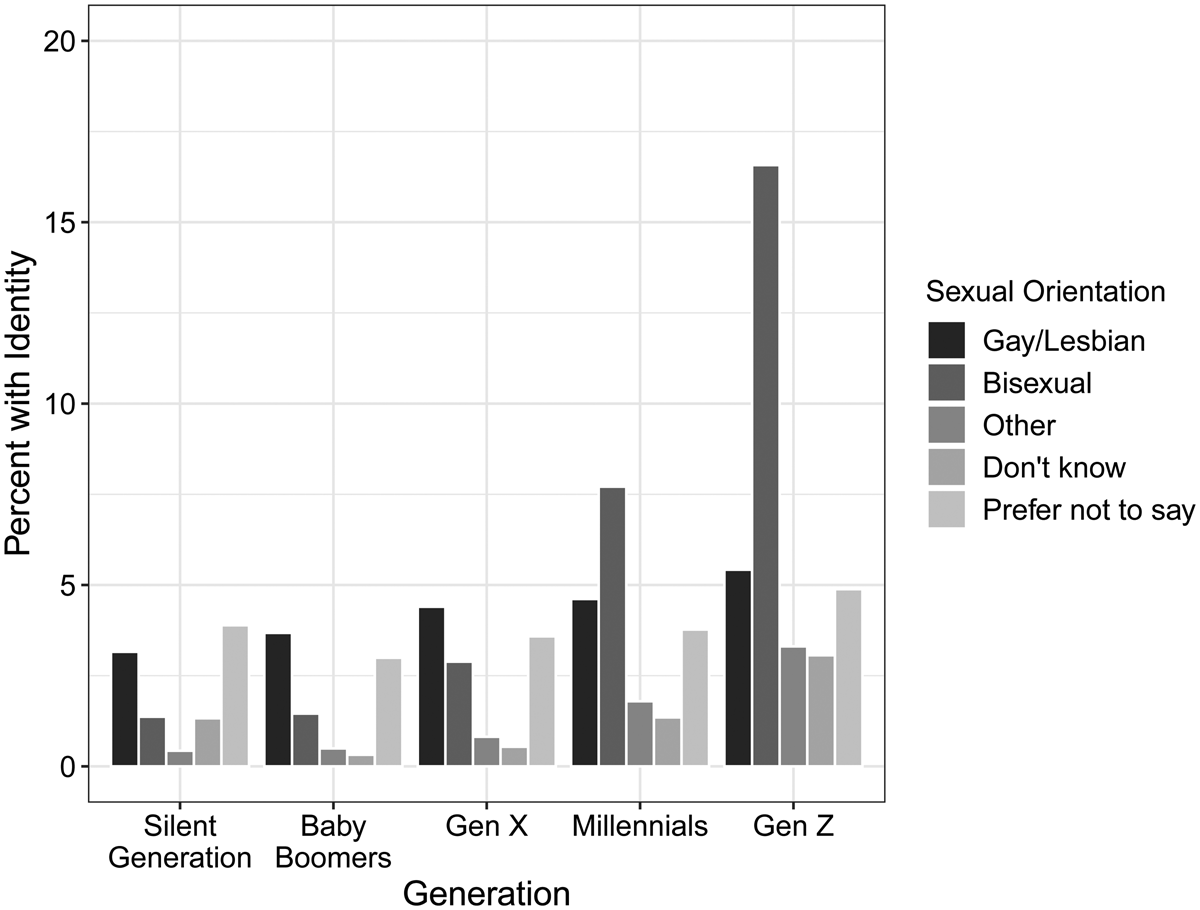
Figure 1. Per Cent of Canadians with Non-heterosexual Identities. The figure shows that bisexual identity has become more prevalent over time, especially in Generation Z.
Given the large number of LGB respondents, the 2019 CES also allows us to study differences across generations in political attitudes. In previous studies of Canadian LGB voters, the youngest respondents came of age prior to the recent landmark advances in same-sex rights in Canada, including the legalization of same-sex marriage and adoption for same-sex couples. In contrast, the youngest respondents in the 2019 CES were born in the 2000s and came of age during an era of greater acceptance. Our analysis shows that the youngest Canadians, and particularly young women, are less likely to identify as heterosexual. Notably, more than a fifth of Generation Z women identify as bisexual. We limit our analysis to the attitudes of heterosexual, “homosexual” (lesbian women and gay men) and bisexual voters and ignore other sexual identities, because the CES 2019 only includes these three categories. As such, in our analysis, we refer to the political attitudes of LGB voters (although we reference the broader LGBTQ+ community and policies in our discussion). The CES 2019 used the term “homosexual,” but we try to avoid this term (referring to gay and lesbian women instead), because some consider the term offensive and recommend using it with direct quotes (see GLAAD, 2021).
We make a novel contribution by showing that there are notable differences between gay men, lesbian women, bisexual men, and women. In particular, we find that bisexual women are the most distinctive voter block, expressing the most left-leaning political attitudes and vote choice. This is a particularly important finding because the number of self-identified bisexual women has grown in recent generations. We further test differences in gaps in preferences between sexual minorities and heterosexuals and find that, on average, the sexuality gap has remained constant across generations. As a final contribution, we estimate the causal effect of marriage on LGB voters. Using a matching algorithm to compare married LGB voters to their unmarried counterparts, we test whether participating in the institution of marriage reduces the distinctiveness of LGB attitudes. We find that marriage does decrease the distinctiveness of lesbian women's and gay men's (but not bisexual voters’) political attitudes—bringing married lesbian and gay voters’ political attitudes more in line with those of married heterosexual voters.
The Distinctive LGB Voter
American research has consistently shown that, compared to heterosexual voters, LGB voters are more likely to vote Democratic, are more likely to label themselves as liberal (Hertzog, Reference Hertzog1996; Egan, Reference Egan2012; Egan et al., Reference Egan, Edelman and Sherrill2008) and twice as likely to engage in political protests (Swank, Reference Swank2019). LGB voters in the United States take more left-leaning positions on a range of public policy issues, on both LGB civil rights issues (Schaffner and Senic, Reference Schaffner and Senic2006) and issues completely unrelated to LGB rights (Egan, Reference Egan2012; Egan et al., Reference Egan, Edelman and Sherrill2008; Schnabel, Reference Schnabel2018; Grollman, Reference Grollman2018; Swank, Reference Swank2019). The trends seen in the United States are also reflected in Europe, where LGB voters overwhelmingly support economically left-leaning parties (Turnbull-Dugarte, Reference Turnbull-Dugarte2020a). Furthermore, European LGB voters tend to be distinctive in their support for European integration and in their pro-immigrant attitudes (Turnbull-Dugarte, Reference Turnbull-Dugarte2020b).
In Canada, there is clear evidence that LGB voters are less likely than their heterosexual counterparts to vote for the Conservative Party (Perrella et al., Reference Perrella, Brown and Kay2012, Reference Perrella, Brown, Kay and Tremblay2019). Perrella et al. find that gay and bisexual men tend to prefer the Liberal Party and that lesbian and bisexual women tend to prefer the New Democratic Party (NDP). Unfortunately, although Canadian scholarship has been careful to recognize that the LGB community is “not a homogeneous community” (Perrella et al., Reference Perrella, Brown, Kay and Tremblay2019: 76), the constraints imposed by existing data have forced researchers to either group all LGB voters together or to group lesbian and bisexual women together and gay and bisexual men together in their analyses of non-heterosexual political preferences (see the online appendix for more details).
For instance, Perrella et al. (Reference Perrella, Brown, Kay and Tremblay2019) were able to distinguish between men and women members of the LGB community. However, due to the constraints of available data, the authors were unable to distinguish between lesbian and bisexual women, or between gay and bisexual men. As a result, it is not clear whether Perrella et al.'s (Reference Perrella, Brown, Kay and Tremblay2019) findings—for example, that lesbian and bisexual women are more supportive of the NDP—represent gendered differences (in general) or whether the differences are being driven by the distinctiveness of bisexual voters, who largely outnumber lesbian women among non-heterosexual women.
Why Is the LGB Vote Distinct?
Research into the distinctive preferences of LGB voters follows long-standing scholarly interest in the voting preferences of different social groups (Berelson et al., Reference Berelson, Lazarsfeld and McPhee1954; Blais, Reference Blais2005). Observing that ethnic, religious and class groups had different political preferences in their landmark study of the 1948 US election, Berelson et al. (Reference Berelson, Lazarsfeld and McPhee1954) proposed three bottom-up explanations for social groups’ distinctive attitudes. The first explanation centres on shared interests. Because groups are affected by government policies in particular ways, social group members tend to prefer similar candidates or sets of policies that benefit the group. A second mechanism is community influence. Because members of social groups are closer socially and physically, social group members influence each other's preferences. A third mechanism is family socialization, where parents transmit their political preferences to their children. In order to account for the distinctiveness of LGB attitudes, scholars have drawn on the mechanisms of shared interests and community influence described by Berelson et al. (Reference Berelson, Lazarsfeld and McPhee1954). Because same-sex identity is not transmitted from parents to their children, the third mechanism is not thought to play a direct role in fostering the distinctiveness of the LGB vote (Egan, Reference Egan2012).
With respect to shared interests, Schaffner and Senic (Reference Schaffner and Senic2006) argue that LGB voters support the Democrats in the United States because of their concern for spousal benefits. They find that LGB voters who consider employee spousal benefits important are more likely to identify as Democrats and were more likely to vote for Gore in the 2000 US election. Similarly, Lewis et al. (Reference Lewis, Rogers and Sherrill2011) find that concern for LGB rights drives liberalism and support for Gore. However, as Egan (Reference Egan2012) points out, the cohesiveness of LGB political behaviour cannot satisfactorily be explained by shared interests. In the United States, LGB voters consistently support Democratic candidates, regardless of whether their Democratic representatives support pro-LGB policies or not. In Canada, the cohesiveness of the LGB vote might be considered even more anomalous, since—at least over the last decade—there has been greater political consensus in support of LGB rights across the political spectrum. Although the Conservatives at one point opposed marriage equality, by 2016 the Conservatives had voted to officially end their party's opposition to marriage equality. By 2011, the then governing Conservative Party's foreign policy included a strong defence of LGB rights (Hopper, Reference Hopper2012). For instance, the Conservative government fast-tracked the immigration of 100 gay Iranians to save them from execution.
With respect to community influence, scholars have proposed two routes by which the social and physical proximity of LGB voters contribute to the distinctiveness of the LGB vote. The first is the “conversion” experience of coming out, where coming out entails “a profound life-altering event, triggering a reconsideration of assumptions about society and politics, greater sympathy for marginalized groups, and a rethinking of political allies” (Perrella et al., Reference Perrella, Brown and Kay2012: 92; see also Egan et al., Reference Egan, Edelman and Sherrill2008). This mechanism would account for findings about LGB voters’ greater support for immigration (Turnbull-Dugarte, Reference Turnbull-Dugarte2020b).
The second path by which community influence shapes the distinct LGB vote is the experience of “embeddedness.” Embeddedness refers to the over-time acculturation that takes place when individuals are immersed in political subcultures. The distinct lesbian, gay and other queer subaltern communities have traditionally espoused distinctly countercultural, politically left subcultures. For instance, some of the most well-known lesbian authors and activists have explicitly linked lesbian existence with feminist liberation politics (Dworkin, Reference Dworkin2006; Rich, Reference Rich1980). Given the politically progressive subcultures within the LGB communities (Egan, Reference Egan2008), social processes should encourage LGB identifiers to adopt more left-leaning political attitudes. Similarly, Bailey (Reference Bailey1999) argues that LGB people develop distinct political attitudes by interacting with other LGB community members in American cities. Sherrill (Reference Sherrill1996) finds that LGB people have had more political power to achieve gay rights bills in US cities located in states with a higher concentration of gay bars or in college towns, which provide venues for discussion among LGB individuals (see also Ayoub and Kollman, Reference Ayoub and Kollman2020). Moreover, Lewis et al. (Reference Lewis, Rogers and Sherrill2011) find that LGB voters who are more socially involved are more liberal. However, Egan (Reference Egan2008) finds no association between liberalism among LGB voters and measures of embeddedness, including having an LGB neighbour and age (a proxy for the length of time one has been a member of the LGB community).
As we noted, the final mechanism proposed by Berelson et al. (Reference Berelson, Lazarsfeld and McPhee1954), family socialization, is not thought to play a direct role in fostering the distinctiveness of the LGB vote because sexual orientation is not passed down from parents to children. Instead, Egan (Reference Egan2012) proposes an additional explanation for LGB distinctiveness: self-selection. Egan (Reference Egan2012) points out that self-identification as a sexual minority requires active self-selection into the LGB group. For instance, people who live in larger metropolitan areas, have college-educated mothers, or who have parents who were born in the United States are more likely to openly take up their LGB identities (Egan, Reference Egan2012). This creates powerful selection effects, where people who both feel same-sex attraction and share certain background characteristics are more likely to adopt an LGB identity. These selection effects help explain the highly cohesive behaviour of LGB voters, as the variables that drive selection into openly LGB identities are correlated with political attitudes and behaviours. Selection creates an asymmetry where there are more openly self-identified members of the LGB community among liberal-minded voters. To estimate the magnitude of this selection effect on political attitudes, Egan (Reference Egan2012) matches “treated” cases (openly gay-identified voters) to “control” cases (those who do not identify as gay) using matching techniques and finds that nearly half of the difference in the presidential voting gap between LGB and heterosexual voters can be attributed to selection.
A fourth, top-down mechanism has been proposed by Turnbull-Dugarte (Reference Turnbull-Dugarte2020c), who describes how partisan mobilization contributes to the distinctiveness of the LGB vote. Specifically, if a left-leaning party adopts a pro-LGBTQ+ platform, LGB voters will be attracted to that party on this single issue. In turn, LGB voters’ attachment to that party may socialize LGB partisans to support their party's other platform issues.
We would expect the distinctiveness of the LGB vote to be decreasing over time (for there to be a smaller gap in the political preferences of more recent generations). Changes in institutions, including the institution of marriage, lead to changes in public opinion (Abou-Chadi and Finnigan, Reference Abou-Chadi and Finnigan2019). More recent generations of LGB voters who came of age following marriage equality and other civil rights milestones may not feel the need to support particular parties (thus reducing the effect of shared interests). Similarly, LGB voters’ greater acceptance outside of their respective queer communities may make it easier for people to openly identify as LGB (reducing the effect of selection). We thus expect that generations of LGB voters who reached voting age following marriage equality and other civil rights successes—notably Millennials and Generation Z—will have policy attitudes that are less distinct from the policy attitudes of heterosexual voters. Furthermore, LGB Canadians’ greater inclusion in institutions and social networks outside of LGB communities means that people who identify as LGB are less likely to be marginalized into enclaves, which should reduce LGB Canadians’ exposure to the LGB community relative to the rest of society (reducing the effect of embeddedness).Footnote 1 This process should manifest clearly among married members of the LGB community. If LGB folk who get married spend more time with their spouse than with the wider LGB community, they should be less influenced by the community and thus have political preferences that are less distinct from heterosexuals. There is a literature showing that married people are more conservative than unmarried people (see, for example, Wilson and Lusztig, Reference Wilson and Lusztig2004). While the same mechanisms that make married people in general more conservative may influence LGB people as well, we expect married LGB people to spend less time in the LGB community and more time with their spouse, and thus to be less influenced by the progressivism of the LGB community.
Another reason the attitudes of LGB individuals may have become less distinct is the increasing consensus among political parties in favour of LGB rights. The increasing support for LGB rights, most notably by the Conservative Party, should increase LGB individuals’ support for that party. In turn, given that parties influence political attitudes (Campbell et al., Reference Campbell, Converse, Miller and Stokes1980; Guntermann and Lachapelle, Reference Guntermann and Lachapelle2020), convergence in LGB stances by parties may also have reduced distinctiveness on other dimensions.
Methods
We use data from the 2019 CES. The online Campaign Period Study (CPS) asked all 37,822 respondents whether they consider themselves heterosexual, “homosexual” or bisexual. The sample includes 3,201 respondents who identified as LGB (1,566 respondents who identified as “homosexual” and 1,635 who identified as bisexual). To our knowledge, this is the largest sample of LGB people ever surveyed in Canada.
We focus on three dependent variables representing political preferences. The first is ideological self-placement on a scale from 0 (left) to 10 (right). The second is an anti-immigration scale, which we created by taking the mean of responses to questions about how much the federal government should spend on immigrants and minorities; whether Canada should allow more immigrants, fewer immigrants or about the same number of immigrants as now; and whether Canada should allow more refugees, fewer refugees or about the same number of refugees as now. (See the online appendix for question wording.) Scale reliability is high (Cronbach's alpha = 0.86). To ensure we include the largest number of LGB identifiers, we only focus on questions related to policy outcomes that were posed to the full sample. These questions do, however, cover the main dimensions of political competition that have been considered in prior research on LGB voters: (1) left-right ideology and (2) immigration (Egan et al., Reference Egan, Edelman and Sherrill2008; Perrella et al., Reference Perrella, Brown and Kay2012; Turnbull-Dugarte, Reference Turnbull-Dugarte2020b). To facilitate interpretation, we rescale both ideology and the immigration scale from 0 to 1, where 0 is the most left-wing position (ideologically left-wing or pro-immigrant position) and 1 is the most right-wing position (ideologically right-wing or anti-immigrant position). The third outcome in our analysis is vote intentions. We rely on vote intentions measured in the CPS rather than vote choice (asked in the Post-Election Study [PES]) to avoid losing respondents. In all our analyses, we use the CPS “all campaign period respondents” weights.
In our analyses of the effects of marriage on gaps in policy preferences, we do our best to make a causal claim about marriage. We match on the following demographic variables: education, generation, province, language, ethnicity, whether born in Canada, employment, and urban-rural residence.Footnote 2 We use one-to-one nearest-neighbour matching, implemented in MatchIt (Ho et al., Reference Ho, Imai, King and Stuart2011). Matching allows us to rule out spurious relationships caused by these variables. Unlike regression, matching allows us to compare otherwise similar people (similar in terms of the socio-demographic features included in our analysis) without making assumptions about how these variables relate to the dependent variables. However, matching does not allow us to rule out reverse causality (that is, that people with certain political preferences are more likely to get married). In our discussion, we explain why reverse causality is unlikely to account for our findings.
Results
A descriptive look at the LGB vote
Previous work has found that LGB voters are between 2 and 5.5 per cent of the Canadian population. Moreover, while the majority of non-heterosexual men identify as gay, the majority of non-heterosexual women identify as bisexual (Perrella et al., Reference Perrella, Brown, Kay and Tremblay2019). In the 2019 CES, we find a higher percentage of LGB individuals than in previous studies: 8.8 per cent of respondents identify as LGB (4.2 per cent as gay or lesbian and 4.6 per cent as bisexual). A further 5.6 per cent answer “Other,” “Don't know” or “Prefer not to answer” when asked about their sexual orientation. However, these overall numbers mask considerable heterogeneity across generations and genders.
Figure 1 shows the distributions of responses to the LGB identification question by generation. To make the figures readable, we exclude the heterosexual category (which received many times more responses).Footnote 3 In our descriptive look at the LGB vote, we consider Pre–Baby Boomers (born before 1946), Baby Boomers (born between 1946 and 1964), Generation X (born between 1965 and 1980), Millennials (born between 1981 and 1996), and Generation Z (born after 1996).
The most obvious finding revealed by Figure 1 is that bisexual identification has become more prevalent with each generation. It has become particularly prevalent among Generation Z, 16.6 per cent of whom identify as bisexual. Generation Z respondents have also become more likely to answer “Other” and “Don't know.” “Homosexual” (gay/lesbian) identity, on the other hand, has increased more gradually. This Canadian data is congruent with recent polling from the United States, which shows heterosexual identification is decreasing among younger generations (Morales, Reference Morales2021; Schmidt, Reference Schmidt2021).
Figure 2 shows distributions of sexual orientation by generation among respondents who identify as men and women. The first panel shows that identifying as “homosexual” increased with Generation X men but that it has remained stable since then. Bisexual identification, on the other hand, has increased with every generation, particularly among Millennials and Generation Z. Among Generation Z men, 7.5 per cent identify as bisexual. Generation Z men are also more likely to answer that they don't know and to answer “Other.” The second panel shows that among women, lesbian identification has increased gradually. However, the most striking finding is that younger women are clearly more likely to identify as bisexual. Among Generation Z women, 22.6 per cent identify as bisexual. “Other” and “Don't know” responses have also become more common among Generation Z women.

Figure 2. Per Cent of Each Gender with Non-heterosexual Identities. The figures show that bisexual identity has increased the most among women.
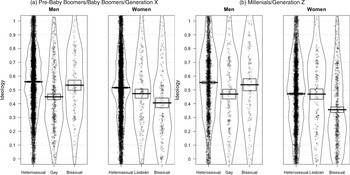
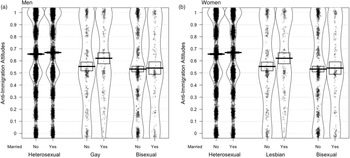
We next consider LGB respondents’ political preferences. We present the ideological and anti-immigration scales of each group using pirate plots (Phillips, Reference Phillips2018), which show jittered raw data points, the mean, along with 95 per cent confidence intervals, and the density. Pirate plots are an effective means of presenting the relationship between two variables, by showing the distributions of a continuous variable across the categories of a categorical variable (or variables). What is most distinctive about pirate plots is that they include a “bean” around the data points (similar to a violin plot). The bean shows the distribution of the continuous variable in each category. Figure 3(a) shows the ideological positions of men and women who identify as heterosexual, gay and bisexual. As we can see, among men, gay voters are on average 0.10 points to the left of heterosexual men on the ideology scale (from 0 to 1), while bisexual men on average are only 0.01 points to the left of heterosexual men. Moreover, gay men are clearly concentrated left of centre, whereas bisexual men are more evenly spread over the scale. The gaps between heterosexual and bisexual men, on the one hand, and gay men, on the other hand, are both significant at the 0.05 level. However, the gap between heterosexual and bisexual men is not.

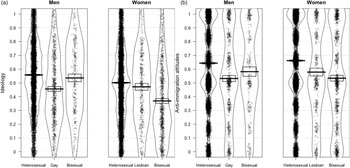
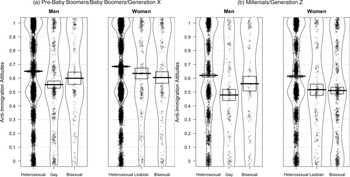
Figure 3. Policy Positions by Sexual Orientation and Gender. The figures are pirate plots of the policy preferences of respondents by gender and LGB sexual orientation. They show (a) ideological positions and (b) anti-immigration attitudes. Pirate plots show jittered data points, means and 95 per cent confidence intervals, as well as “beans” showing the distribution of the policy variables in each category.
Like men, non-heterosexual women are to the left of heterosexual women, although the pattern is slightly different among women. Lesbian women are on average 0.02 points to the left of heterosexual women, while bisexual women are 0.12 points to the left of heterosexual women. The gaps between bisexual and heterosexual women and between bisexual and lesbian women are significant at the 0.05 level. The gap between lesbian women and heterosexual women voters is not significant. Moreover, while lesbian women are relatively evenly spread out over the ideological scale, bisexual women are clearly concentrated on the left. Bisexual women are 0.07 points to the left of gay men. This significant gap makes bisexual women the most left-wing group of all. The finding that bisexual men are less distinct from heterosexual men than gay men is consistent with prior research from the United States (Herek et al., Reference Herek, Norton, Allen and Sims2010; Lewis et al., Reference Lewis, Rogers and Sherrill2011). The larger gap between bisexual and heterosexual women than between lesbian and heterosexual women in Canada is contrary to existing US research.
Figure 3(b) shows anti-immigration scores by sexual orientation and gender. Recall that higher values on the anti-immigration scale reflect more right-wing (that is, more anti-immigrant) positions. The results show that gay men (along with bisexual women) are the most open to immigration. On average, gay men score 0.12 points lower on anti-immigration attitudes than do heterosexual men. On average, bisexual men score only 0.06 points lower than heterosexual men on this scale. Both these differences, as well as the 0.06-point difference between gay and bisexual men, are significant. Nonetheless, although they are the group that is most supportive of immigration, gay men are largely concentrated toward the centre of the immigration scale.
Among women, lesbian women score 0.08 points lower than heterosexual women and bisexual women score 0.12 points lower than heterosexual women on the anti-immigration scale. Both of these gaps, as well as the 0.04-point gap between lesbian and bisexual voters, are significant. Bisexual women are statistically indistinguishable from gay men on the immigration scale. Among men, gay men have the most left-wing preferences on both ideology and immigration. Among women, bisexual voters are the most left-wing on both ideology and immigration.
So far, our findings are broadly similar to research showing LGB voters are distinctively left-leaning in Canada and elsewhere. However, what is new is our consideration of differences between gay, lesbian and bisexual voters. Particularly interesting is the finding that the most common LGB identity group among recent generations, bisexual women, is the most ideologically left-wing. The association between bisexuality and left-wing politics is a descriptive finding; we are not making causal claims that bisexuality “causes” left-leaning political views. It is likely that left-leaning women are the most likely to take up their bisexual identities (see Egan, Reference Egan2008). While bisexual women are the most ideologically left-wing, they are tied with gay men on immigration. This shows important variation between left-right ideology and a socio-cultural policy issue.
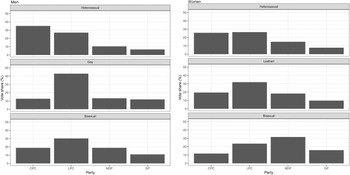
Figure 4 shows vote choice by sexual orientation among men and women. The first panel shows results for men, focusing on the four largest national parties. The most obvious pattern is that both gay and bisexual men overwhelmingly reject the Conservative Party, which is the plurality party among heterosexual men. Among gay men, the Liberals clearly dominate. The same is true among bisexual men, although the NDP gets its highest support among men from bisexual voters. Green support is nearly twice as high among gay and bisexual men than among heterosexual men. Bloc Québécois (BQ) support is about twice as high among gay men as among heterosexual and bisexual men (not shown).

Figure 4. Vote Choice by Sexual Orientation and Gender.
The second panel shows results for women. Lesbian and bisexual women also reject the Conservative Party, although lesbian women do so less than bisexual women. The Liberal Party is also dominant among lesbian women. Among bisexual women, the NDP is the dominant party. The Green Party also does best among bisexual women. Interestingly though, support for the BQ is about half as strong among bisexual women as it is among heterosexual and lesbian women (not shown).
To test these differences, we run a multinomial logistic regression of vote choice on Bisexual and Gay/Lesbian dummy variables, thus leaving heterosexuals as the reference category.Footnote 4 For the outcome, vote choice, voting Liberal is the reference category. We run separate models for men and for women. The model considers support for the Conservative Party of Canada (CPC), the NDP, the BQ, the Green Party and the Liberal Party of Canada (LPC, which is the reference category). Table 1 presents the multinomial logistic regression coefficients. The first model is limited to men and the second to women. The results confirm that both men and women who are bisexual and gay/lesbian are significantly less supportive of the Conservatives compared to the Liberals, as shown by the negative and significant coefficients on the gay/lesbian and bisexual dummies on support for the CPC in the models for both men and women. Strikingly, the difference in support between gay and heterosexual men is nearly three times larger than the gap between lesbian and heterosexual women. Converting the coefficients to differences in probabilities, we find a difference of 0.27 points for men and of 0.11 points for women. The greater difference for men than for women likely reflects the greater appeal of the Conservatives to heterosexual men than to heterosexual women. The positive coefficient on the Bisexual dummy in the first model on the NDP outcome shows that bisexual men are significantly more likely to support the NDP relative to the Liberals. The same is not true for the BQ or the Green Party, as shown by the smaller and non-significant coefficients on the Bisexual dummy for those two parties. For gay men, the only significant result is that they are less supportive of the Conservatives relative to the Liberals.
Table 1. Vote Choice Models

Note: This table shows coefficients from multinomial logistic regressions of vote choice for each of the five major parties regressed on dummy variables distinguishing gays/lesbians and bisexuals from heterosexuals. The Liberal Party is the reference category. Standard errors in parentheses.
*** p < 0.001; ** p < 0.01; *p < 0.05
The second model also confirms that bisexual women are significantly more supportive of both the NDP and the Green Party, as shown by the positive and significant coefficients on the bisexual dummies for those parties. The significant coefficient on the Bisexual dummy variable for the BQ outcome shows that bisexual voters are less likely to support that party relative to the Liberals. These models do not include controls, because they aim to test gaps across groups and not to make a causal claim. Interested readers can find models with controls in the online appendix. Results are similar.
Are Gaps in Political Attitudes between LGB and Heterosexual Voters Smaller in More Recent Generations?
Given the increased tolerance of sexual minorities and the increased recognition of same-sex rights, we expect more recent generations of LGB individuals—namely, Millennials and Generation Z—to have preferences that are more similar to heterosexuals. Figure 5 shows pirate plots of ideology by gender and sexual orientation separately for people born before 1981 (Pre–Baby Boomers, Baby Boomers, Generation X, Millennials, Generation Z) and those born after 1981 (Millennials or Generation Z). It shows that the pattern among men is essentially the same for the earlier and more recent generations, except that gay men are less concentrated on the left and bisexual men are more concentrated on the right among recent generations, as seen by comparing the beans in the plot, which show the distribution of respondents across the range of the ideology scale. Among women, the pattern is different. While bisexual women have moved more to the left, heterosexual women have also moved to the left, thus catching up to lesbian women. Figure 6 shows results for the anti-immigration scale. While the gaps between sexual orientation groups have remained relatively constant, within each sexual orientation category, the more recent generations are more open to immigration than older generations (all changes, except the change among bisexual men, are significant).
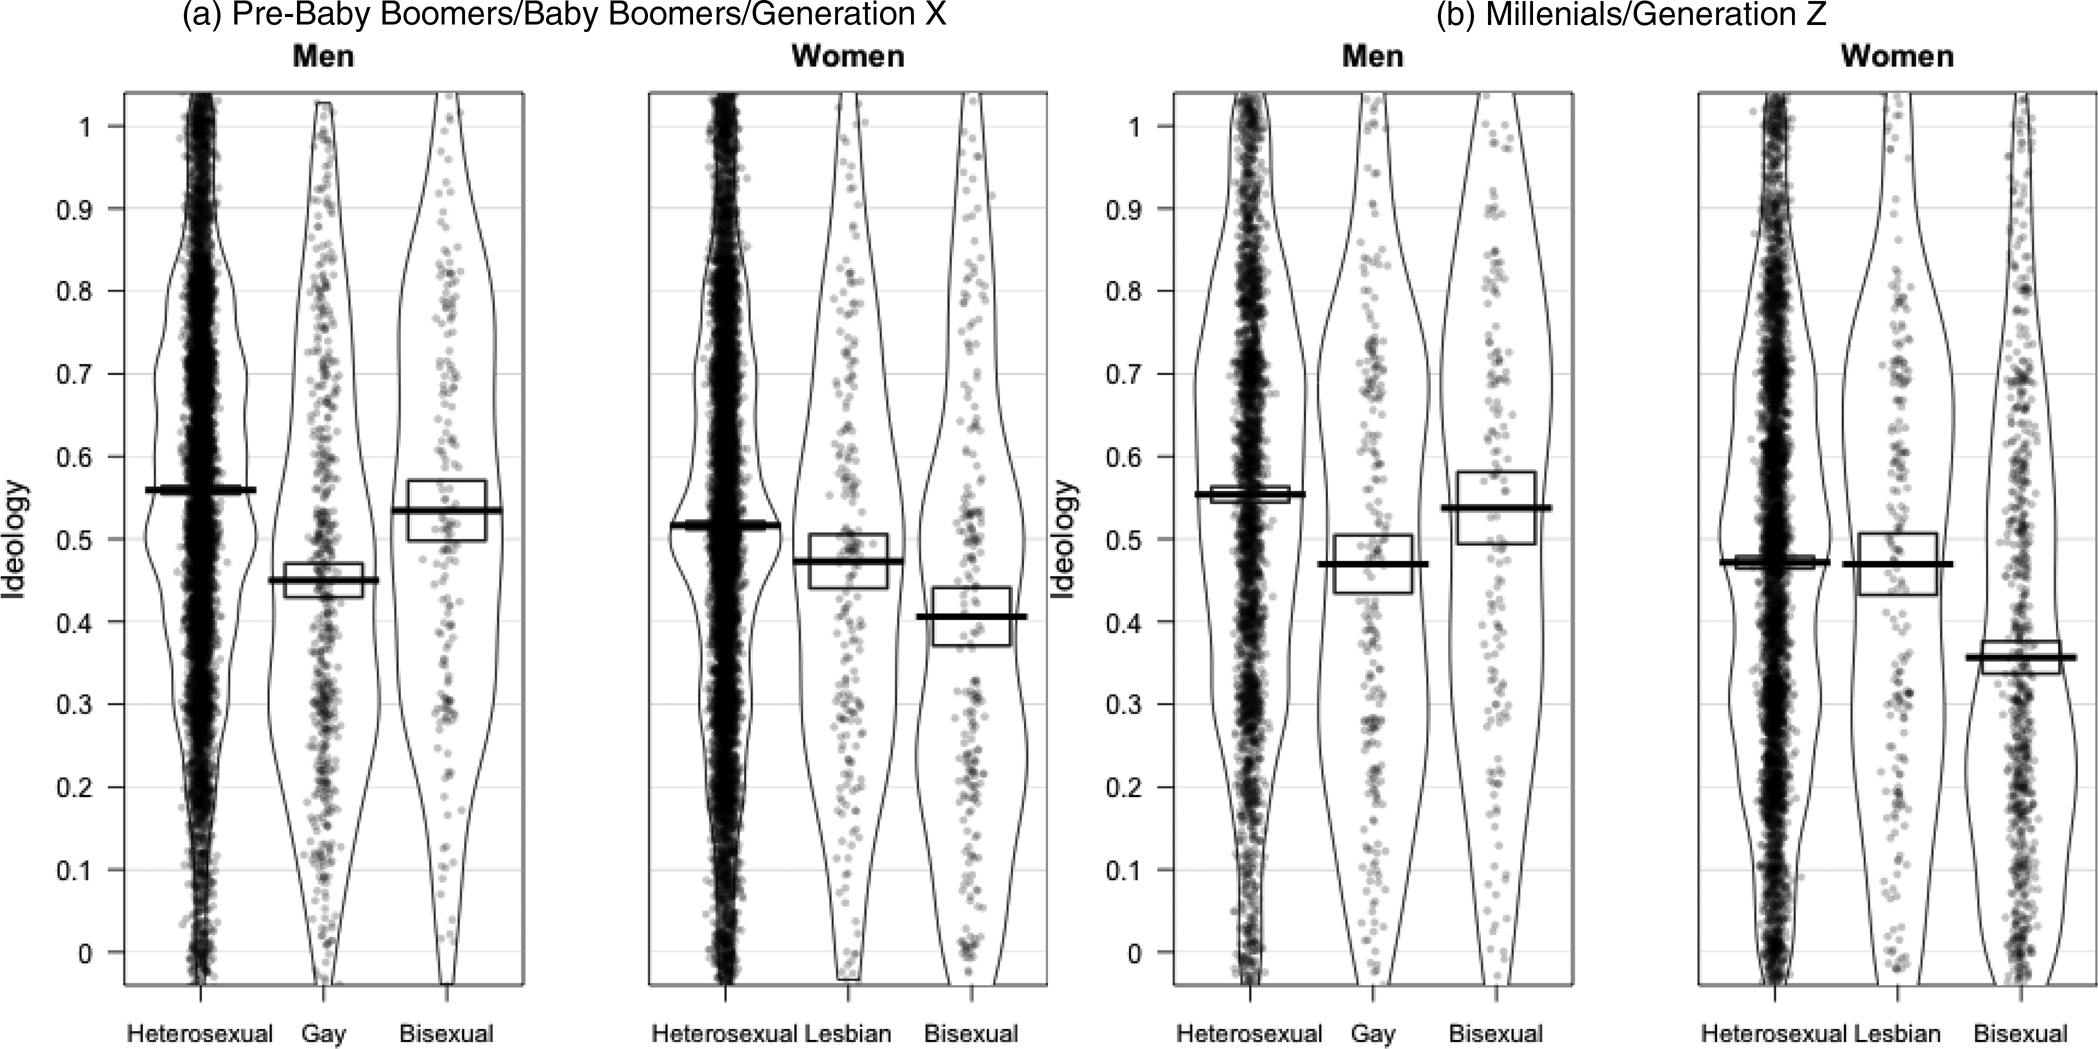
Figure 5. Gaps in Ideology by Generation. These pirate plots show that gaps in ideological positions largely persist across generations.

Figure 6. Gaps in Anti-immigration Attitudes by Generation. The pirate plots show that gaps in immigration preferences persist in recent generations, although most groups have become more pro-immigration.
To consider these generational differences in a more systematic way, Table 2 shows regressions of ideology and anti-immigration attitudes on sexual orientation (a three-category variable, where heterosexual is the reference category), a dummy variable indicating the more recent generation (Millennials and Generation Z, where the earlier generations constitute the reference category), and interactions between the two. These models do not include controls, because our goal is not to make causal claims. However, we present results with controls in Table 2 of the online appendix for interested readers. The coefficients of interest are those on the interaction between the Millennials/Generation Z dummy and the Gay, Lesbian and Bisexual dummy variables, showing how generational changes differ between those sexual orientation groups and heterosexuals. As we can see, none of the interaction coefficients are significant for ideology for either men or women, meaning that ideological gaps are constant across generations. Three of the interaction coefficients are significant and negative for the anti-immigration scale, meaning that gay men and both lesbian and bisexual women moved more in the direction of greater acceptance of immigration than their heterosexual counterparts. However, the coefficient on the Millennials/Generation Z dummy, representing the change among heterosexuals, is also negative and significant for both men and women. Thus, though non-heterosexuals shifted in a more pro-immigration direction across generations, their heterosexual counterparts also shifted in the same direction across generations. In other words, while both LGB and heterosexual voters have become more tolerant of immigration among younger generations, younger LGB voters have moved more in that direction.
Table 2. Models of Political Attitudes by Sexual Orientation and Generation

Note: These are coefficients from ordinary least squares (OLS) regressions of ideology and anti-immigration attitudes on dummies distinguishing gays/lesbians and bisexuals from heterosexuals as well as a dummy for Millennial and Generation Z respondents as well as interactions between that dummy and the sexual orientation dummies. Heterosexuals are the reference category. They show that gaps in preferences are largely stable across generations. Standard errors in parentheses.
*p < 0.05
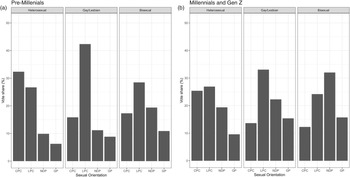
We next assess whether gaps in vote choice have changed across generations. Figure 7 shows the distributions of vote choice broken down by generation and sexual orientation for men and for women. It shows most notably that heterosexual men from the more recent generations are less supportive of the Conservatives and more supportive of the NDP than heterosexual men from the earlier generations. Gay men from the more recent generations are less supportive of the Liberals and more supportive of the NDP and the Green Party. Finally, bisexual men from the more recent generations are less supportive of the Conservatives and the BQ (not shown) and more supportive of the Green Party and, to a lesser extent, of the NDP. In spite of these changes, however, heterosexuals continue to support the Conservatives far more than do non-heterosexuals, who continue to more strongly support one of the left-of-centre parties.

Figure 7. Vote Choice Gaps by Generation. The figures show the percentages of respondents supporting each party by gender, sexual orientation, and generation. They show that, despite the increased support for the NDP and lower support for the Conservatives in more recent generations, gaps between LGB and heterosexuals are largely stable across generations.
Among women, the clearest change is the rise in support for the NDP in all sexual orientation categories, at the expense of both the Liberals and the Conservatives. Nevertheless, bisexual voters continue to support left-of-centre parties more than heterosexual voters do. The same is less true of lesbian voters. In short, LGB voters of more recent generations continue to be averse to the Conservative Party and to have a preference for parties that are left of centre.
Overall, these results show that sexuality gaps between heterosexuals and different groups within the LGB community have remained broadly consistent across generations. The next section shows that one reason overall gaps between the LGB collectivity and heterosexuals have remained stable despite the increased proportion of bisexual voters, especially among women (who are particularly left-wing), is that marriage makes LGB individuals more conservative.
Marriage and Sexual Orientation Gaps in Political Attitudes
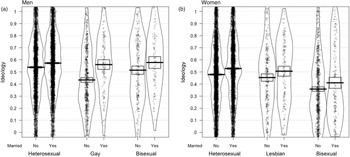
Our second expectation was that marriage, by reducing LGB people's exposure to the wider LGB community, should make LGB people less distinct from heterosexuals. Figure 8(a) shows ideology by sexual orientation and marital status among men. Among unmarried men, gay men are clearly (by 0.10 points) to the left of heterosexual and also bisexual men (by 0.10 points). However, gay men who are married are 0.12 points more ideologically right-wing than unmarried gay men, reducing the size of the sexuality gap (the difference between married gay men and married heterosexuals) to 0.02 points, which fails to pass conventional significance thresholds. Married bisexual men are also slightly more right-wing (by 0.05 points) than unmarried bisexual men. Nevertheless, the gap between bisexual and heterosexual men fails to reach statistical significance among either unmarried or married men.

Figure 8. Ideology Gaps by Marital Status. The pirate plots show that married people in each gender-sexual orientation category are more right-wing than their unmarried counterparts. The gap between gays and heterosexuals is smaller among those who are married.
Figure 8(b) shows results for ideology among women. The ideology gap between each LGB category and heterosexual women is essentially unchanged. Married women in each sexual orientation category are 0.04 to 0.05 points more ideologically right-wing than unmarried women in the same category.
Figure 9(a) shows immigration preferences among married and unmarried men. The first panel shows that gaps between sexual orientation groups are smaller among married than unmarried men. Married heterosexual men express immigration attitudes similar to unmarried heterosexual men, while married gay men express more anti-immigration attitudes than do unmarried gay men.

Figure 9. Anti-immigration Attitude Gaps by Marital Status. The pirate plots show that the gaps in preferences between gays and lesbians, on the one hand, and their heterosexual counterparts, on the other, are narrower among people who are married than among the unmarried.
Figure 9(b) shows immigration preference gaps among married and unmarried women. The gap between lesbians’ and heterosexuals’ preferences on immigration disappears among married women compared to unmarried women. Married lesbian women are considerably more anti-immigration than unmarried lesbian women. The gap between bisexual and heterosexual women is about as large among married women as among unmarried women.
We saw that gaps between heterosexual and LGB respondents are narrower on policy outcomes among voters who are married. Are these differences causal? To test that possibility, we match married to unmarried respondents with each combination of gender and LGB sexual orientation using one-to-one nearest-neighbour matching (see section 5 of the online appendix for details). Standard errors are clustered at the matched-pair level (Abadie and Spiess, Reference Abadie and Spiess2021). Figure 10 shows the coefficients on the Marriage dummy from an ordinary least squares (OLS) model of ideology on that dummy and the other demographic controls for each group (after matching). As we can see, the strongest marriage finding for ideology appears to be causal. Marriage appears to move gay men one point to the right on ideology. It also moves heterosexual men and women to the right, although considerably less so. None of the other coefficients are significant.
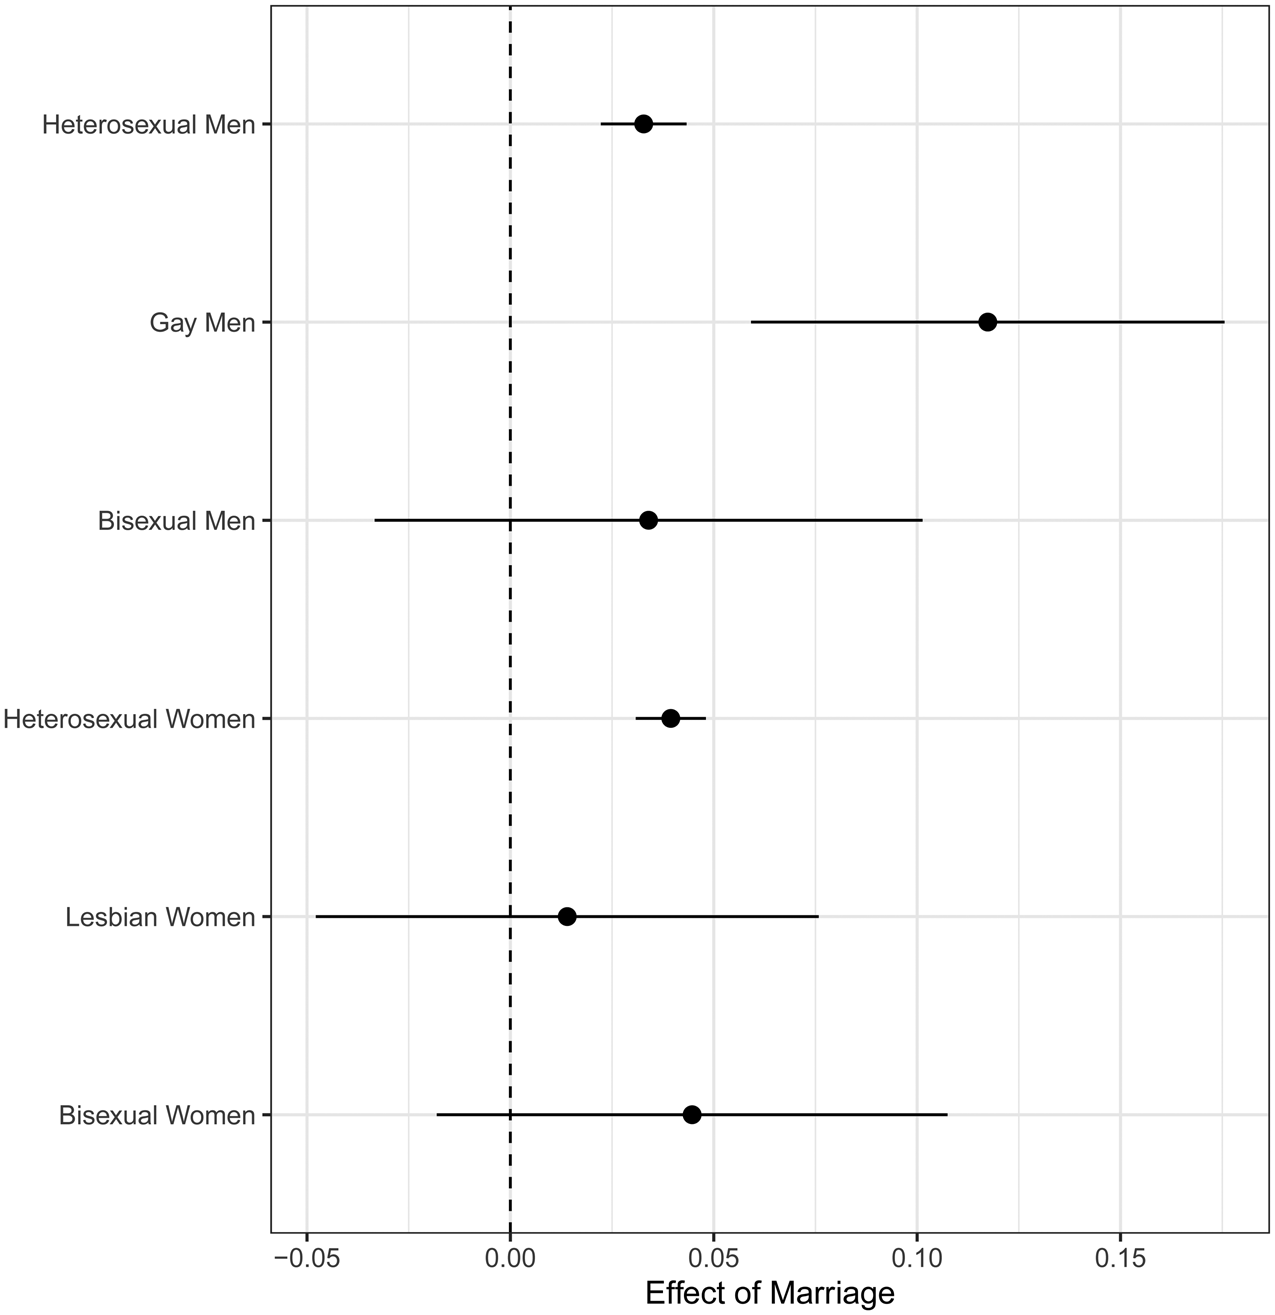
Figure 10. Effects of Marriage on Ideology. These are coefficients from OLS regressions of ideological positions on a dummy variable indicating marriage for each gender by sexual orientation category as well as pre-treatment demographic controls. The data is pre-processed using one-to-one nearest-neighbour matching. The figure shows that marriage narrows the gap between the preferences of heterosexual and gay men.
The finding that marriage moves heterosexual men and women to the right is consistent with prior work showing that marriage makes people more conservative (see, for example, Wilson and Lusztig, Reference Wilson and Lusztig2004). The greater effect among gay men supports our expectation that marriage reduces LGB people's exposure to the LGB community and thus reduces the influence of that collectivity on their political attitudes. This effect is similar in magnitude to the gaps in vote choice found by Wilson and Lusztig (Reference Wilson and Lusztig2004) in their study of marriage and voting in Canada.
Figure 11 shows the coefficients on the Marriage dummy from an OLS model of the anti-immigration scale on that dummy and the other demographic controls for each group (after matching). Marriage appears to make heterosexual men more supportive of immigration. It also might make gay men and lesbian women more conservative on immigration, although these effects just miss the 0.05 significance threshold. Together these effects reduce the gap between gay and heterosexual men and close the gap between lesbian and heterosexual women. None of the other coefficients are significant.

Figure 11. Effects of Marriage on Anti-immigration Attitudes. These are coefficients from OLS regressions of anti-immigration attitudes on a dummy variable indicating marriage for each gender by sexual orientation category as well as pre-treatment demographic controls. The data is pre-processed using one-to-one nearest-neighbour matching. The figure shows that marriage narrows the gap between the preferences of heterosexuals, on the one hand, and gays and lesbians, on the other hand.
Some readers may be surprised to see that marriage influences immigration attitudes. Immigration appears orthogonal to LGB issues, and some scholars have found that immigration attitudes appear to be stable over time (Kustov et al., Reference Kustov, Laaker and Reller2021). However, the mechanisms accounting for LGB distinctiveness other than the group rights mechanism should influence political attitudes on dimensions that relate to gay rights and on dimensions that do not. In fact, previous research shows that LGB voters are distinct on multiple dimensions, including immigration (see, for example, Turnbull-Dugarte, Reference Turnbull-Dugarte2020b). Moreover, recent research does find that immigration attitudes are malleable and respond to short-term forces (Enns and Jardina, Reference Enns and Jardina2021; Kalla and Broockman, Reference Kalla and Broockman2020). Thus, it should not be surprising that a major life event such as marriage can influence immigration attitudes.
While our matching analyses rule out potential confounders (for example, people in rural areas are more likely to get married and are more conservative regardless of sexual orientation), it cannot rule out reverse causality (for example, LGB individuals who are more conservative are more likely to get married). While this is a possibility, given that same-sex marriage was pursued by the NDP and Liberals and initially opposed by the Conservatives, it seems unlikely. It is, nonetheless, possible that the most radical members of the LGB community—who may perceive the institution of marriage as assimilatory and heteronormative (Hopkins et al., Reference Hopkins, Sorensen and Taylor2013; Baumgartner, Reference Baumgartner2013)—refuse to get married, thus moving married LGB individuals toward the centre. However, even if that does occur, we would only expect it to affect people with the most radical attitudes.
Figure 12 shows the distributions of vote choice by marital status and sexual orientation for men and women. The most obvious difference between married and unmarried men is that support for the Conservatives is dramatically higher among married men of all sexual orientations. Differences between married and unmarried men vary across sexual orientations: the gap in voting Conservative is greatest for bisexual men (13 percentage points), followed by gay men (11 percentage points) and smallest for heterosexuals (9 percentage points). Given the greater difference for LGB voters, gaps in support for the Conservatives between bisexual and gay men, on the one hand, and heterosexual men, on the other, are smaller among married men. Gaps in support for other parties across sexual orientations remain fairly similar between married and unmarried men, except that bisexual and gay married men support the Green Party considerably less than do unmarried men, thus narrowing the gap in support for that party between LGB and heterosexual men.

Figure 12. Vote Choice by Marital Status. The figures show that married voters in most categories are more supportive of the Conservatives and, in some cases, less supportive of left-of-centre parties.
Among women, married heterosexual and lesbian women are more supportive of the Conservatives than are their unmarried counterparts. However, married bisexual women are not much more favourable toward the Conservatives than are unmarried bisexual women. Thus, the gap in support for the Conservatives among heterosexual and bisexual women is actually wider among women who are married. Support for the Liberals is higher among married lesbian and bisexual women, and support for the NDP is lower in each LGB category among married women. Support for the NDP drops most markedly among married lesbian women, whose support for that party becomes nearly indistinguishable from heterosexual women.
In short, we have found evidence that marriage narrows some of the political preference gaps between LGB voters and heterosexuals. In particular, marriage shifts gay men ideologically to the right and may cause gay men and lesbian women to become less open to immigration. Marriage also appears to narrow some of the gaps in voting preferences. These findings may explain why, despite the increase in the proportion of bisexual women (who are strongly left-leaning), the average sexuality gap in political preferences between LGB voters and heterosexuals has remained stable. Recent generations of LGB voters (Millennials and Generation Z) are, on average, 0.08 points to the left of recent generations of heterosexual voters on the ideological self-placement measure. Earlier generations of LGB voters (Generation X and earlier) are 0.07 points to the left of earlier generations of heterosexual voters on the ideology scale. Considering anti-immigration attitudes, recent generations of LGB voters (Millennials and Generation Z) are, on average, 0.11 points more supportive of immigration as compared to recent generations of heterosexual voters. Earlier generations of LGB voters (Generation X and earlier) are 0.07 points more supportive of immigration as compared to earlier generations of heterosexual voters. Thus, gaps between LGB and heterosexuals are fairly constant between earlier and more recent generations.
Figure 13 confirms the stability in gaps between the political orientations of LGB and non-LGB voters across generations. Comparing LGB and heterosexual voters across generations, we can see that the distributions of vote choice are mostly similar across the two generational groups. Support for the Conservatives is lower and support for the NDP and Green Party is higher in recent generations across all sexual orientation groups. Support for the Liberals is lower among recent generations of LGB people, thus slightly reducing the gap between them and heterosexuals. Overall though, gaps in voting behaviour are largely stable across generations. Gay/lesbian and bisexual voters remain less supportive of the Conservatives and more supportive of parties that are left of centre.

Figure 13. Vote Choice by Sexual Orientation and Generation. The figures show that LGB voters have a similar preference for left-of-centre parties over the Conservatives in both recent and older generations.
Discussion and Conclusion
Our analysis offers an updated look at the nature of LGB political preferences a decade and a half after same-sex marriage was legalized. Congruent with existing research in Canada and elsewhere (for example, Perrella et al., Reference Perrella, Brown and Kay2012; Turnbull-Dugarte, Reference Turnbull-Dugarte2020b), we find that LGB voters are, on average, more left-leaning than heterosexual voters. However, we make a novel contribution by showing that there is considerable heterogeneity across sexual orientation categories and genders, with important differences between gay and lesbian women, and between bisexual men and bisexual women. In particular, we find that bisexual women are the most distinct voter block, identifying as the most left-wing and being strongly supportive of immigration. The same cannot be said about bisexual men, whose political attitudes align more closely with heterosexual men; bisexual men are to the right of gay men on ideology and immigration.
In addition to offering new insight into the distinct political preferences of gay, lesbian and bisexual men and women, our analysis also contributes an updated look at LGB political behaviour in Canada. The youngest respondents in the CES 2019 came of age after most LGB civil rights battles had been won in Canada, as well as during an era of greater tolerance. Our analysis shows that generation does matter, as younger Canadians are less likely than earlier Canadians to adopt a heterosexual identity. This is particularly true among young women. In particular, Generation Z women are far more likely to express a bisexual identity than earlier generations of women (or Generation Z men); just over one in five Generation Z women identify as bisexual. We also find that sexual orientation groups have similar political preferences across generations.
Because more women are bisexual and because bisexual women are the most left-wing group, on average LGB voters should have moved to the left. However, we found that marriage acts as a countervailing force. Using a matching algorithm, we find evidence that marriage decreases the distinctness of lesbian and gay voters’ attitudes, moving gay men to the right and possibly making gay and lesbian women less open to immigration. The net effect is that overall ideologies, immigration preferences and vote choices of LGB voters from the pre-Millennial generation, and from subsequent generations, have remained stable.
The main limitation of our study is that we rely on an online non-probability survey. We recognize that the online CES sample might not perfectly match population distributions. However, the CES is the most important election study in Canada and, given the limited data available to study the LGB population, online samples have been used by other studies of LGB political attitudes (Perrella et al., Reference Perrella, Brown and Kay2012, Reference Perrella, Brown, Kay and Tremblay2019). Furthermore, other surveys from the United States show similar trends with respect to the shrinking number of younger people, particularly members of Gen Z, who identify as heterosexual (Morales, Reference Morales2021; Schmidt, Reference Schmidt2021). Moreover, studies show that although online non-probability samples may produce biased univariate statistics, they tend to produce similar inferences about regression parameters (Stephenson and Crête, Reference Stephenson and Crête2011). More recent research shows that online samples can be less biased than phone surveys (Breton et al., Reference Breton, Cutler, Lachance and Mierke-Zatwarnicki2017). Thus, while there may be biases in the online data we rely on, research on survey mode effects suggests these should be manageable. Moreover, they are the best tools we have to study the attitudes and behaviours of the LGB community.
Another important limitation relates to our analysis of the effects of marriage on gaps in political attitudes. We do our best to rule out confounders by running a matching algorithm. However, we cannot rule out the possibility that more conservative LGB individuals are more likely to get married instead of marriage making people more conservative.
Although we are able to offer a more fine-grained analysis of the LGB vote in Canada, our analysis is still limited by the constraints of existing data. Because the CES 2019 only asked respondents whether they identify as heterosexual, “homosexual”, bisexual, or other, our analysis is largely limited to these categories. Unfortunately, we cannot offer any insight into other sexual identities, including queer, Two-Spirit, asexual or pansexual folk, or those who consider their identities to be fluid, changing or too complicated for neat categorization. Quantitative data analysis requires the use of categories and large samples and thus may not be the best tool to offer insight into the political attitudes of sexual minorities whose very identities defy definitions.
Acknowledgments
The authors acknowledge helpful feedback from Andrea Perrella, Stuart J. Turnbull-Dugarte and three anonymous reviewers.
Supplementary Material
To view supplementary material for this article, please visit https://doi.org/10.1017/S0008423922000026.
Funding
Both authors were funded by Banting Postdoctoral Fellowships while preparing this article.


 Open access