


Introduction
Numerous studies have examined party competition in the American states (Bibby et al. Reference Bibby, Cotter, Gibson, Huckshorn, Gray, Jacob and Vines1983; Ceaser and Saldin Reference Ceaser and Saldin2005; Holbrook and Van Dunk Reference Holbrook and Van Dunk1993; Jewell and Morehouse Reference Jewell and Morehouse2001; Key Reference Key1949; Reference Key1958; Klarner Reference Klarner2013; Ranney Reference Ranney, Jacobs and Vines1976; Van Dunk and Weber Reference Van Dunk and Weber1997). Collectively, scholars have produced more than 9,600 articles and chapters in the last century that use contemporaneous measures of “party competition” to explain variations in welfare (Barrilleaux, Holbrook, and Langer Reference Barrilleaux, Holbrook and Langer2002) and economic policies (Besley, Persson, and Sturm Reference Besley, Persson and Sturm2010), for example, as well as in electoral behaviors such as voter turnout (Flavin and Shufeldt Reference Flavin and Shufeldt2015; Gray Reference Gray1976). Less is known about patterns of party control over long periods of time, including for example the consequences of sustained one party monopolies or how the nationalization of American politics is affecting those patterns. Using the most comprehensive measure to date—including statehouse composition and gubernatorial election outcomes, plus presidential vote share and the proportion of Democrats in each state’s congressional delegation since the New Deal—we explore such patterns here.
Specifically, we use both 1- and 10-year indices for each state between 1936 and 2017 to investigate degrees of shared versus one-party control across the American states.Footnote 1 We look at each state’s most Democratic and most Republican years, as well as its mean score and range across the 80 years for which we have data. We then examine the frequency and duration of one-party dominance, by state and by decade. Although occasionally noted by earlier scholars as common in state politics (e.g., Bullock, Hoffman, and Gaddie Reference Bullock, Hoffman and Gaddie2006; Jewell and Morehouse Reference Jewell and Morehouse2001; Key Reference Key1958; Sorauf and Beck Reference Sorauf and Beck1988) and understood today as a consequence of political polarization (Burke Reference Burke2021), prolonged one-party dominance is a phenomenon that has not been measured as systematically as one might expect. Indeed, our analysis shows that extended periods of one-party monopolies—currently on the uptick—has long been the rule rather than the exception in the American states.
Why Party Competition Matters
Political competition, or the lack of it, is a phenomenon that has both normative and empirical implications. As Diamond and Morlino (Reference Diamond and Morlino2004, 24) argue “(i)n order to be a democracy at all, a political system must have regular, free, and fair electoral competition between different political parties.” Competition is important, according to Key (Reference Key1949), Rossiter (Reference Rossiter1960), Sartori (Reference Sartori1976), and Schattschneider (Reference Schattschneider1942), because a vibrant party system reins in strident single-issue groups, tempers conflict, aggregates disparate interests, and more. It also, according to the American Political Science Association’s Committee on Political Parties in 1950, reduces the likelihood of “a President who exploits skillfully the arts of demagoguery, who uses the whole country as his political backyard, and who does not mind turning into the embodiment of personal government” (quoted in Wattenberg Reference Wattenberg1990, 129).
These concerns are borne out in contemporary empirical analyses. For example, a lack of competition reduces government efficiency, as legislators carry water for district-level interests rather than attending to statewide needs (Kousser and Gamm Reference Kousser and Gamm2010) or, conversely, neglect education and transportation policy in favor of “position taking” on hot-button topics salient to narrow electorates (Burke Reference Burke2021). It also increases the likelihood of straight-ticket voting (Abramowitz and Webster Reference Abramowitz and Webster2016; Rogers Reference Rogers2016) and ideologically extreme nominees (Kujala Reference Kujala2020), which in turn diminishes bipartisan cooperation (Hare and Poole Reference Hare and Poole2014). States with more competitive environments also spend more on welfare programs than do less competitive states (Barrilleaux, Holbrook, and Langer Reference Barrilleaux, Holbrook and Langer2002; see also however Terry Reference Terry2016) and are more amenable both to institutional reform (Baldez Reference Baldez2004; Biggers and Hanmer Reference Biggers and Hanmer2017; Hicks et al. Reference Hicks, McKee, Sellers and Smith2015) and intergovernmental cooperation, even on high-stakes policies like the Affordable Care Act (Meyer-Gutbrod Reference Meyer-Gutbrod2020). Since higher levels of voter turnout are the result of greater levels of competition and efficacy (Flavin and Shufeldt Reference Flavin and Shufeldt2015; Reference Flavin and Shufeldt2016), greater competition also results in improved representation for those of lower socioeconomic status (Holbrook and Van Dunk Reference Holbrook and Van Dunk1993). In short, a competitive party environment facilitates democratic accountability in many forms.
The relationship probably stems from the fact that elected representatives in more competitive areas are at greater risk of electoral defeat and thus more responsive to the demands of constituents or to the party organizations on which vulnerable incumbents rely (e.g., Holbrook and Van Dunk Reference Holbrook and Van Dunk1993; Stucky, Heimer, and Lang Reference Stucky, Heimer and Lang2005). That would explain why Coffey (Reference Coffey, Green and Coffey2007), Hinchliffe and Lee (Reference Hinchliffe and Lee2016), and Jenkins (Reference Jenkins2006) uncovered significant relationships between high levels of state legislative competition and more clearly differentiated party platforms and roll calls.Footnote 2 Perceived electoral vulnerability also sharpens a winning party’s focus on procedural advantage, for example, the relationship uncovered by Biggers and Hanmer (Reference Biggers and Hanmer2017) between the adoption of stricter voter ID policies and new Republican majorities, in particular.
If a competitive party system has both theoretical and observable consequences, how should observers classify degrees of party control and determine whether a system provides “meaningful competition” between alternatives? The answer, as Sorauf and Beck (Reference Sorauf and Beck1988) succinctly note, “is hardly straightforward” (40). In the next section, we discuss how scholars have measured party control in the American states, and the data collection challenge of keeping such measures current.
Measuring Party Control in the United States
One of the most important voices in state party politics was V.O. Key, Jr. whose classic Southern Politics in State and Nation (Key Reference Key1949) sparked lasting interest in the presence—or absence—of party competition at the state level. Key argued that the lack of party competition across the American South not only suppressed African American participation but produced a unified bloc in Congress that obstructed federal intervention. Although Southern Politics still richly informs our understanding of that region’s policies and practices, Key did not provide an objective standard for identifying “competitive” as compared with “noncompetitive” party systems.
He did proffer ideas for measuring the concept in his other seminal work, Politics, Parties and Pressure Group. These included the number of years between 1929 and 1956 that Democrats occupied the governor’s post and the average proportion of the lower house held by Democrats between 1924 and 1956. In the first case, the categories were all 28 years, 19–27 years, 14–18 years, 7–13 years, or 6 or fewer years, with no one category containing fewer than seven states. In the case of state legislative composition, he identified four groups: those consistently achieving “around 90%” on the one end, about 20% on the other, plus two “intermediate groups,” each with an average that “leans” toward one side or the other. Although Key (Reference Key1958) himself called his categorizations crude, his analysis made plain that “one party dominates state government” (312) and invited further exploration. But agreeing on a measurement has proved challenging. As Jewell and Morehouse (Reference Jewell and Morehouse2001) observe, “(d)etermining the level of two-party competition and changing competitive trends for elective offices is an empirical inquiry. Measures of two-party competition differ depending on the offices that are included, the time period chosen, and the method of aggregating the statistics that is used” (28).
Ranney and Kendall (Reference Ranney and Kendall1954) were among the first to put forth a system for classifying party competition in the American states, drawing upon comparative politics to grapple with the operationalization of “competition.” There is a difference, for example, between party competition in the Soviet Union, where forming a second party was illegal, and Mississippi, where “(o)pposition candidates can, and sometimes do, oppose candidates of the dominant party” (478), even as they stand little chance of winning. On the other hand, lumping Mississippi into the same category as Maine (then an historically Republican stronghold) obscures distinctions that may be equally important. “In Maine, to be sure,” they write, “it is a rare thing for a Democratic candidate to be elected. But it is not a rare but rather a usual thing for him to win anywhere from 30–49 per cent of the vote…. In Mississippi, by contrast, the lesser party often does not even put up candidates; and the candidates it does put up poll a mere 5 to 20 percent” (478).
Their subsequent classification is a five-category typology of party competition: (a) a multiparty system, which required a coalition between at least two parties to form a governing block; (b) a two-party system; (c) a modified one-party system where one party typically wins most of the office but another party wins a “substantial” share of the vote; (d) a one-party system where a party wins the vast majority of both the offices and vote; and (e) a totalitarian one-party system. Working with data for 1914 to 1952, Ranney and Kendall categorize a state as having a two-party system when both parties were able to win at least a quarter of a state’s combined presidential, senatorial and gubernatorial elections. The distinction between a modified one-party and a one-party system is that the weaker party would have to have won at least 30% of the vote in 70% of the elections during that period and more than 40% of the vote in at least 30% of the contests. Their effort, like Key’s, is descriptively interesting and possesses strong validity. Replicating it however, particularly for use in the kinds of quantitative, multivariate models about to overtake the field, proved prohibitive.
After other efforts failed to capture a wide following (e.g., Cox Reference Cox1960; David Reference David1972; Schlesinger Reference Schlesinger1955), Ranney (Reference Ranney, Jacobs and Vines1976) introduced a composite measure of party control with staying power. Subsequently referred to as the “Ranney index,” this indicator originally encompassed just 1962–72 and contained four components: “(a) the average percentage of the popular vote won by the Democratic gubernatorial candidates; (b) the average percentage of the seats in the state senate held by the Democrats; (c) the average percentage of the seats in the state house of representatives held by the Democrats; and (d) the percentage of all terms for governor, senate, and house in which the Democrats had control” (468). Built upon earlier efforts, it remains the most widely used measure of interparty competition at the state level.Footnote 3
Ranney’s index is a measure of the cumulative government control exercised by Republicans, by Democrats, or by both simultaneously. His index—achieved by averaging the four components into a single number—yields a score between 0 and 1 for each state. According to Ranney and most of those who have updated his work since, a score of 0.0000 to 0.1499 means a state is “one-party Republican,” a score of 0.1500 to 0.3499 means a state is “modified one-party Republican,” a score of 0.3500 to 0.6499 means the state is a two-party state, a score of 0.6500–0.8499 means a state is “modified one-party Democratic,” and a score of 0.8500 or higher means a state is “one-party Democratic” (Gray Reference Gray1976, 104). Jewell and Morehouse (Reference Jewell and Morehouse2001) establish the “predominant Democratic” and “predominant Republican” cutoffs at 0.6 and 0.4, respectively. Regardless, the closer the index is to 0, the more power the Republicans have in the state, and the closer the index is to 1, the more power the Democrats have in the state. An index of 0.5 signals absolute balance between the two.
Although the Ranney index can tell us a great deal about a particular state’s level of interparty competition relative to its peers, scholars have pointed to several limitations (see, for example, Bibby and Holbrook Reference Bibby, Holbrook, Gray, Hanson and Jacob1999; Brown and Bruce Reference Brown and Bruce2008; Ceaser and Saldin Reference Ceaser and Saldin2005; King Reference King1989). The first is that the index is based solely on state offices and consequently does not capture a party’s strength in the contests for national-level political positions. That is, it does not include a measure of either presidential or congressional voting patterns. Mid-century scholars observed that these contests were too heavily influenced by national factors (see Jewell and Morehouse Reference Jewell and Morehouse2001) to accurately reflect the sentiments of a state’s electorate. An awkward argument even then considering both how such campaigns are conducted and voters’ strong interest in them, the steady nationalization of American politics since the 1980s (Burke Reference Burke2021; Hopkins Reference Hopkins2018; Rogers Reference Rogers2016) exacerbates the problem. Another drawback is that it privileges the office of governor over other statewide partisan offices, such as lieutenant governor and the state attorney general (a problem we do not address). Likewise, it gives more weight to the legislative branch, as three of four components are impacted by the partisan balance of the legislative branch (a problem attended to here by eliminating his peculiar fourth component).
The most troubling critique however has been that the Ranney index captures only a cross-sectional picture of a larger phenomenon. Textbooks (and Ranney himself) characterize the measure as just “a snapshot of an object moving in time,” meaning it considers neither long-term patterns nor in-progress changes (Bibby and Holbrook Reference Bibby, Holbrook, Gray, Hanson and Jacob1999, 106). For example, when a state’s score is reported for just a single year or election cycle and compared to its peers, a state transitioning from noncompetitive to competitive would fall within the same range as a moderately competitive one (King Reference King1989; see also Hershey Reference Hershey2003).Footnote 4 Misleading categorizations like this are endemic to any static measure of party control (see also Ceaser and Saldin Reference Ceaser and Saldin2005; Hinchliffe and Lee Reference Hinchliffe and Lee2016).Footnote 5 We believe our index, which examines the aggregated support in a state’s electorate for each party across multiple institutions and levels of government for a single election cycle or many cycles, strikes a defensible balance between identifying the majority party, capturing the magnitude of that majority, and—most significantly here—monitoring changes over time. It also relies upon the most widely reported measures of party control, making it relatively easy to update for use in future work.
Below, we detail our operationalization of state party control, emphasizing instances of prolonged one-party dominance. We move then to the broad distribution of our party control index, the frequency and duration of one-party dominance, some intriguing variations in the relationship between the state and national components, and a glimpse at the consequences of this phenomenon for the states with the longest-lived monopolies.
Data and Methods: An Expanded Party Control Index
While republican democracies are founded upon a strong, positive relationship between election contests and party control, the two phenomena remain distinct measures of partisan competition. The former examines the average margin of victory between the Republican and the Democrat in state legislative elections, for example, and/or the number of uncontested state legislative seats. The latter is concerned with majorities, that is, with which party posts enough wins to control the levers of power in legislative or executive institutions. Drawing upon the best-known examples of each line of inquiry, Shufeldt and Flavin (Reference Shufeldt and Flavin2012) describe the difference this way: the Ranney index and its descendants measure “competition between parties for control of state government” while Holbrook and Van Dunk (and others) measure “competition between candidates in state elections” (331, emphasis added).Footnote 6 As discussed above, the components, time period, and cutoffs for categorization remain fraught. We sally forth nonetheless.
Party Control Index
We use a Ranney-inspired index we hope others will find useful for the purposes of tracking relative party support in the American states into the future, relying as it does on widely reported election results requiring few additional calculations.Footnote 7 Falling squarely within the party control tradition, it is composed of five parts: the proportion of Democrats in the state senate; the proportion of Democrats in the state house; the proportion of the popular vote for the Democratic candidate for governor; the proportion of Democrats in a state’s federal congressional delegation; and the proportion of the state’s popular vote for the Democratic candidate for president. The last two components introduce elements of nationalization to a state’s partisan score. We do so in part because, as Gibson and Suarez-Cao (Reference Gibson and Suarez-Cao2010) demonstrate, “federalized party systems” are characterized by distinct—and consequential—patterns worthy of careful examination. In the US, for example, the highest-profile outcomes often serve as precursors to down-ballot changes (e.g., Ceaser and Saldin Reference Ceaser and Saldin2005; Jewell and Morehouse Reference Jewell and Morehouse2001) and eventually to the “convergence” of state and national elections (e.g., Hayes and McKee Reference Hayes and McKee2008; Hopkins Reference Hopkins2018; Rogers Reference Rogers2016).
We started the data collection process with Carl Klarner’s “State Partisan Balance Data.” Klarner’s dataset includes state house composition, state senate composition, and gubernatorial election outcomes through 2015.Footnote 8 The data on the proportion of Democrats in each state’s congressional delegation was obtained from the “Statistics of the Presidential and Congressional Election” for each two-year period as provided by the Clerk of the US House of Representatives and cross-compared with the Biographical Directory of the United States Congress for accuracy (Biographical Directory 1774–2018).Footnote 9 , Footnote 10 A value for each component is recorded for each state-year beginning, in most cases, in the late 1930s and ending, in all cases, in 2017. For years in which there was not an election, such as between a senator’s term of six years or a governor’s term of four years, the value remains the same as from the previous election until a new election occurs. Changes in the percentage of Democratic votes for governor and president are noted for the year the election was held, not the year in which the candidate took office.Footnote 11 We then averaged—that is, calculated an index—for each state for each year.
Consistent with Ranney, each index—whether calculated for a single year or at one of the intervals noted above—produces a score between 0.00 and 1.00 for a state. Movement in one direction or the other signals a relative advantage to either the Republicans (if it is lower than 0.5) or the Democrats (if it is higher than 0.5). Whatever its value, each score communicates less about the competitiveness of the typical election than about the likelihood that Democratic versus Republican party elites hold the brand loyalty of voters and/or collective reins of power in that state.
We also calculated an average index for each state’s 4-, 6-, 8-, and 10-year intervals. Shorter intervals reveal wider swings, while longer intervals “smooth” partisan shifts, although variance diminishes across the board in the most recent decades. Connecticut provides a telling example (Figure 1).

Figure 1. Connecticut’s 1, 4, and 10-year indexes.
One of the advantages of this index is the addition of a measure of partisanship for each state’s congressional delegation and votes cast in presidential elections. Specifically, because the traditional Ranney index is based singularly on elections to state-level political institutions, it captures some patterns more successfully than others, specifically voters’ party preference in low- instead of high-profile elections. While this is useful in that it protects the measure from being influenced by national “wave elections” with a short shelf life and also bears a direct connection to state-level policy outputs, the national-level preferences are important.
The transformation of the southern states during the last half of the 20th century provides an obvious example, as most began to “redden” with their national offices, only decades later selecting Republican candidates at the state and local levels (Hayes and McKee Reference Hayes and McKee2008; Hershey Reference Hershey2003). This pattern is not universal, however, as suggested by the series of regional line graphs in Figure 2. Until the 1980s, most state-level partisan shifts outside the South occurred before they materialized nationally. Further, the South is the only region in which state and federal outcomes converge steadily. In the others, wide gaps open in the final decades of the 20th century, closing again with the most recent cycles. In all regions, as mid-20th century scholars anticipated, the national measures make wider swings than the state ones. Still, our state- and national-level components are strongly correlated: the average Cronbach’s alpha score for all state and national indices is 0.87; more than 70% of the states post alphas of 0.7 or higher.
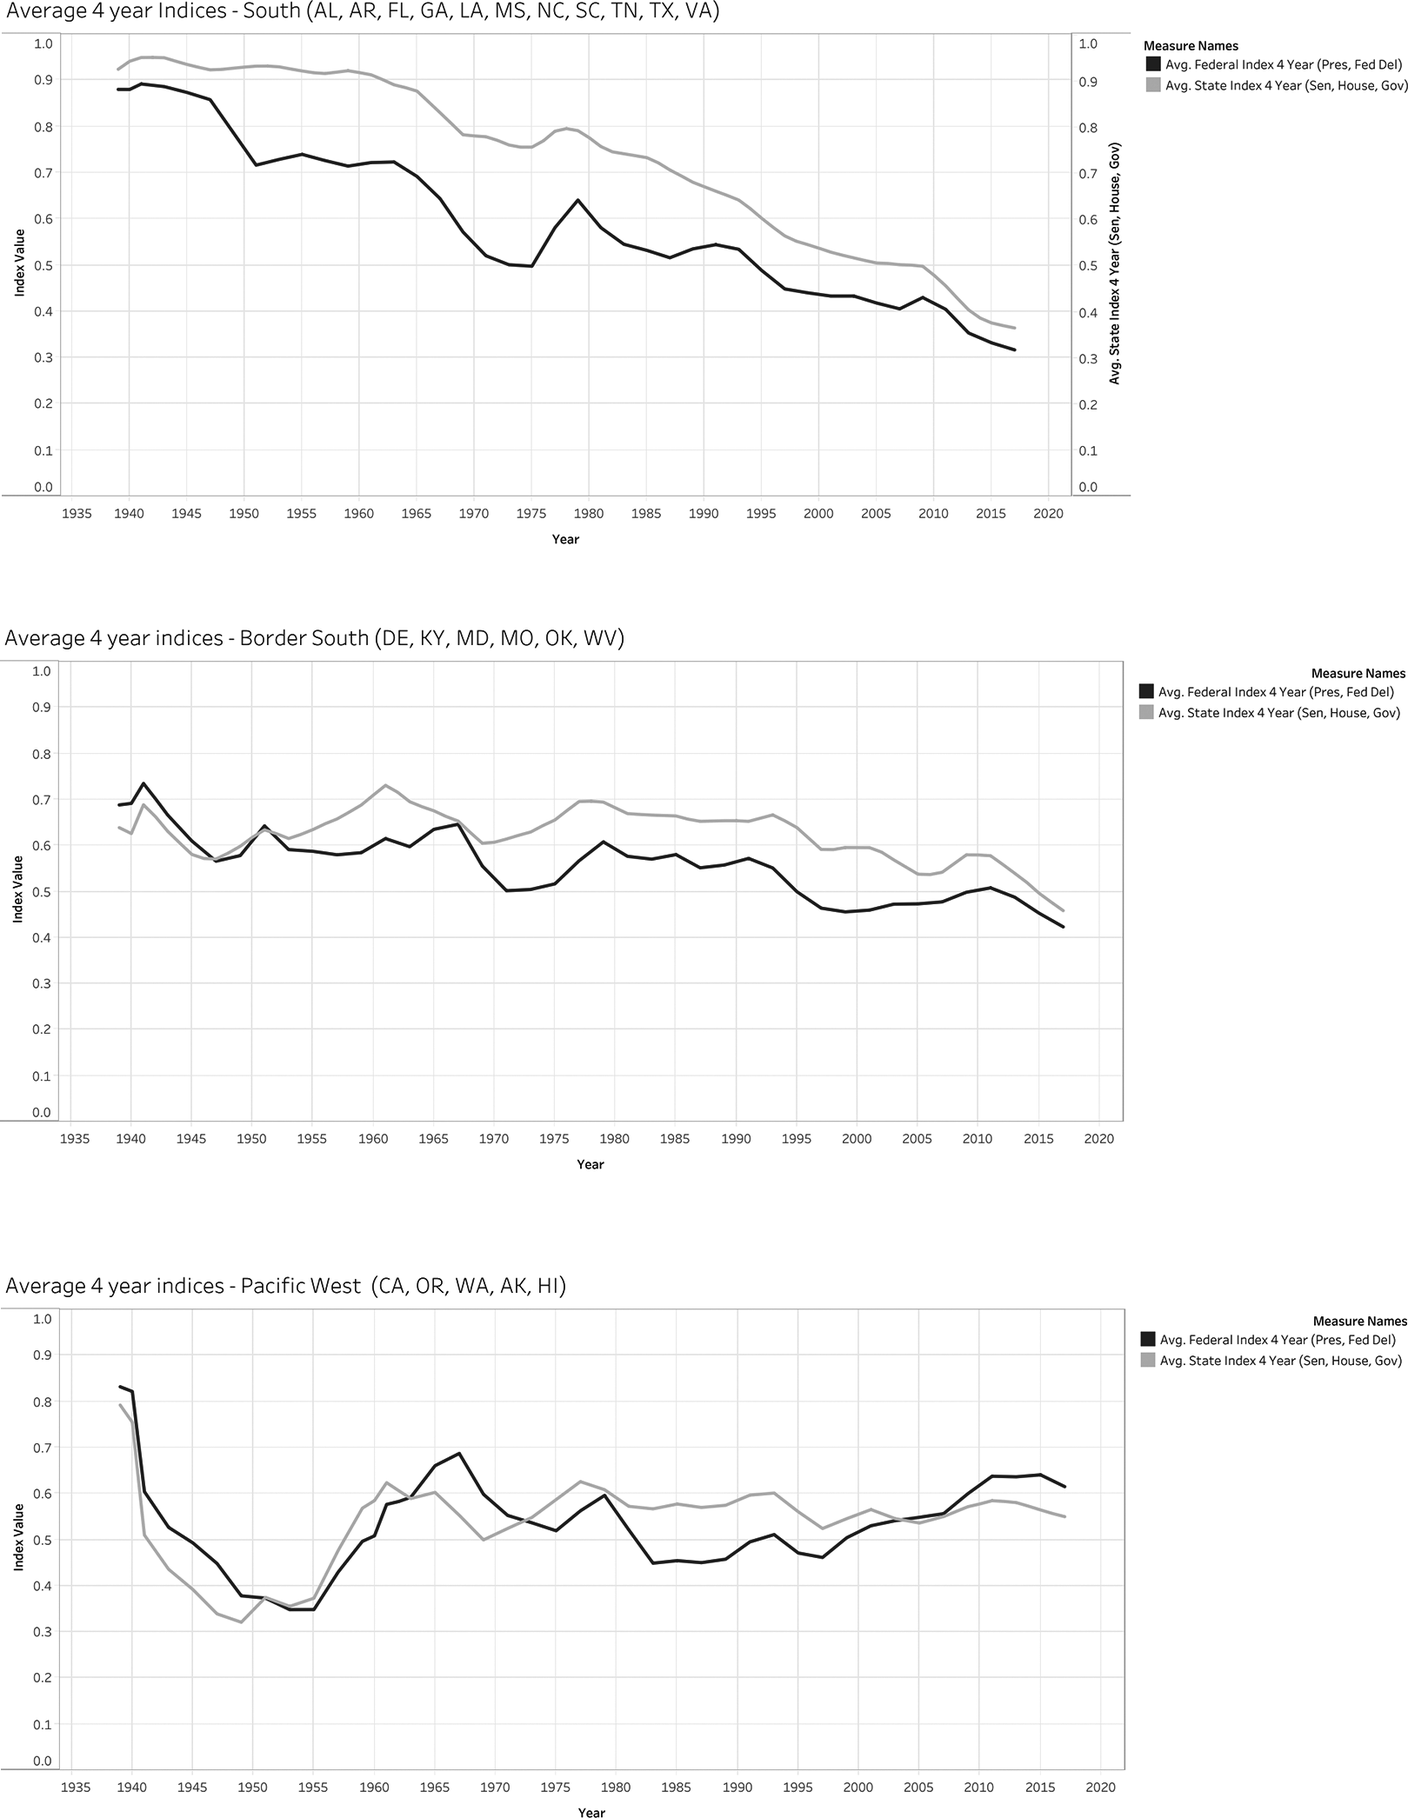
Figure 2. Average federal and state index values by region.

One-Party Dominance
We focus here on the frequency and location of instances of one-party dominance across the American states. If defining “competition” has proved challenging, so has determining what constitutes a pattern of election contests that could be considered “competitive” versus “noncompetitive,” that is, a one-party monopoly versus a two-party rivalry. Is it—as Key (Reference Key1958) loosely posits—the Democrats occupying the governor’s mansion at least 60%, or less than 25%, of a three-decade stretch? Or is it Democratic control of 90% of legislative seats during roughly the same time period? As we noted above, Ranney acolytes—whatever the time period covered—include both offices and rely on thresholds of 0.65 and 0.35 as the cutoffs for one-party monopolies (e.g., Bibby et al. Reference Bibby, Cotter, Gibson, Huckshorn, Gray, Jacob and Vines1983). We were persuaded by Jewell and Morehouse’s (Reference Jewell and Morehouse2001) cleaner threshold for predominance: an index value that is either less than 0.40 (Republican predominance) or greater than 0.60 (Democratic predominance). Moreover, for much of our analysis we followed the lead of comparativists Nwokora and Pelizzo (Reference Nwokora and Pelizzo2014) who generally use a standard of “three consecutive” election victories. In the context of the typical US state, this would amount to an interval of either 6 or 12 years. We settled on 10 because it was most likely to encompass at least two exclusively gubernatorial/state senate elections and two US Senate cycles, together with US House, state house, and presidential contests.
Findings
We begin with the summary statistics of our party control index shown in Table 1. Using the 10-year index, the nationwide mean party control score is just over 0.5, suggesting a broadly competitive subnational partisan landscape during our 80-year period. Indeed, as the first column shows, Kansas, South Dakota, and Wyoming are the only states never to post a “Democratic” value, that is, never to have a 10-year index score greater than 0.5. Conversely, only Hawai’i, Maryland, Rhode Island, and West Virginia never dipped into Republican territory. The “folded” mean (see table footnote) of 0.875 likewise is suggestive of a competitive party landscape in which the usual suspects populate both the least—Arkansas, Louisiana, Georgia, Mississippi, and Alabama—and the most—Pennsylvania, Illinois, Colorado, and Minnesota—competitive slots.
Table 1. Party control index (1930s–2017), summary statistics for the 10-year index
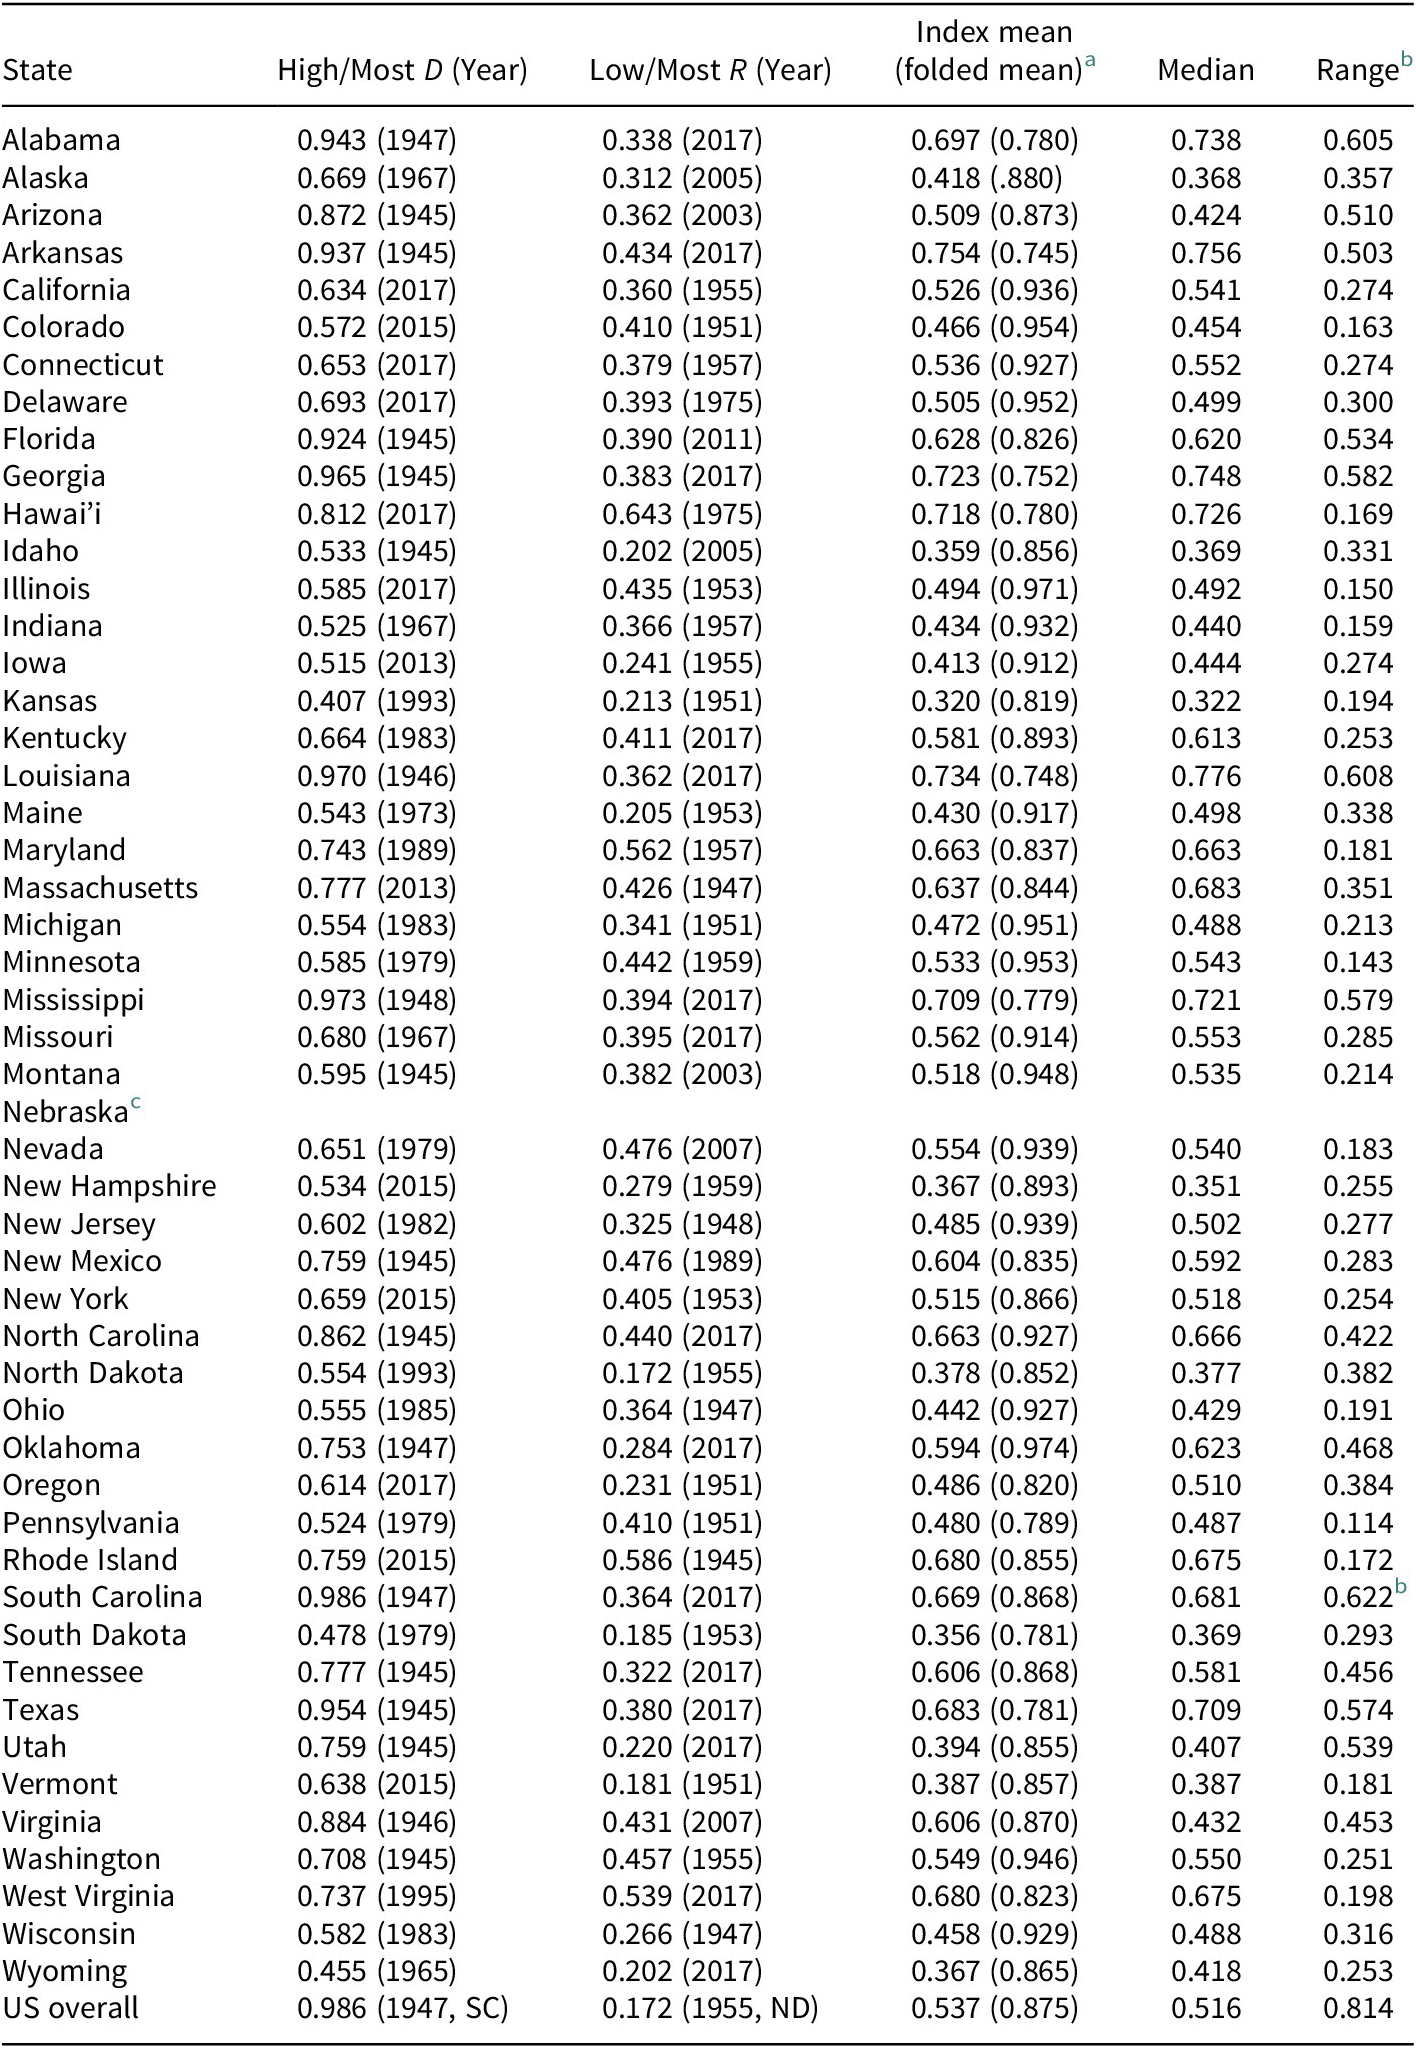
a The folded index is an idea introduced by Ranney to measure competition without regard to whether it favors Democrats or Republicans; it ranges from 1.000 (perfectly competitive) to 0.5000 (no competition). In other words, in the unfolded index neither a 0.9 nor a 0.1 is competitive whereas both a 0.55 and a 0.45 are. By “folding” the index, and subtracting all values from one, the former pair both become 0.6, and the latter become 0.95.
b Using the 10-year index, South Carolina shows the biggest range, followed by—in descending order—Louisiana, Alabama, Georgia, Mississippi, Texas, Utah, Florida, and Arizona. Pennsylvania shows the smallest range, followed by—in ascending order—Minnesota, Illinois, Indiana, Colorado, Hawai’i, Rhode Island, Vermont, and Nevada.
c Nebraska is not calculated because of its nonpartisan legislature.
But signs of the prolonged one-party dominance that Key (Reference Key1958) identified as the state-level norm also are evident right away. On the Democratic side, 32 states exceed 10-year index values of 0.6 at least once during the decades examined.Footnote 12 Although half of such instances have occurred since 1970 and/or in states outside the South, it will come as little surprise that the most Democratic 10-year scores are South Carolina (0.986), Mississippi (0.973), Louisiana (0.970), and Georgia (0.965) in the mid-1940s. What may astonish some however is that domination by the Republican Party is just as common. Indeed, 32 states post 10-year index values of less than 0.4 at some point in our dataset, and a significant portion of those are outside the mid-century northeast. The most stalwart among them are North Dakota (0.172), Vermont (0.181), and South Dakota (0.185), in the 1950s. But Idaho and Wyoming (0.202) in 2005 and 2017, respectively, and Maine (0.205) in 1953 are not to be overlooked.
Overall, Table 1 reveals that half the states post mean 10-year index values of either less than 0.4 (Republican dominant) or greater than 0.6 (Democrat dominant); eight qualify as Republican dominant; 17 as Democrat dominant. The range varies too. A handful of states maintain a relatively steady average, some (e.g., Pennsylvania, Minnesota, and Illinois) sustaining a competitive climate decade after decade, while others (e.g., Rhode Island and Maryland) retain a steadfast allegiance to one party. Most states show great capacity for change however, either swapping one dominant party for another (e.g., the Southern states, but also Oregon and Vermont at mid-century versus today) or becoming either more (e.g., Idaho) or less (e.g., South Dakota) stalwartly one-party at various points.
We turn now to inventorying the frequency and duration of one-party dominance during the 80-year period for which we have data. Maintaining our operationalizations of one-party dominance as a state with an index value of either less than 0.40 or greater than 0.60, we see even more clearly in Tables 2 and 3 that it is neither “a Southern thing” nor a contemporary development. To elaborate, Table 2 captures the total number, and proportion, of all years that each state meets our criteria. Also recorded are the number (and proportion) of times one-party dominance occurs for Democrats as compared with Republicans.
Table 2. Frequency of one-party dominance a in the American states (high to low), 1930s–2017

a One-party dominance is defined as a state with a 10-year index of ≤0.40 or ≥ 0.60. TOTAL is the number of years the state experienced one-party dominance; %s reflect the proportion of the total years the state experienced one-party dominance (overall, and by Democrats and Republicans respectively).
b Nebraska is not calculated because of its nonpartisan legislature.
We are struck by several observations. The first is that fully half of the states can be described as experiencing a state of extended one-party dominance for at half of the period examined. Many in this group are Southern, including West Virginia and Arkansas (with 70 and 68 years of one-party dominance, respectively). Also included, however, are Rhode Island (with 70 years of one-party dominance) and Kansas (with 69 years of one-party dominance). Hawaii, as well, is notable for a 49-year period of Democratic dominance (the entirety of the state’s history). Indeed, the average number of years in which the average American state demonstrates prolonged Republican or Democratic control is 34. Conversely, only four states have resisted total domination by either party: Colorado, Illinois, Minnesota, and Pennsylvania.
With respect to the relative distribution of these one-party periods, both Democrats and Republicans have enjoyed extended runs of party control. The Democrats’ total monopoly on Southern politics during most of the period under study gives them the edge (for now), with the average state experiencing 22 years under their control as compared with just 12 years for Republicans. It is an advantage that will not last, of course, as several Southern states (e.g., Arkansas and Louisiana) finish swapping out their blue stripes for red ones in down-ballot races. A good many states have experienced extended periods of both Democratic and Republican domination, switching from a near-Democratic monopoly to a near-Republican one, or vice versa. Nearly half have done so, including recent Southern realigners like Mississippi and Florida, but also less obvious candidates like Alaska, Arizona, California, Delaware, Montana, New York, Oregon, Utah, Vermont, and Wisconsin.
Table 3 and Figure 3 allow us to explore further the frequency and duration of extended one-party runs in the American states since the New Deal. While Table 1 showed us the number of years a state’s 10-year index reaches our threshold for one-party dominance, Table 3 raises the bar by requiring it sustain a value of less than 0.4 or greater than 0.6 for at least 10 years consecutively. Still, all but nine states meet that criterion. Even more, seven states post one-party-dominant runs of 50 years or longer, with Arkansas taking the top prize at 63 consecutive years. It and the other Southern states lift the total number of Democratic runs to 34, as compared with only 21 for Republicans.
Table 3. “Runs” of one-party dominance a by state, 1930s–2017

a One-party dominance is defined as a 1-year index of ≤0.40 or ≥ 0.60 for at least 10 consecutive years.
b Nebraska is not calculated because of its nonpartisan legislature.

Figure 3. State one-party dominance (1-year index) by decade, 1940–2017.
The particularly high concentration of one-party domination during the mid-twentieth century is made evident in Figure 3. When we examine the one-year index values for every state across our eight decades, roughly 70% of all states experience near monopoly for some—or all—of the 1940s and 1950s, a significant portion of them Republican. The number of state-years reaching our party domination thresholds declines through the early 2000s although at least a third of states have hosted one-party monopolies in any given decade. Perhaps most interestingly, the latest observations (2010–17) show a swift and dramatic rebound in one-party monopolies, particularly by Republicans who—not coincidentally—controlled most of the redistricting levers in 2010 (see McDermott, LeBlanc, and McAvoy Reference McDermott, LeBlanc and McAvoy2019) and again in 2020.
Finally, what consequences should scholars—and citizens—associate with the prolonged one-party monopolies we have observed? As we noted at the outset, past research demonstrates a long list of undemocratic outcomes tied to low levels of election competition. It seems likely these effects would be most pronounced in the states that have experienced the least alteration to party control. That is, in fact, what we find. As captured in Figure 4, voter turnout—the most frequently cited casualty of anemic political competition—has a strong, negative relationship to the proportion of time a state experiences one-party monopoly as does policy liberalism, TANF benefits, and party polarization (not shown). We aim to probe these relationships further in future work, testing them using the state versus national components, for example, as well as their strength at various points in time. Clearly, long-term party monopolies—currently experiencing a dramatic ascendance in a majority of states—will have significant procedural and substantive consequences.

Figure 4. One-party monopoly and voter turnout (2020).
Conclusion
Scholars have been measuring interparty competition in the American states—often using it as a predictor of high- or low-quality governance—for a century. The years covered, offices included, and thresholds for categorization vary, but it remains a concept so ripe for fruitful investigation that we return to it here. We focused on one-party dominance, by state and by decade, a phenomenon that while occasionally noted as common in subnational governance has not been measured as systematically as one might expect. Here, we have documented its remarkable frequency, sustained duration, and recent resurgence over a far longer period than previously examined. We also demonstrated several ways it might be probed further: regional variation—but growing convergence—in the relationship of the state to national components and its strong association with other political phenomena, including voter turnout.
To be sure, any approach to measuring party control in the separated powers, hyperfederated arrangement used in the US will be problematic. Here, we privilege some partisan offices over others (e.g., we ignore other statewide executive officers), conflate units of analysis (i.e., executive vote share vs. legislative seat share), and obscure instances of divided government. (Massachusetts, for example, is among those categorized as a long-time Democratic stronghold, yet it has hosted a string of Republican governors.) We also—to facilitate use by future scholars—fail to account for the effect of minor parties on some election outcomes. Objection could be made, too, to our definition of one-party control, especially the stipulation that it occurs only when a state posts a score of greater than 0.6 or less than 0.4 for a decade or more. While other scholars have used similar decision rules, we agree with Sorauf and Beck (Reference Sorauf and Beck1988) that “(t)here is an unavoidable arbitrariness to any classification” of a concept as multifaceted as this (40).
Still, political scientists return to the measurement and categorization of interparty competition again and again because we know its presence or absence—especially when sustained over many years—has consequences. It not only remains a central cause, and effect, of almost every phenomenon studied by academics, but decades of study—including this work—suggest citizens should brace for substantial changes to the politics and polices in their communities as one-party monopolies resurge in the American states. We hope the robust and easy-to-update party control tool featured here proves useful toward this end.
Supplementary Materials
To view supplementary material for this article, please visit http://doi.org/10.1017/spq.2022.2.
Data Availability Statement
Replication materials are available on SPPQ Dataverse at https://doi.org/10.15139/S3/NAO9CU (Parry Reference Parry2021).
Funding Statement
The authors received no financial support for the research, authorship, and/or publication of this article.
Conflict of Interest
The authors declared no potential conflicts of interest with respect to the research, authorship, and/or publication of this article.
Author Biographies
Janine A. Parry is University Professor of Political Science at the University of Arkansas, Fayetteville. Her research focuses on state politics, voter behavior, and gender, politics, and policy.
Andrew J. Dowdle is professor of Political Science at the University of Arkansas, Fayetteville. His research focuses on state party competition, the presidential nomination process and campaign finance.
Abigail B. Long is a PhD student in the Public Policy Program at the University of Arkansas. Her research focuses on regional food supply chain policy, and related social and economic impacts of such policies.
Jessica R. Kloss is a recent graduate of the University of Arkansas School of Law and a member of the Arkansas bar. Her research focuses on state politics and elections.


 Open access