


Unhealthy diet contributes to nutrition- and obesity-related diseases, such as heart disease, cancer and type 2 diabetes( Reference Robertson, Tirado and Lobstein 1 ). One strategy to improve overall health and dietary habits is to increase knowledge about nutrition. Adolescence is a period in life during which nutritional education can help adolescents establish healthy eating habits and maintain them throughout life( Reference Parmenter and Wardle 2 , Reference Sichert-Hellert, Beghin and De Henauw 3 ).
Nutritional knowledge is usually evaluated in healthy adolescents( Reference Sichert-Hellert, Beghin and De Henauw 3 – Reference Whati, Senekal and Steyn 5 ) with classical test theory( Reference Parmenter and Wardle 2 ), based on the sum of correct answers from a true/false or multiple-choice questionnaire( Reference Sichert-Hellert, Beghin and De Henauw 3 – Reference Whati, Senekal and Steyn 5 ). The Nutritional Knowledge Test (NKT) was used in the Healthy Lifestyle in Europe by Nutrition in Adolescence (HELENA) study, a cross-sectional and multicentre investigation. The HELENA study explored the level of nutritional knowledge among European adolescents and its potential determinants based on the percentage of correct answers( Reference Sichert-Hellert, Beghin and De Henauw 3 ).
The classical test approach has some limitations. The characteristics of each item may vary across different populations. Thus, the validation of the questionnaire should be analysed again( Reference Parmenter and Wardle 2 , Reference Nguyen, Han and Kim 6 ). Item Response Theory (IRT) analysis provides information on the discrimination and difficulty of each item across different levels of the latent trait. The information of items remains constant even if the analyses are performed in other samples. In this regard, IRT analysis allows selection of items with a better distinction of the latent trait and acknowledges the level of the construct required by each item. Moreover, IRT scores are not only estimated from the sum of the correct answers but calculated based on a probabilistic model. Besides, IRT scores are also independent of the considered set of items( Reference Nguyen, Han and Kim 6 ).
Therefore, IRT analysis may refine the measurement provided by the NKT, selecting items that better discriminate adolescent nutritional knowledge while characterizing the ability inherent on each level. The IRT scores calculated could also improve study of the relationship between nutritional knowledge and adolescent food intakes and biomarkers. Thus, the objectives of the present study were: (i) to analyse the NKT based on ITR analysis; and (ii) to assess the construct validity of the Nutritional Knowledge Scale (NKTS) and its associations with adolescent food group consumption and nutritional biomarkers. To address these objectives, nutritional knowledge was considered the latent trait on the IRT analysis encompassing energy metabolism, nutrient contents, oral health, food knowledge and nutritional terms.
Methods
Study design and participants
The HELENA study is a cross-sectional, multicentre investigation conducted in ten European cities: Vienna (Austria), Ghent (Belgium), Lille (France), Dortmund (Germany), Athens and Heraklion (Greece), Pécs (Hungary), Rome (Italy), Zaragoza (Spain) and Stockholm (Sweden)( Reference Moreno, De Henauw and Gonzalez-Gross 7 ). Between October 2006 and December 2007, the HELENA study was carried out in a random cluster sample of 3528 European adolescents between 12·5 and 17·49 years old and stratified by geographical location, age and socio-economic level. To guarantee this stratification, school and class of adolescents by age group were considered. Overall, ten schools and fifteen to twenty classes (350–400 students) were selected in each city. The eligibility of each class within the selected schools was based on at least 70 % of students agreeing to participate in the HELENA study. Blood samples were then obtained by randomly selecting one-third of the adolescents (n 1089) from the total sample( Reference Moreno, De Henauw and Gonzalez-Gross 7 ).
Exclusions from the HELENA study were performed a posteriori when: adolescents presented simultaneous participation in another clinical trial; were <12·5 or ≥17·5 years old; and/or had an acute infection less than one week before inclusion in the study. To process the IRT analyses, a total of 222 adolescents who did not complete more than 75 % of the NKT on the first run of the test were excluded. In addition, ninety-one adolescents providing 100 % of the answers as either right or wrong were also excluded from the current analyses because of the non-variability of the latent trait, which could affect the development of the NKTS. In total, 313 adolescents did not meet the inclusion criteria for the current analyses. Therefore, the final sample comprised 3215 adolescents.
However, a different sample size was considered in the analyses. Those adolescents who had no information on dietary assessment and under-reported energy intake using the Goldberg et al. approach( Reference Goldberg, Black and Jebb 8 , Reference Black 9 ) were excluded. This approach defines the minimum reasonable value of energy consumption that is compatible with energy balance, considering the level of physical activity( Reference Goldberg, Black and Jebb 8 , Reference Black 9 ). In total, 487 adolescents under-reported energy intake. Moreover, for the mixed-model linear regression analyses, adolescents had to provide complete information on the corresponding confounding factors (age, gender, socio-economic level, maternal education level, centre and BMI). The final sample on the mixed model-linear regression analyses with consumption of food groups and biomarkers as the outcome variables included 1623 adolescents. The final sample for the mixed-model linear regression analyses with biomarkers as the outcome variable included 609 adolescents.
In each of the participating countries, the corresponding institution approved the HELENA study protocol and all participants and both parents or guardians provided their written consent( Reference Moreno, De Henauw and Gonzalez-Gross 7 , Reference Beghin, Castera and Manios 10 ). Each participant was identified anonymously using a specific coding system which was included on the questionnaires and blood samples( Reference Beghin, Castera and Manios 10 ).
The study design is further explained in Fig. 1.
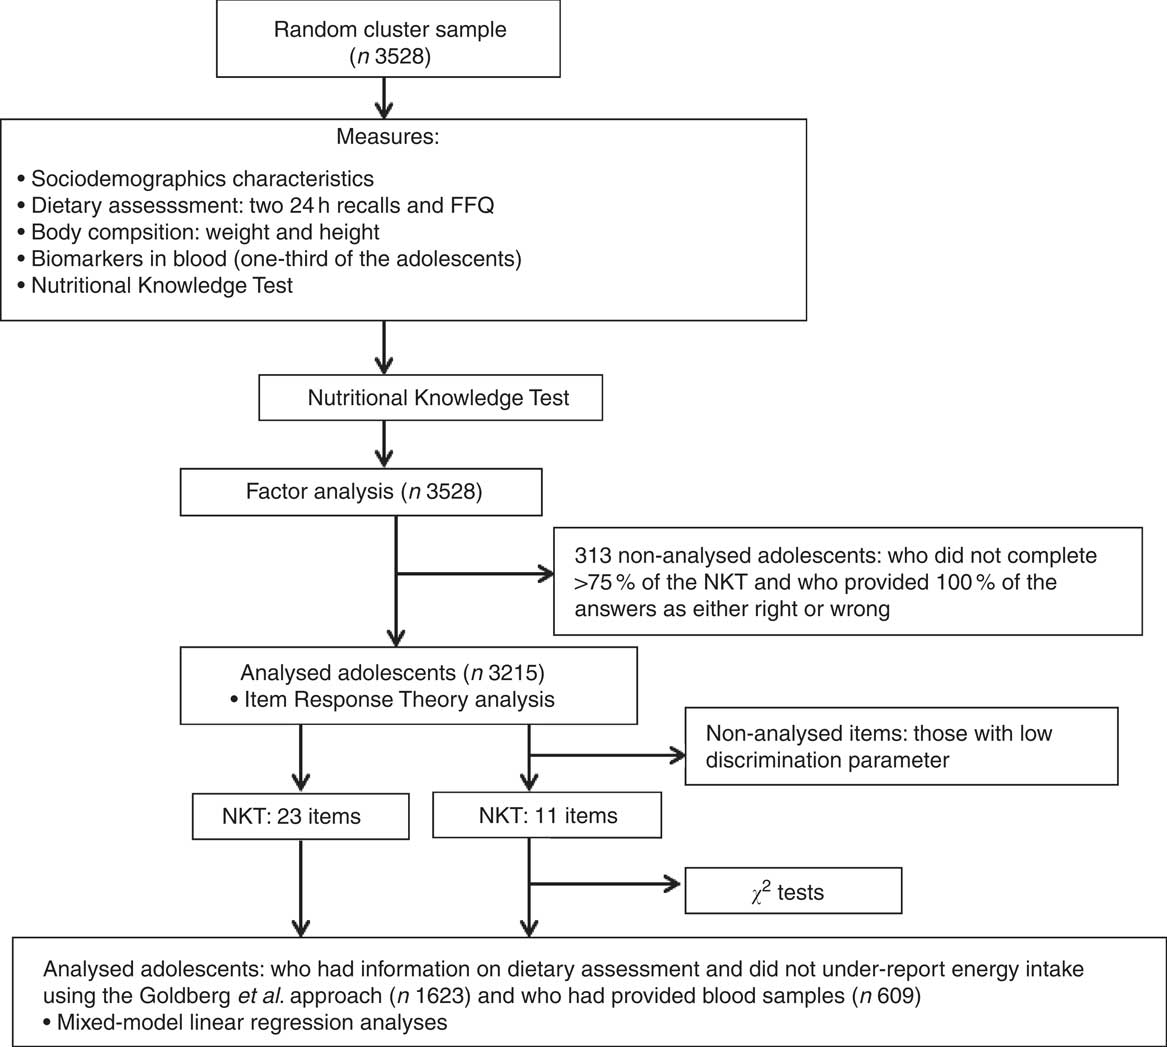
Fig. 1 Study design flowchart (NKT, Nutritional Knowledge Test; NKTS, Nutritional Knowledge Scale)
Sociodemographic characteristics
Socio-economic status was evaluated with a self-reported questionnaire that collects data on living conditions, family structure, employment status of parents, parental occupation and educational level( Reference Iliescu, Beghin and Maes 11 ). The Family Affluence Scale (FAS) index was calculated based on this questionnaire and was used as an indicator of adolescents’ material affluence (reflecting the number of bedrooms, cars and computers possessed by the family and Internet access in their home). The scale ranged from 0 to 8 and was dichotomized into ‘low familial wealth’ (0–4) and ‘high familial wealth’ (5–8). Maternal education level was categorized into ‘primary education’, ‘lower secondary education’, ‘higher secondary education’ and ‘university degree’( Reference Julian, Mouratidou and Vicente-Rodrigues 12 ).
Dietary assessment
Participants’ diet was considered to assess the construct validity of the NKTS and its associations with adolescent food intakes. In the HELENA study, dietary intake data were collected using the validated HELENA-DIAT software by two non-consecutive computerized 24 h recalls, including weekdays and Sundays. The second assessment was performed within two weeks after the first one( Reference Vandevijvere, Geelen and Gonzalez-Gross 13 ). Adolescents autonomously selected all the foods and beverages consumed from a food list that included six ‘meal occasions’. Some questions were presented to respondents to help them remember what they ate the day before. Some slides were presented for each food selected detailing the portion sizes( Reference Vandevijvere, Geelen and Gonzalez-Gross 13 , Reference Vereecken, Covents and Sichert-Hellert 14 ). In addition, a self-administered FFQ was applied. This questionnaire included fifteen items and seven weekly response categories ranging from ‘never’ to ‘more than once a day, every day’( Reference Vandevijvere, Geelen and Gonzalez-Gross 13 ). Both dietary assessment methods were administered during school time with the assistance of trained nutritionists.
Data from 24 h recalls regarding foods and beverages were expressed as grams and millilitres per day, respectively, and organized into food groups. Furthermore, to remove the effect of day-to-day variability and random error in the 24 h recalls, the individual usual food intake from these recalls was estimated using the multiple source method. This statistical modelling technique considers information from the FFQ as a covariate of the two 24 h recalls( Reference Currie 15 ).
In the present study, the foods groups that emerged from the 24 h recalls were categorized into fifteen food groups according to their similarity in nutritional content and health-related characteristics. These categories are: (i) vegetables (excluding potatoes); (ii) fruits; (iii) vegetables (excluding potatoes) and fruits; (iv) sweets (including carbonated/soft/isotonic drinks, cakes, biscuits, chocolate and other sugar products); (v) cereals (including potatoes); (vi) nuts and seeds; (vii) vegetable oils; (viii) olives and avocado; (ix) alcohol; (x) dairy products (including milk and yoghurt); (xi) pulses; (xii) meats and eggs; (xiii) fish; (xiv) savoury snacks (including chips, salty biscuits, crackers, and popcorn); and (xv) water.
Anthropometric measurements
Weight was measured with an electronic scale (model SECA 861) with 0·1 kg precision. Height was measured with participants barefoot and head in the Frankfort plane using a telescopic height-measuring instrument (model SECA 225) with 0·1 cm precision and range from 70 to 200 cm. Both measurements were taken at the same time by trained staff( Reference Nagy, Vicente-Rodriguez and Manios 16 ).
BMI (kg/m2) was calculated as weight (in kilograms) divided by the square of height (in metres). The values of BMI were categorized into ‘thinness’, ‘normal weight’, ‘overweight’ and ‘obesity’ considering the reference values for BMI in adults( Reference Cole, Flegal and Nicholls 17 , Reference Cole, Bellizzi and Flegal 18 ).
Biochemical analyses
Blood biomarker concentrations were considered to assess the construct validity of the NKTS and its associations with adolescent nutrition. In the HELENA study, the blood collection was performed after a 10 h overnight fast following a standardized protocol and up to two weeks apart from the NKT. A handling and transportation system was developed to guarantee the quality assurance and stability of blood samples( Reference González-Gross, Breidenasel and Gomez-Martinez 19 ).
Out of all the biomarkers analysed in the HELENA study, vitamin C, β-carotene, n-3 fatty acids, cobalamin and folate presented strong correlations with nutrient intakes and were included in the present analyses. Blood concentration of vitamin C, β-carotene and n-3 fatty acids presented a strong correlation with fruits, vegetables and n-3 fatty acids, respectively( Reference Vandevijvere, Geelen and Gonzalez-Gross 13 ). Trans-fatty acids were also considered due to their association with nutrition- and obesity-related diseases( Reference Wang, Inamura and Lemaitre 20 ). Folate (plasma and erythrocyte) and cobalamin were measured by a competitive immunoassay (Immulite 2000; DPC Biermann GmbH, Bad Nauheim, Germany). β-Carotene and vitamin C were analysed by HPLC (Sykam, Gilching, Germany) using UV detection (UV-Vi 205; Merck, Darmstadt, Germany). Fatty acid concentrations were determined by capillary GC (model 3900) after extraction performed by thin-layer chromatography. The total amount of fatty acids was obtained from the percentage area by integrating the area under the peak and dividing it by the total area for all fatty acids. The labels n-3 and trans include all these types of fatty acids identified during blood analyses. Holo-transcobalamin was measured by a microparticle enzyme immunoassay (Active B12; Axis-Shield Limited, Dundee, UK) with the use of an AxSYM analyser (Abbott Diagnostics, Abbott Park, IL, USA)( Reference Vandevijvere, Geelen and Gonzalez-Gross 13 , Reference González-Gross, Breidenasel and Gomez-Martinez 19 ).
To measure plasma folate, cobalamin and vitamin C (previously stabilized with metaphosphoric acid) the blood sample was collected in heparinized tubes, transported on dry ice and centrifuged within 30 min. The serum sample for fatty acid determination was also centrifuged within 30 min, stored at −80°C and transported on dry ice as soon as possible. The serum sample for β-carotene was stabilized with a synthetic antioxidant. For erythrocyte folate analysis, the whole blood was diluted in prepared ascorbic acid and incubated in the dark before storing it at −80°C. To measure holo-transcobalamin, blood was collected in evacuated tubes without anticoagulant and then the aliquot was stored at −80°C until its transport to the laboratory( Reference Vandevijvere, Geelen and Gonzalez-Gross 13 , Reference González-Gross, Breidenasel and Gomez-Martinez 19 ).
Nutritional knowledge assessment
Nutritional knowledge was evaluated with the NKT, a validated questionnaire designed by a nutritional psychologist( Reference Diehl 21 ). The NKT contains twenty-three multiple-choice items encompassing concepts related to energy intake and metabolism, nutrient contents, sweeteners and oral health, food knowledge, and special terms and definitions. This test was designed for those who did not receive any nutritional education programme in the past. Each item offers four possible answers, including a ‘don’t know’ category, but only one answer category is correct. Furthermore, the NKT comprises common misconceptions as well as easy items in order to motivate individuals to answer the test. In the HELENA study, the NKT was completed by students during class with the supervision of the research team( Reference Sichert-Hellert, Beghin and De Henauw 3 , Reference Diehl 21 , Reference Kersting, Sichert-Hellert and Vereecken 22 ).
Statistical analyses
The dimensionality of the NKT was analysed by factor analysis with estimation using principal component analysis and Varimax orthogonal rotation. The use of a one-dimensional model was acceptable if the first principal component explained 20 % or more of the total variance( Reference Reckase 23 ).
The biserial coefficient was calculated for each item to indicate the correlation behind the correct answer to items and the level of nutritional knowledge. Items with a negative biserial coefficient were excluded from the analyses( Reference Andrade, Tavares and Valle 24 ).
A one-dimensional logistic model of the three parameters was used to calculate the probability of a person to correctly answer an item, with a given nutritional knowledge level. This model is represented by the following equation( Reference Andrade, Tavares and Valle 24 ): $P\left( {{U_{ij}} = 1|{\theta _j}} \right) = {c_i} + \left( {1 - {c_i}} \right)\displaystyle\frac{1}{{1 + {{\rm{e}}^{ - D{a_i}\left( {\theta_j - {b_i}} \right)}}}},$
where θ
j
is the IRT score of a person j; P(U
ij
= 1 $|$
θ
j
) is the probability of a person j with an ability θ
j
to correctly answer an item i; D is a scale constant factor and equal to 1·7; c
i
is the guessing parameter of item i; a
i
is the discrimination parameter of item i; and b
i
is the difficulty parameter of item i.
$|$
θ
j
) is the probability of a person j with an ability θ
j
to correctly answer an item i; D is a scale constant factor and equal to 1·7; c
i
is the guessing parameter of item i; a
i
is the discrimination parameter of item i; and b
i
is the difficulty parameter of item i.
The discrimination parameter a
i
indicates the quality of an item to discriminate people with different levels of nutritional knowledge. Items with higher values on this parameter present better discrimination. The difficulty parameter b
i
identifies the point on the scale at which the probability to answer correctly is higher than or equal to $(1+c_{i} )\,/\,2$
(
Reference Andrade, Tavares and Valle
24
). Finally, the guessing parameter c
i
indicates the probability that someone gives the correct answer by chance, with value equal to or above 0 and equal to or below 1 (0 ≤ c
i
≤ 1)(
Reference Chernyshenko, Stark and Chan
25
).
$(1+c_{i} )\,/\,2$
(
Reference Andrade, Tavares and Valle
24
). Finally, the guessing parameter c
i
indicates the probability that someone gives the correct answer by chance, with value equal to or above 0 and equal to or below 1 (0 ≤ c
i
≤ 1)(
Reference Chernyshenko, Stark and Chan
25
).
All parameters (a i , b i and c i ) were estimated by marginal maximum likelihood with a maximum number of twenty quadrature points, fifty EM cycles, ten Newton interactions and convergence criterion equal to 0·01. These parameters estimates were analysed with the corresponding se (see online supplementary material, Supplemental Table 1). Items with discrimination parameter a i value below or equal to 0·70 were considered as having less discrimination and were excluded from further analyses. The estimation of the parameters mentioned above was repeated only for items with adequate discrimination. To control the lack of identification of the model, b i and IRT scores were estimated on a scale with mean equal to 0 and sd equal to 1 by the expected a posteriori method( Reference Chernyshenko, Stark and Chan 25 ). Empirical reliability, a precision measure analogous to Cronbach’s α, was calculated to analyse the reliability of the NKTS. Besides the empirical reliability, the test information curve was analysed to identify the accuracy of the measurement along the NKTS.
The probability of the correct answer for each item was calculated across IRT scores. The item was located at the level of the correct answer probability when it was higher than or equal to $(1+c_{i} )\,/\,2$
. Some levels were grouped into the same range of nutritional knowledge according to the technical similarity between items. This step was performed by two nutritionists (T.S.S.S. and C.J.) using Microsoft® Excel version 2010.
$(1+c_{i} )\,/\,2$
. Some levels were grouped into the same range of nutritional knowledge according to the technical similarity between items. This step was performed by two nutritionists (T.S.S.S. and C.J.) using Microsoft® Excel version 2010.
To analyse the associations between IRT scores and demographic, socio-economic and health characteristics, Kolmogorov–Smirnov tests were carried out to test the normality in the distribution of the studied variables and guide further analyses. The χ 2 test was performed to evaluate differences between demographic, socio-economic and BMI categories by NKTS levels. Mixed-model linear regression analyses were performed to assess the construct validity of NKTS and its associations with nutritional knowledge, food group consumption and biomarkers. The IRT scores were included as the independent variable. To explore these associations, analyses were carried out separately for the NKTS (considering only items with adequate IRT parameters) and for all items in the original NKT (calculating all IRT scores although there were items with inadequate IRT parameters). Food groups and biomarker variables were included separately in the model with the outcome variable, and centre was included as the random intercept. Age, gender, maternal education, FAS index, BMI and energy intake were entered as covariates in the model. Statistical significance was set at P < 0·05.
Analyses were performed using the statistical software package Stata version 14( Reference StataCorp 26 ) and the software BILOG-MG version 3( Reference Zimowski, Muraki and Mislevy 27 ).
Results
As suggested by the factor analysis, the first principal component explained 46 % of the total variance (see online supplementary material, Supplemental Fig. 1). None of the items presented a negative biserial coefficient (Supplemental Table 1). Twelve items presented low discrimination of nutritional knowledge and were excluded from further analyses. Biserial coefficient and IRT parameters (a i , b i and c i ) of the remaining items are described in Table 1.
Table 1 Biserial coefficient and discrimination, difficulty and guessing parameters, with their se, from the Item Response Theory analysis of the Nutritional Knowledge Scale
† Discrimination parameter.
‡ Difficulty parameter.
§ Guessing parameter.
The estimation of the IRT parameters was completed with eleven EM cycles and three Newton interactions. Along the nutritional knowledge continuum, the item ‘A breakfast merely consisting of bread, jam and butter does not contain enough…?’ presented the lowest discrimination parameter (a i = 0·88). On the other hand, the item ‘The ingredients list found on food items may contain a number of different terms for sugar. Which row lists three terms for special types of sugar?’ had the highest discrimination parameter (a i = 1·65).
The item ‘Marcel has been playing with a ball all afternoon. During this time Kevin has been sitting at home watching television. Which of the following statements is most applicable?’ had the lowest difficulty parameter (b i = −2·13), suggesting that energy expenditure is a relatively easy concept for the adolescents. The item ‘Which row lists three terms for energy-free sweeteners?’ presented the highest difficulty parameter (b i = 1·50), suggesting that advanced nutritional terms were the most difficult ones to be identified by the HELENA adolescents.
All items presented low values of the guessing parameter c i , with values ranging from 0·01 to 0·09. In the studied sample, NKTS scores varied from –0·83 to 0·83. NKTS showed a good empirical reliability (0·69) and presented more accurate information between IRT scores, ranging from −1·0 to 1·0 (Fig. 2).
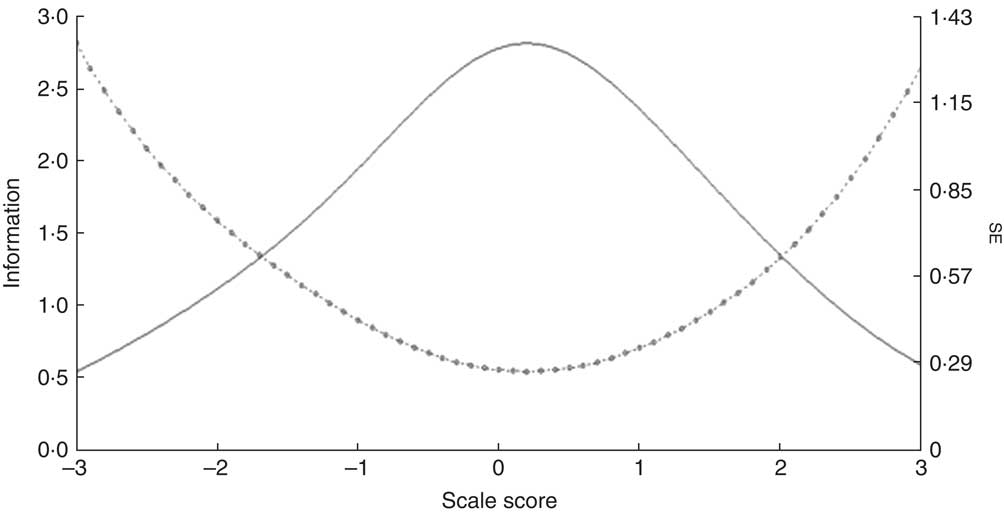
Fig. 2 Nutritional Knowledge Scale information curve (n 3215): ![]() , test information curve;
, test information curve; ![]() , standard error curve
, standard error curve
Results from the mixed-model linear regression analysis with food group consumption as the outcome variables and NKTS scores as the independent variable are shown in Table 2. Nutritional knowledge was positively associated with consumption of fruits, cereals, dairy products, pulses, meats and eggs, and fish, and was negatively associated with intake of olives and avocado, alcohol and savoury snacks.
Table 2 Mixed-model analyses between intakes of food groups (g/d) and Item Response Theory scores from the Nutritional Knowledge Scale, adjusted for age, gender, maternal education, Family Affluence Scale index and energy intake, among European adolescents aged 12·5–17·5 years (n 1623), HELENA (Healthy Lifestyle in Europe by Nutrition in Adolescence) study
Centre was used as the random intercept.
* Significant P values.
† Fixed-effects estimates.
Results from the mixed-model linear regression analysis with the concentration of biomarkers as the outcome variables and NKTS scores as the independent variable are presented in Table 3. Nutritional knowledge was positively associated with blood concentrations of vitamin C, β-carotene, n-3 fatty acids, holo-transcobalamin, cobalamin and folate. Additionally, both mixed-model linear regression analyses presented similar results when IRT scores were calculated for all items of the original NKT that presented low discrimination of nutritional knowledge (see online supplementary material, Supplemental Tables 2 and 3) and when the number of cigarettes consumed was included as a covariate (data not shown).
Table 3 Mixed-model analyses between concentrations of biomarkers and Item Response Theory scores from the Nutritional Knowledge Scale, adjusted for age, gender, maternal education, Family Affluence Scale index, BMI and energy intake, among European adolescents aged 12·5–17·5 years (n 609), HELENA (Healthy Lifestyle in Europe by Nutrition in Adolescence) study
Centre was used as the random intercept.
* Significant P values.
† Fixed-effects estimates.
NKTS scores were categorized into three different levels to facilitate their interpretation: basic, adequate and advanced. The basic level (IRT scores below −0·5) included knowledge about energy expenditure and ingredients from recipes. This level comprised the items: ‘Marcel has been playing with a ball all afternoon. During this time Kevin has been sitting at home watching television. Which of the following statements is most applicable?’ and ‘Which row lists three dishes that have all been prepared using very little fat?’ The adequate level (IRT scores from −0·5 to 1·0) included knowledge about nutrients from foods and their role in health. This level presented the following items: ‘Which substance is good for your teeth?’; ‘Bread, cake, pasta, potatoes and rice contain mainly…?’; ‘Dietitians use the American term “junk food” to describe certain foods. What do they mean by this?’; ‘What effects does the fibre contained in our food have on the human body?’; ‘The ingredients list found on food items may contain a number of different terms for sugar. Which row lists three terms for special types of sugar?’; ‘A breakfast merely consisting of bread, jam and butter does not contain enough…?’; and ‘Which row lists three foods that contain a lot of vitamin C?’ The advanced level (IRT scores above or equal to 1·0) included knowledge about basic and advanced nutritional terms. This last level contained the items: ‘What is the other commonly used term for energy?’ and ‘Which row lists three terms for energy-free sweeteners?’ Therefore, a person who shows a nutritional knowledge level below −0·5 would have knowledge on energy expenditure and ingredients from recipes. On the other hand, a person with a nutritional knowledge level above or equal to 1 would present advanced nutritional knowledge, such as knowledge of energy expenditure, nutrients from foods and their role in health, ingredients from recipes and advanced nutritional terms.
The demographic and socio-economic characteristics of participants are described in Table 4. Girls, older adolescents, those whose mothers had a university education and those with a high FAS index presented higher nutritional knowledge.
Table 4 Demographic and socio-economic characteristics, by Nutritional Knowledge Scale level, of European adolescents aged 12·5–17·5 years (n 3215), HELENA (Healthy Lifestyle in Europe by Nutrition in Adolescence) study

FAS, Family Affluence Scale.
* Significant P values.
† Likelihood ratio P value.
Discussion
When evaluating if the NKT assessed nutritional knowledge, factor analysis indicated that the first principal component explained 46 % of the total variance. Therefore, an one-dimensional logistic model of three parameters was applied to develop the NKTS( Reference Reckase 23 , Reference Andrade, Tavares and Valle 24 ).
The original NKT calculated only the percentage of correct answers( Reference Sichert-Hellert, Beghin and De Henauw 3 ); in this way, adolescents with different nutritional knowledge levels could get the same score( Reference Wilson, Allen and Li 28 ). The IRT analysis complements the classical approach as it calculates the scores and the pattern of correct answers by comparing the difficulty of each item( Reference Primi 29 ).
Twelve items from the original NKT presented low discrimination of nutritional knowledge and thus were excluded. The NKTS provides a high-quality tool to assess nutritional knowledge, as it includes items with the best discrimination of nutritional knowledge. In addition, results from the mixed-model linear regression analyses presented similar associations between food group consumption and nutritional biomarkers in two different approaches: when considering the NKTS (IRT scores calculated from eleven items) or the original NKT (IRT scores calculated from all twenty-three items). One of the benefits of using a lower number of items is the accuracy of participants’ responses, as large periods for questionnaire completion tend to increase fatigue and boredom( Reference Burns, Duffett and Kho 30 ). Therefore, the reduction in the number of items on the questionnaire may improve the quality of answers and decrease the time of completion. This aspect is important for epidemiology researchers working with large sample sizes and assessing information in a short period of time.
Besides this refinement of the NKT, by selecting the items that best discriminated nutritional knowledge, all items maintained on the NKTS presented an adequate guessing parameter. If an item presents a high value concerning the guessing parameter, it should be excluded from the final questionnaire because guessing is influenced by a high probability of correct answers( Reference Andrade, Tavares and Valle 24 ). Therefore, adequate guessing parameters may confirm the precision of the NKTS. In this regard, the IRT analyses improved the quality of nutritional knowledge assessment.
In addition to the reduced number of items and greater accuracy of the measurement, the current analysis confirmed the construct validity of the NKTS. The mixed-model linear regression analysis confirmed that nutritional knowledge is positively associated with the consumption of healthy foods and an appropriate profile of nutritional biomarkers. The NKTS scores were positively associated with intakes of fruits, cereals, dairy products, pulses, meat and eggs, and fish, as well as with blood concentrations of vitamin C, β-carotene, n-3 fatty acids, holo-transcobalamin, cobalamin and folate; on the other hand, nutritional knowledge was negatively associated with consumption of olives and avocado, alcohol and savoury snacks. A recent study on Japanese children and their guardians also observed a positive association between nutritional knowledge and consumption of healthy foods( Reference Asakura, Todoriki and Sasaki 31 ). Among adolescents, some studies have demonstrated that nutritional knowledge is related to a higher overall variety of food( Reference Augustine, Vazir and Rao 32 , Reference Oldewage-Theron, Egal and Moroka 33 ), higher serum retinol and lower intakes of total fat and added sugars( Reference Oldewage-Theron, Egal and Moroka 33 ). Finally, considering the challenges to obtain accurate food intakes, the positive associations between NKTS scores and nutritional biomarkers improved the results from the mixed-model linear regression analysis with food groups’ consumption as the outcome variable. Despite the non-expected negative association with intakes of olives and avocado (P <0·05), our results highlight the importance of acquiring nutritional knowledge as a strategy to improve dietary habits among adolescents.
After calculating IRT scores, the next step was to describe the nutritional knowledge in each NKTS level. Based on this description, it may be possible to better assess what adolescents know about nutrition and with which items they may have more difficulty( Reference Primi 29 ). The basic level includes knowledge about energy expenditure and ingredients from recipes. Individuals who are classified on this level would correctly answer to the item with the lowest difficulty level: ‘Marcel has been playing with a ball all afternoon. During this time Kevin has been sitting at home watching television. Which of the following statements is most applicable?’ (b i = −2·13). The item ‘Which row lists three terms for energy-free sweeteners?’ presented the highest difficulty parameter (b i = 1·50), suggesting that advanced nutritional terms were the most difficult to be identified by adolescents of the HELENA study. This item would probably be answered correctly by those adolescents on the advanced level and with NKTS scores higher than 1·50. Therefore, the identification of the NKTS levels in the studied individuals may improve the strategic direction of scientific interventions and policy making.
This description makes it possible to determine the proportion of individuals on each NKT level. In this regard, adolescents from Heraklion and Lille presented the lowest NKTS scores. In agreement with a previous study that evaluated the NKT( Reference Sichert-Hellert, Beghin and De Henauw 3 ), the scores from the NKTS significantly increased in adolescents who were older in age, female and whose mothers had more education. Moreover, the positive associations between NKTS scores and socio-economic level are consistent with previous research. A population-based study indicated a linear association between nutritional knowledge and socio-economic level in urban and rural regions in Iraq( Reference Heshmat, Salehi and Qorbani 34 ). Finally, in the current study, NKTS scores were negatively associated with BMI among thin and obese adolescents. However, the relationship between nutritional knowledge and nutritional status is not well known in the literature. The previous study evaluating the NKT( Reference Sichert-Hellert, Beghin and De Henauw 3 ) and other studies have demonstrated no significant associations in adolescents and adults( Reference Brien and Davies 35 , Reference Meseri, Mermer and Ergin 36 ). However, it is important to mention that these studies used classical test theory and, therefore, their results may not be accurate.
The test information curve indicated that the NKTS is more precise within medium scores. For this reason, it is necessary to include new items measuring other levels of knowledge. In future studies, the item parameters could be maintained and new items included in the NKTS. This could be possible using computerized adaptive testing which allows calculating more precise estimates and creating a flexible questionnaire making it less burdensome for respondents( Reference Cella, Riley and Stone 37 ).
The current analysis aimed to evaluate the NKT based on the ITR analysis and assess the construct validity of the developed NKTS and its associations with food consumption and nutritional biomarkers in adolescents. The factor analysis confirmed that the NKT assessed nutritional knowledge. However, if we were evaluating nutritional knowledge in other populations, the classical approach would not be applicable by using the original NKT. The IRT analysis complemented the classical test approach, identifying those items with better discrimination and the location of each item on the continuum. Additionally, IRT analysis added the characterization of each nutritional knowledge level. Results from the mixed-model linear regression analysis confirmed the validity of the NKTS, endorsing its use in epidemiological studies. Furthermore, due to the invariance in the estimation of the IRT parameters, the NKTS can be applied to other populations such as adolescents and adults from different countries( Reference Wilson, Allen and Li 28 ). When analysing NKTS scores in other populations it will be necessary that participants answer some or all of the eleven items. Moreover, to calculate these scores, it is important to consider the IRT parameters calculated in the current study. In addition, IRT scores can be applied to further studies in continuous or categorical forms.
Limitations and strengths
One limitation of the present study concerns the cross-sectional design which does not allow pointing out causal inferences. Besides, the missing values reduced the sample size for the IRT analysis, but it was large enough to estimate IRT parameters and detect associations between IRT scores and both food intakes and nutritional biomarkers. The HELENA study did not assess information on supplement intake that may affect the results from the mixed-model linear regression analyses with the concentration of biomarkers as the dependent variable. The dietary assessment was based on self-reporting which may affect the precision of the information, although the HELENA-DIAT software includes some questions to help adolescents remember what they ate the day before. However, the study has some strengths; the stratified nature of the sampling increased the precision of the data that may differ across strata. The standard procedures used to collect all measurements throughout the cities and the analyses were controlled for several confounding factors. Furthermore, the development of the NKTS was based on statistical analyses that solve the limitations of the classical test approach previously described. In this regard, the use of the NKTS may generate new and promising research partnerships, and after its standardization, researchers can apply this new method to assess nutritional knowledge in different studies and populations.
Conclusions
The IRT analysis selected those items from the NKT which presented better nutritional knowledge discrimination. The NKTS provides a more precise assessment of the latent trait with a short and high-quality pool of items. The mixed-model linear regression analysis confirmed the validity of the NKTS, indicating positive associations between the NKTS and healthy food consumption as well as nutritional biomarkers. The NKTS is proposed as a new instrument to assess nutritional knowledge in Europe and other parts of the world.
Acknowledgements
Financial support: The HELENA study took place with the financial support of the European Community Sixth RTD Framework Programme (contract FOOD-CT-2005-007034). The present study was supported by a grant from Exterior Sandwich Doctorate Program for the Coordination of Improvement of Higher Level Personnel (CAPES, Coordenação de Aperfeiçoamento de Pessoal de Nível Superior) (grant number 88881.132853/2016-01). The European Community Sixth RTD Framework Programme and CAPES had no role in the design, analysis or writing of this article. Conflict of interest: None. Authorship: T.S.S.S. and C.J. analysed the data and wrote the first draft with contributions from L.A.M. All authors reviewed and commented on subsequent drafts of the manuscript. Ethics of human subject participation: This study was conducted according to the guidelines laid down in the Declaration of Helsinki and all procedures involving human subjects were approved by the responsible institution in each of the participating countries. Written informed consent was obtained from all participants.
Supplementary material
To view supplementary material for this article, please visit https://doi.org/10.1017/S1368980018003269
Appendix
The HELENA Study Group
Co-ordinator: Luis A. Moreno. Core Group members: Luis A. Moreno, Fréderic Gottrand, Stefaan De Henauw, Marcela González-Gross, Chantal Gilbert. Steering Committee: Anthony Kafatos (President), Luis A. Moreno, Christian Libersa, Stefaan De Henauw, Sara Castelló, Fréderic Gottrand, Mathilde Kersting, Michael Sjöstrom, Dénes Molnár, Marcela González-Gross, Jean Dallongeville, Chantal Gilbert, Gunnar Hall, Lea Maes, Luca Scalfi. Project Manager: Pilar Meléndez. Universidad de Zaragoza (Spain): Luis A. Moreno, Jesús Fleta, José A. Casajús, Gerardo Rodríguez, Concepción Tomás, María I. Mesana, Germán Vicente-Rodríguez, Adoración Villarroya, Carlos M. Gil, Ignacio Ara, Juan Fernández Alvira, Gloria Bueno, Aurora Lázaro, Olga Bueno, Juan F. León, Jesús Mª Garagorri, Idoia Labayen, Iris Iglesia, Silvia Bel, Luis A. Gracia Marco, Theodora Mouratidou, Alba Santaliestra-Pasías, Iris Iglesia, Esther González-Gil, Pilar De Miguel-Etayo, Cristina Julian, Mary Miguel-Berges, Isabel Iguacel. Consejo Superior de Investigaciones Científicas (Spain): Ascensión Marcos, Julia Wärnberg, Esther Nova, Sonia Gómez, Ligia Esperanza Díaz, Javier Romeo, Ana Veses, Belén Zapatera, Tamara Pozo, David Martínez. Université de Lille 2 (France): Laurent Beghin, Christian Libersa, Frédéric Gottrand, Catalina Iliescu, Juliana Von Berlepsch. Research Institute of Child Nutrition Dortmund, Rheinische Friedrich-Wilhelms-Universität Bonn (Germany): Mathilde Kersting, Wolfgang Sichert-Hellert, Ellen Koeppen. Pécsi Tudományegyetem (University of Pécs) (Hungary): Dénes Molnar, Eva Erhardt, Katalin Csernus, Katalin Török, Szilvia Bokor, Mrs Angster, Enikö Nagy, Orsolya Kovács, Judit Répasi. University of Crete School of Medicine (Greece): Anthony Kafatos, Caroline Codrington, María Plada, Angeliki Papadaki, Katerina Sarri, Anna Viskadourou, Christos Hatzis, Michael Kiriakakis, George Tsibinos, Constantine Vardavas, Manolis Sbokos, Eva Protoyeraki, Maria Fasoulaki. Institut für Ernährungs- und Lebensmittelwissenschaften – Ernährungphysiologie, Rheinische Friedrich Wilhelms Universität (Germany): Peter Stehle, Klaus Pietrzik, Marcela González-Gross, Christina Breidenassel, Andre Spinneker, Jasmin Al-Tahan, Miriam Segoviano, Anke Berchtold, Christine Bierschbach, Erika Blatzheim, Adelheid Schuch, Petra Pickert. University of Granada (Spain): Manuel J. Castillo, Ángel Gutiérrez, Francisco B. Ortega, Jonatan R. Ruiz, Enrique G. Artero, Vanesa España, David Jiménez-Pavón, Palma Chillón, Cristóbal Sánchez-Muñoz, Magdalena Cuenca. Instituto Nazionalen di Ricerca per gli Alimenti e la Nutrizione (Italy): Davide Arcella, Elena Azzini, Emma Barrison, Noemi Bevilacqua, Pasquale Buonocore, Giovina Catasta, Laura Censi, Donatella Ciarapica, Paola D’Acapito, Marika Ferrari, Myriam Galfo, Cinzia Le Donne, Catherine Leclercq, Giuseppe Maiani, Beatrice Mauro, Lorenza Mistura, Antonella Pasquali, Raffaela Piccinelli, Angela Polito, Romana Roccaldo, Raffaella Spada, Stefania Sette, Maria Zaccaria. University of Napoli ‘Federico II’ Dept of Food Science (Italy): Luca Scalfi, Paola Vitaglione, Concetta Montagnese. Ghent University (Belgium): Ilse De Bourdeaudhuij, Stefaan De Henauw, Tineke De Vriendt, Lea Maes, Christophe Matthys, Carine Vereecken, Mieke de Maeyer, Charlene Ottevaere, Inge Huybrechts. Medical University of Vienna (Austria): Kurt Widhalm, Katharina Phillipp, Sabine Dietrich, Birgit Kubelka, Marion Boriss-Riedl. Harokopio University (Greece): Yannis Manios, Eva Grammatikaki, Zoi Bouloubasi, Tina Louisa Cook, Sofia Eleutheriou, Orsalia Consta, George Moschonis, Ioanna Katsaroli, George Kraniou, Stalo Papoutsou, Despoina Keke, Ioanna Petraki, Elena Bellou, Sofia Tanagra, Kostalenia Kallianoti, Dionysia Argyropoulou, Stamatoula Tsikrika, Christos Karaiskos. Institut Pasteur de Lille (France): Jean Dallongeville, Aline Meirhaeghe. Karolinska Institutet (Sweden): Michael Sjöstrom, Jonatan R. Ruiz, Francisco B. Ortega, María Hagströmer, Anita Hurtig Wennlöf, Lena Hallström, Emma Patterson, Lydia Kwak, Julia Wärnberg, Nico Rizzo. Asociación de Investigación de la Industria Agroalimentaria (Spain): Jackie Sánchez-Molero, Sara Castelló, Elena Picó, Maite Navarro, Blanca Viadel, José Enrique Carreres, Gema Merino, Rosa Sanjuán, María Lorente, María José Sánchez. Campden BRI (UK): Chantal Gilbert, Sarah Thomas, Elaine Allchurch, Peter Burgess. SIK – Institutet foer Livsmedel och Bioteknik (Sweden): Gunnar Hall, Annika Astrom, Anna Sverkén, Agneta Broberg. Meurice Recherche & Development asbl (Belgium): Annick Masson, Claire Lehoux, Pascal Brabant, Philippe Pate, Laurence Fontaine. Campden & Chorleywood Food Development Institute (Hungary): Andras Sebok, Tunde Kuti, Adrienn Hegyi. Productos Aditivos SA (Spain): Cristina Maldonado, Ana Llorente. Cárnicas Serrano SL (Spain): Emilio García. Cederroth International AB (Sweden): Holger von Fircks, Marianne Lilja Hallberg, Maria Messerer. Lantmännen Food R&D (Sweden): Mats Larsson, Helena Fredriksson, Viola Adamsson, Ingmar Börjesson. European Food Information Council (Belgium): Laura Fernández, Laura Smillie, Josephine Wills. Universidad Politécnica de Madrid (Spain): Marcela González-Gross, Jara Valtueña, David Jiménez-Pavón, Ulrike Albers, Raquel Pedrero, Agustín Meléndez, Pedro J. Benito, Juan José Gómez Lorente, David Cañada, Alejandro Urzanqui, Rosa María Torres, Paloma Navarro.


