


Peer victimization in school is one of the most pervasive and stubbornly intractable challenges confronting school-aged children today. Victimization, also known as harassment or bullying, has become a major public health concern (Rivara & Le Menestrel, Reference Rivara and Le Menestrel2016). Data from national surveys indicate that anywhere from 20 to 60 percent of school-aged youth report that they have been victimized by peers and 10–15 percent may be chronic victims (e.g., National Center for Education Statistics, 2019). A generation ago, if we had asked youth what they worry most about in school they probably would have said having enough friends and getting good grades. Today, students’ school concerns often revolve around safety as much as popularity and achievement, as school bullying continues to be widespread and victims of peer abuse report feeling quite vulnerable.
We define peer victimization as physical, verbal, or psychological abuse that takes place in and around school, especially where adult supervision is minimal. The critical features that distinguish victimization from simple conflict between peers are the intention to cause harm and an imbalance of power between perpetrator and victim (Olweus, Reference Olweus1993). Taunting, name calling, racial slurs, hitting, spreading of rumors, and social exclusion by powerful others – in person or online – are all examples of behaviors that constitute peer victimization. Being a target of such behavior hurts. Victims feel more lonely, anxious, and depressed than their non-victimized peers and they are often disliked by those peers (e.g., Christina et al., Reference Christina, Magson, Kakar and Rapee2021). There is growing evidence that victimization can also “get under the skin,” affecting stress response systems such as the hypothalamic-pituitary-adrenal (HPA) axis (McDougall & Vaillancourt, Reference McDougall and Vaillancourt2015). These mental, social, and physical health consequences in part explain why victims of bullying can also disengage from school (Juvonen & Graham, Reference Juvonen and Graham2014). Children who must cope with the stress of chronic peer harassment often feel unsafe at school and they have few cognitive and emotional resources left over to do well academically.
In this article we focus on the experience of victimization and its consequences during the middle school years. We examine longitudinal associations between peer victimization and an important social cognitive variable – namely, self-blame – that might partly account for the negative mental health consequences of harassment from peers, and a meaningful school climate variable – namely, perception of school safety – that might partly explain why victims struggle academically. We situate our research within the context of middle schools that vary in racial/ethnic diversity. We study middle school because early adolescents may be most vulnerable to victimization by peers (Juvonen & Graham, Reference Juvonen and Graham2014; Rivara & Le Menestrel, Reference Rivara and Le Menestrel2016) and we center racial/ethnic diversity because of the growing diversity of this nation’s school-aged population. In keeping with the theme of this special issue on resilience, we investigate whether racially/ethnically diverse middle schools and classrooms might buffer the negative consequences of peer victimization examined here. We model both structural indicators of diversity measured at the school level and dynamic indicators measured at the level of individual students based on their exposure to racial/ethnic diversity in their classrooms throughout the school day. To our knowledge, this is the first study to longitudinally examine whether structural and dynamic racial/ethnic diversity protect youth who are victimized by peers.
Structural and dynamic school diversity as protective factors
Ours is a society undergoing a rapid demographic transformation. Fueled largely by immigration, within a generation Whites will no longer be the numerical majority racial group in the United States, Latinos will be the largest numerical minority racial/ethnic group, Asians may be the fastest growing group, and the small Multiracial population will have tripled (Pew Research Center, 2015; U.S. Census Bureau, 2020). More than half of school-age youth in this country are members of racial/ethnic minoritized groups and our schools are well on their way to becoming a social institution without a clear numerical majority group (National Center for Education Statistics, 2023).
Studies of peer victimization in school, like peer relations research in general, have not kept pace with these changing demographic trends (Graham & Echols, Reference Graham, Echols, Bukowski, Laursen and Rubin2018). Most studies with adolescents that include different racial/ethnic groups take a comparative approach by focusing on mean level group differences in the reporting of victimization. Such studied have yielded inconsistent findings. For example, Bettencourt et al. (Reference Bettencourt, Musci, Masyn and Farrell2022) reported that Blacks were the most victimized among four major racial/ethnic groups whereas Jackman et al. (Reference Jackman, Kreuze, Caceres and Schnall2020) documented more perceived harassment among White students than any racial/ethnic minoritized group. And Hong et al. (Reference Hong, Yan, Gonzalez-Prendes, Espelage and Allen-Neares2021) reported more victimization among Black-White biracial youth compared to their Black or White monoracial peers. Some of the challenges in interpreting disparate comparative racial findings are due to methodological factors such as sample size differences and the way victimization is assessed. Nonetheless, there does not seem to be any theoretical or empirical reason to presume that race/ethnicity in and of itself is a risk factor for peer victimization (see Vitoroulis & Vaillancourt, Reference Vitoroulis and Vaillncourt2015 for a meta-analysis).
We believe that a more promising approach is to highlight protection rather than risk and to focus on race/ethnicity within the context of schools that vary in diversity. Diversity is best captured by the number and size of different groups (Budescu, & Budescu, Reference Budescu and Budescu2012). Several studies document that students report more victimization when they are a numerical minority in their school (e.g., Felix & You, Reference Felix and You2011; Hoglund & Hosan, Reference Hoglund and Hosan2013), especially if they are a societally marginalized numerical minority. Such findings are consistent with theoretical analyses of victimization as involving an imbalance of power between perpetrator and victim (Olweus, Reference Olweus1993). Asymmetric power relations take many forms, as when stronger youth harass weaker classmates or when older students pick on younger peers. At the group level, an imbalance of power can also exist when members of majority racial/ethnic groups (more powerful in the numerical sense) harass members of numerical minority racial/ethnic groups (less powerful in the numerical sense). More groups of relatively equal size – the hallmark of school diversity – may be protective because the numerical balance of power is less likely to be tipped in favor of one or more large racial/ethnic groups exerting their influence over one or more small racial/ethnic groups. Several cross-sectional studies have reported that more school racial/ethnic diversity is related to less peer victimization (e.g., Felix & You, Reference Felix and You2011; Juvonen et al., Reference Juvonen, Nishina and Graham2006).
The studies referenced above defined racial/ethnic diversity in middle school as a structural variable that is static across time. Modeling school diversity as structural, which is typical of most research, implicitly assumes that students experience the diversity of their school the same way when they arrive in the morning and throughout the school day. It also assumes that racial/ethnic diversity remains relatively stable over time. This structural approach to measuring diversity does not take into account the dynamic changes in diversity that individual students experience as they are exposed to different peers throughout the school day. Starting in middle school, students frequently move from class to class throughout their day (Juvonen et al., Reference Juvonen, Le, Kaganoff, Augustine and Constant2004). For example, a student may be taking math or science with one set of classmates, English or social studies with a different set, and physical education or electives with yet another set of classmates. Thus, the racial/ethnic diversity that each student experiences in his or her courses may differ from the overall racial/ethnic diversity of the school. Dynamic diversity measured at the individual level based on classroom composition may be a stronger buffer of peer victimization than structural diversity measured at the school level.
Developmental changes in victimization
Does school racial/ethnic diversity slow the rate at which victimization increases or accelerate the rate at which it decreases? To answer this question we need to know whether peer victimization increases or decreases over the grade school years. Some longitudinal research suggests that victimization declines across the elementary grades and continues to decrease throughout adolescence (e.g., Brendgen et al., Reference Brendgen, Girard, Vitaro, Dionne and Boivin2016; Ladd et al., Reference Ladd, Ettekal and Kochenderfer-Ladd2017), whereas other research suggests that victimization might peak during the transition to middle school and then decline (e.g., Nylund et al., Reference Nylund, Bellmore, Nishina and Graham2007; Pellegrini & Long, Reference Pellegrini and Long2002). Most longitudinal studies take a person-centered approach to examine latent classes or trajectories of victimization over time (e.g., Haltigan & Vaillancourt, Reference Haltigan and Vaillancourt2018; Ladd et al., Reference Ladd, Ettekal and Kochenderfer-Ladd2017; Sheppard et al., Reference Sheppard, Giletta and Prinstein2019). Taken together, the trajectory studies reveal that the majority of students are infrequently harassed by their peers – which is good news, a small class of students is chronically victimized, and most others experience more dynamic trajectories of either relatively early onset but declining victimization or later onset and increasing victimization over time. However, relatively little is known about how critical features of the school context such as racial/ethnic diversity affect these trajectories.
Victimization and self-blame
Whether studied cross-sectionally or longitudinally, peer victimization is associated with maladaptive mental health consequences such as loneliness, depression, or anxiety (Christina et al., Reference Christina, Magson, Kakar and Rapee2021). One mechanism that might partly explain these victimization-adjustment outcomes draws on attributional analyses of how victims reason about the causes of their harassment. A history of peer abuse or even one particularly painful experience might lead a victim to ask: Why me? In the absence of other plausible explanations, that person might conclude that “I’m the kind of kid who deserves to be picked on.” Self-blame can then lead to many negative outcomes, including low self-esteem, loneliness, anxiety, and depression. In the adult literature on causal explanations for rape (another form of victimization) it is well documented that an attribution evoking personal deservingness, labeled characterological self-blame, is especially detrimental (Janoff-Bulman, Reference Janoff-Bulman1979). Characterological self-blame connotes an attribution that is internal (“it is something about me”), stable (‘things will always be that way’), and uncontrollable (“there is nothing I can do to change it”). From an attributional perspective, perceiving failure as due to an internal, stable, and uncontrollable cause can be particularly debilitating because individuals feel both hopeless and helpless (Weiner, Reference Weiner1986).
Guided by attribution theory, Graham and Juvonen (Reference Graham and Juvonen1998) developed a measure of reactions to hypothetical experiences of peer victimization that included items designed to capture characterological self-blame. Middle school students with reputations as victims were more likely than non-victims to endorse characterological self-blame as a cause of harassment and they felt more anxious and depressed at school. Since that time a number of studies have documented the negative consequences of victimization-self-blame linkages (e,g, Graham et al., Reference Graham, Bellmore, Nishina and Juvonen2009; Schacter et al., Reference Schacter, White, Chang and Juvonen2015; Yang et al., Reference Yang, McDonald and Seo2022). Graham et al. (Reference Graham, Bellmore, Nishina and Juvonen2009) tested whether the victimization-self-blame association was moderated by structural school diversity. In that study, victimization was less related to self-blame in more diverse middle schools. The authors suggested that the greater balance of power in more diverse schools might create enough attributional ambiguity to ward off self-blaming tendencies. All of the studies cited above used cross-sectional or short-term longitudinal designs. The three-year longitudinal design of the current study allowed us to examine change over time in victimization-self-blame associations in schools and classrooms that varied in racial/ethnic diversity.
Victimization and school safety
Feeling safe in school is a critical prerequisite for children’s successful learning, which in part explains why researchers have investigated whether such feelings are associated with peer victimization. A number of studies document associations between being a victim of bullying and feeling unsafe at school (e.g., Williams et al., Reference Williams, Schneider, Wornell and Langhinrichen-Rohling2018; Yang et al., Reference Yang, Lin and Stomski2021). These relations, however, are sometimes nonlinear. For example, the most victimized youth are not always those who feel most unsafe, a single experience with harassment is sometimes more related to feeling unsafe than multiple experiences, and even when rates of victimization decrease, some youth still perceive their school as unsafe (Yablon & Addington, Reference Yablon and Addington2018; Zacharia & Yablon, Reference Zacharia and Yablon2022). In addition, most of the studies are cross-sectional, which means we do not know the longterm effects of victimization on perceived safety.
There is a small literature on racial/ethnic differences in victimization and perceived school safety; but that research is inconclusive (Lacoe, Reference Lacoe2015; Yang et al., Reference Yang, Lin and Stomski2021). Little is known about whether victimization is related to perceived safety among students from different racial/ethnic groups who attend schools that vary in racial/ethnic diversity. Shedding some light on this issue, two prior studies examined the role of school racial/ethnic diversity on sixth grade students’ feelings of vulnerability (Juvonen et al., Reference Juvonen, Nishina and Graham2006; 2018). In both of those cross-sectional studies, students of all racial/ethnic groups felt less vulnerable (safer and less victimized) as school diversity increased. In the research reported here, we build on these earlier findings to examine the longitudinal associations between victimization and perceived safety as a function of racial/ethnic diversity.
The current study
Research on peer victimization has not kept pace with the growing racial/ethnic diversity of our school-aged population. Addressing that gap and to test hypotheses about resilience, the purpose of this research was to examine the protective function of school racial/ethnic diversity, measured structurally and dynamically, on peer victimization and its association with self-blame and school safety. We capitalized on a large and racially/ethnically diverse sample of Black, Latino, Asian, White, and Multiracial youth recruited from 26 middle schools at the start of sixth grade and we followed them for three years until the end of eighth grade.
We focused on early adolescence and the middle school years because this is the developmental period when youth might be most vulnerable to victimization. The transition to middle school is known to be especially stressful because children move from smaller elementary schools with well-established peer groups to typically larger more impersonal middle schools where new social bonds need to be negotiated (Eccles & Roeser, Reference Eccles and Roeser2011). This reestablishment and renegotiation is occurring at a time when the importance of the peer group – that is, finding one’s niche and fitting is – is especially salient. As youth jockey for position in the peer group, bullying others to gain or maintain social status is more acceptable (Hawley & Bower, Reference Hawley, Bower, Bukowski, Laursen and Rubin2018, Juvonen & Graham, Reference Juvonen and Graham2014). Bullies probably enjoy more popularity during early adolescence than at any other time in development (e.g., Cillessen & Mayeux, Reference Cillessen and Mayeux2004). Early adolescents are also relatively unsympathetic to victims, often believing that they are responsible for their plight (Unnever & Cornell, Reference Unnever and Cornell2003). All of these developmental processes make the experience of victimization in early adolescence particularly risky.
Our sampling plan allowed us to test the effects of structural and dynamic diversity on victimization and adjustment. Regarding structural diversity, the 26 middle schools were recruited such that each of the four major pan- racial/ethnic groups (Black, Latino, Asian, and White) was represented across a continuum of diversity. This representation was used to calculate each school’s diversity as the number of different racial/ethnic groups and the relative size of each. Structural diversity was measured as a time-invariant predictor of victimization and its consequences across the three years of middle school. Regarding dynamic diversity, each middle school student in our sample had a unique class schedule and therefore a unique experience of the racial/ethnic context that may differ (be more proximal) from how they experienced school diversity. Relying on individual students’ course schedules and class rosters, we were able to calculate each student’s average exposure to diversity across their courses. Measured across the three years of middle school, individual exposure to diversity was a time-varying predictor.
Self-report data on peer victimization, characterological self-blame, and school safety were gathered at four time points: Fall and Spring of 6th grade and Spring of 7th and 8th grade. We utilized latent growth modeling in this study to examine a general pattern (trajectory) of change in victimization across the three middle school grades as well as inter-individual heterogeneity in that pattern (Curran & Hussong, Reference Curran and Hussong2003). This analytic approach allowed us to model victimization at the start of middle school (intercept), which may be a critical inflection point, and the rate of change over time (slope). We expected that reports of victimization would be highest at the beginning of sixth grade, when youth have just transitioned to middle school, and then decrease over time as students went from being the youngest to the oldest students in their school (e.g., Pellegrini & Long, Reference Pellegrini and Long2002). We were particularly interested in the effects of structural and dynamic diversity on the pattern of victimization across middle school. We expected a steeper decline across seventh and eighth grade for students in more diverse schools (a time invariant predictor) and for students exposed to more diversity in their courses (a time-varying predictor).
To broaden our set of predictors, we included other time-varying covariates that are known to influence victimization. First, we measured participants’ friendships and the victimization experiences of those friends. Whereas some studies report that students are less victimized when they have friends, other research suggests that having friends who are also victimized is related to more victimization (e.g., Echols & Graham, Reference Echols and Graham2016; Qin et al., Reference Qin, Laninga-Wijnen, Steglich, Zhang, Ren and Veenstra2023; Schacter & Juvonen, Reference Schacter and Juvonen2019 ). We also examined the time-varying role of an instructional practice known as teaming. Most victimization studies take place in school settings but rarely have instructional practices been included in analyses. Teaming refers to students remaining with the same group of classmates for multiple classes, and it is commonly used in middle schools to help create a sense of belonging among students, especially as they transition to the new school environment (McEwin et al., Reference McEwin, Dickinson and Jenkins2003; Thompson & Homestead, Reference Thompson and Homestead2004). However, because teaming restricts students’ exposure to the general student body at their school, it could have negative effects on victims if they have limited opportunity to find a new niche and fit in (Echols, Reference Echols2015). Because we had access to students’ individual class schedules, we were able to test whether teaming was related to more victimization at the start of middle school and over time.
Our second goal was to examine whether the diversity predictors buffered the longitudinal effects of victimization on self-blame in one set of growth models and the longitudinal effects of victimization on school safety in a second set of growth models. Based on previous cross-sectional research (Graham et al., Reference Graham, Bellmore, Nishina and Juvonen2009; Juvonen et al., Reference Juvonen, Nishina and Graham2006, Reference Juvonen, Kogachi and Graham2018), we expected weaker relations over time between victimization and both adjustment outcomes as racial/ethnic diversity increased. For all the analyses, we anticipated stronger effects for dynamic diversity measured at the level of the individual because it more proximally captures students’ experiences with diversity.
Method
Participants
Participants (51.6% female; M = 11.63 years) were drawn from a large longitudinal study of racial/ethnic diversity and social adjustment across three cohorts of approximately 6,000 sixth graders in Northern and Southern California. Students were enrolled in one of 26 schools carefully selected to represent a variety of racial/ethnic compositions, within the constraints of a public school system that is majority Latino. Six schools were diverse such that no single group represented a numerical majority in the population, and members of each of four major pan-racial/ethnic groups (i.e., Asian, Black, Latino, and White) were present in the student population. Ten schools had two large and relatively equal groups (e.g., Latino and Asian) with very few members of other groups. Ten other schools had a clear racial/ethnic majority group with a smaller number of members from each of the other groups. Each pan-racial/ethnic group was a numerical majority in at least two schools. This sampling plan assured that all four pan-racial/ethnic groups were represented across the full school diversity continuum. That is, students from every racial/ethnic group were sometimes a numerical minority, one of two fairly equal-size groups, a numerical majority, or in schools where all groups were relatively evenly represented. To reduce confounds of racial/ethnic diversity with socioeconomic status (SES), schools at the extremes of the SES continuum were avoided; only schools within a 20%–80% range of free or reduced-price lunch eligibility were recruited for the study.
The racial/ethnic composition of the sample is based on student self-report. At each wave of data collection students were asked the question, “What is your ethnic group?” and were instructed to select one of the following 13 options designed to capture the heterogeneity within the major pan-racial/ethnic groups represented in the California school-aged population: Native American, Black/African American, Black/other country of origin, East Asian, Latino, Mexican/Mexican American, Middle Eastern, Pacific Islander (including Filipino), South Asian, Southeast Asian, White, Multiethnic/biracial, and Other. For this study, some groups were combined (Black/African American and Black/other country of origin, East Asian and Southeast Asian, and Latino and Mexican/Mexican American). Given the relatively small number of participants who self-reported as Native American, Middle Eastern, Pacific Islander, and South Asian (approximately 2% of participants from each wave), these students were combined and included in the “Other” category. Participants who selected “Multiethnic/biracial” were asked to specify their response. Race/ethnicity was aggregated across waves. Students were assigned a monoracial category if they selected the same monoracial response at each wave. Students who selected “Multiethnic/biracial” at any wave or selected more than one monoracial category at any wave were categorized as Multiethnic/biracial. The overall racial/ethnic breakdown of the sample was, 31.6% Latino/Mexican, 19.6% White, 17.4% Multiethnic/biracial, 13% East/Southeast Asian, 10.9% Black, and 6.9% Other. These distributions varied by no more than two percentage points across any wave.
Procedure
Beginning in the fall of 2009, research assistants visited sixth grade classrooms in participating schools and made a brief presentation before handing out parental consent forms and informational letters explaining the study. To increase participation, students who returned consent forms (either allowing or not allowing study participation) were entered into a raffle for a $50 gift card. Recruitment rates ranged from 63% to 95% (M = 82%) across the three cohorts of students beginning in the 2009–2010 school year and continuing into the 2010–2011 and 2011–2012 school years. Participation rates ranged from 74% to 94% (M = 83%).
During a single class period, students recorded their answers independently on a paper-and-pencil survey as they followed instructions being read aloud by a graduate research assistant who reminded them of the confidentiality of their responses. A second researcher circulated around the classroom to help students as needed. This procedure was repeated in the spring semester of sixth grade and again in the spring semesters of seventh and eighth grades for a total of four waves of data. Students were given an honorarium of $5 for completing the questionnaire at Waves 1 and 2 in sixth grade and an honorarium of $10 for waves 3 and 4 in seventh and eighth grades. This study was conducted in compliance with all ethical guidelines for research with human subjects and approved by the Institutional Review Board at UCLA (Protocol ID: 11-002066).
Measures
Victimization
At each wave, students were presented with a series of opposing statements and instructed to first choose which statement better described them and then choose whether the statement they selected was really true for them or sort of true for them. Each set of statements described students who either were or were not victimized. For example, “Some students are often picked on by other kids, but other students are not picked on by other kids.” The four items included in the survey were adapted from the Peer Victimization Scale (Neary & Joseph, Reference Neary and Joseph1994) using the format of Harter’s Self-Perception Profile for Children (Harter, Reference Harter1985). Responses were scored on a 4-point scale (reverse coded if necessary) and then averaged. The same set of items was used at each wave (M = 1.84–1.98, SD = .75–.83) and had good internal consistency (α ranging from .77–.79).
Characterological self-blame
Attributions for experiences with victimization were assessed through vignettes. The vignettes – which were based on hypothetical incidents of victimization – changed at each wave but the attribution items and response options remained the same. For example, in one vignette students were asked to imagine they had been humiliated in front of their peers at lunch. In another vignette students were asked to imagine they had been the target of a nasty rumor. Students were presented with 17 statements (adapted from Graham & Juvonen, Reference Graham and Juvonen1998) assessing different types of causal attributions and asked whether they would think that if the situation had happened to them (1 = definitely would think, 5 = definitely would NOT think). Responses to the six statements that implicated the self (e.g., “This sort of thing is more likely to happen to me than to other kids”) were averaged and used to create a subscale of characterological self-blame (M = 2.40–2.61, SD = .92–.95). These items had good internal consistency at each wave (α ranging from .79–.84).
School safety
Four items adapted from the Effective School Battery (Godfredson, Reference Godfredson1984) assessed perceptions of safety at various places in school (e.g., “How often are you afraid that someone will hurt or bother you in your school restrooms?”). Two items were reverse coded and responses (1 = always, 5 = never) to all four items were averaged at each wave (M = 4.17–4.22, SD = .63–.66; α ranging from .61 to .74).
Structural school diversity
School racial/ethnic diversity was based on data collected from the California Department of Education, and a diversity value for each school was calculated using Simpson’s (Reference Simpson1949) diversity index:
 $$ D_{S}=\sum _{i=1}^{g}p_{i}^{2}, $$
where p is the proportion of students in school S who were in racial/ethnic group i. This proportion was squared, summed across g racial/ethnic groups, and then subtracted from 1. Values could range from 0 to 1, with higher values indicating greater diversity at school (i.e., more racial/ethnic groups that are relatively evenly represented with no clear numerical majority). Substantively, the diversity index represents the probability that any two students drawn randomly from the same school would be from different racial/ethnic groups. D S ranged from .42 to .79 (M = .63, SD = .09) and was treated as a fixed covariate in the analytic models described below since D S scores varied by no more than .02 on average between adjacent waves at the same school.
Dynamic classroom diversity
Because students changed classrooms for each course throughout the school day, and the racial/ethnic composition of any given classroom could differ from the racial/ethnic composition of the school, a unique classroom diversity score was also calculated for each student at each wave. Class schedules for all participants, including academic courses and electives, were obtained from school records. Because we had excellent participation rates across the 26 schools (M = 83%), we had good estimates of the self-reported race/ethnicity of each student in a given course. Simpson’s (Reference Simpson1949) diversity index was adapted as follows:
 $$ D_{C}=\sum _{i=1}^{g}p_{i}^{2}, $$
where p was the proportion of students in classroom C who were in racial/ethnic group i. This proportion was squared, summed across g racial/ethnic groups, and then subtracted from 1. Values could range from 0 to 1, with higher values indicating greater diversity. D C ranged from .00 to .82 or .83 (M = .65–.67, SD = .12–.13) at each wave. A mean score was calculated for each student representing average exposure to racial/ethnic diversity across the school day. D C scores varied considerably between adjacent waves even for students at the same school (M dif = .09, SD dif = .09); thus, D C was treated as a time-varying covariate in the analytic models described below.
Number of friends
As part of a larger peer nomination protocol administered at each wave, students were instructed to record the names of their good friends in the same grade at their school. Students were allowed to nominate as many friends as they desired (M = 2.45–3.08, SD = 1.77–2.10). Inasmuch as previous research suggests that having friends is negatively associated with victimization over time (Sentse et al., Reference Sentse, Dijkstra, Salmivalli and Cillessen2013), number of friends was included as a time-varying covariate in the analyses described below.
Victimization of friends
Previous research also suggests that youth who are victimized may be more likely than other youth to have victimized friends, and having victimized friends may be a risk factor for youth’s own victimization (Hodges et al., Reference Hodges, Malone and Perry1997; Qin et al., Reference Qin, Laninga-Wijnen, Steglich, Zhang, Ren and Veenstra2023). For this reason, the average victimization score (described above) for participants’ nominated friends at each wave was also included as a time-varying covariate (M = 1.82–1.96, SD = .52–.58).
Proportion same-race/ethnicity classmates
Numerical racial/ethnic group representation has been linked to victimization in that students are more likely to report being bullied when their group is a numerical minority in the school (e.g., Graham et al., Reference Graham, Bellmore, Nishina and Juvonen2009). Thus, the relative size of each participant’s racial/ethnic group was included as a time-varying covariate in all analyses. Using students’ self-reported race/ethnicity and their class schedules obtained from school records, the proportion of classmates from students’ same racial/ethnic group out of total classmates was estimated for each course in which they were enrolled and then averaged across courses using this formula:
 $$ P_{same}=\sum _{i=1}^{c}{n_{same} \over t}/n_{c}. $$
In the formula above, the sum of same- race/ethnicity classmates n same out of total classmates t across all courses c was calculated for each student i and then divided by the total number of academic courses n c in student i’s class schedule. The resulting proportion score ranged from 0 (no same-race/ethnicity classmates) to 1 (only same-race/ethnicity classmates). Because class schedules are unique to each student, students at the same school who shared the same racial/ethnic background did not necessarily experience the same level of exposure to members of their racial/ethnic group throughout the school day. P same ranged from 0 to .92 across students and waves (M = .14–.15, SD = .13).
Teaming
One final time-varying covariate was included in each model to account for the role of sharing classes with the same classmates throughout the school day on victimization and adjustment over time. Teaming scores at each wave were based on students’ class schedules and calculated using Echols (Reference Echols2015) teaming index:
 $$T = {{\sum {{{{C_x} \cap {C_y} - 1} \over {{C_x} - 1}}} } \over {n{P_2}}},$$
 $$ {\rm where} x=1\ldots n, y=1\ldots n, {\rm and} x\neq y. $$
Using the above formula, the proportion of classmates in each class C x who were also in another class C y was calculated for all possible course combinations in each student’s class schedule. The sum of these proportions was then divided by the total number of possible course combinations n P 2 to create an average proportion of students in each participant’s class schedule that remained the same throughout the school day. The top half of the teaming equation represents the overlap in classmates between any two given courses (e.g., math and social studies) totaled across all possible course combinations (e.g., math and social studies, math and science, social studies and science, etc.). The bottom half of the equation represents the number of possible course combinations when each course is paired with every other course once. Possible scores range between 0 and 1, with scores closer to 1 representing a higher proportion of classmates who remained the same throughout the school day. The teaming index could also be interpreted as the probability that any given classmate in one student’s class would be in all of that student’s classes.
Results
Latent growth modeling (LGM) was used to examine youth’s developmental trajectories of victimization and key adjustment variables throughout middle school as well as to examine differences in these trajectories based on exposure to racial/ethnic diversity in their school and in their classes. One advantage of the LGM approach is the ability to study predictors of individual differences in intercepts and slopes as well as specific points in time (Duncan & Duncan, Reference Duncan and Duncan2009). In other words, both fixed and time-varying covariates can be incorporated into the model to better understand how certain variables exert influence on development. Data were analyzed using the “lavaan” package (Rosseel, Reference Rosseel2012) in R (R Core Team, 2021).
As attrition is common in longitudinal research designs, some participants were lost over time or were absent from school on data collection days. Between fall and spring of sixth grade, participation decreased by 2.6% (n = 157); between spring of sixth grade and spring of seventh grade, participation decreased by 9.8% (n = 569); and between spring of seventh grade and spring of eighth grade, participation decreased by 10.6% (n = 559). Missing data on the key study variables (victimization, self-blame, and school safety) ranged from 3.20% to 8.96% across all waves. full information maximum likelihood (FIML) was used to handle missing data.
Preliminary analyses
In a set of preliminary models, we explored linear and quadratic slopes of victimization across middle school without any fixed or time-varying covariates to understand baseline patterns of victimization over time. We repeated these analyses for the two adjustment variables of interest – characterological self-blame and school safety. The results of these models are displayed in Table 1. In the linear slope only models, victimization decreased over time. In the models with both linear and quadratic slopes, victimization increased slightly and then decreased. Characterological self-blame decreased over time in the model with linear slopes only and in the model with both linear and quadratic slopes. In the latter model, the decrease was sharper at the beginning of middle school and self-blame leveled off by the end of middle school. School safety remained relatively stable over time. However, there was significant variance around the linear slope (such variance being one prerequisite of LGM). There was no significant variance around the quadratic slope.
Table 1. Comparison of intercepts and variances from linear and quadratic growth models

*p < .05.
**p < .01.
***p < .001.
Main analyses
In the set of models described in detail below, latent constructs were used to represent the intercept (starting values) and slope (change over time) of each outcome measure. The purpose of the first analysis was to model the trajectory of victimization in middle school and examine the role of diversity on youth’s experience of victimization across time. The purpose of the next two analyses was to model the association between victimization and two important indicators of adjustment in middle school and examine the moderating role of diversity on these associations over time. Race/ethnicity effects were explored in both sets of analyses. Based on the preliminary findings, both linear and quadratic models were tested for victimization and characterological self-blame. Only a linear model was tested for school safety.
Victimization
In the first analysis, youth’s trajectories of victimization across middle school were examined. Both a linear and quadratic slope model were tested to account for the possibility that individual trajectory lines were nonlinear. In the linear model, the loadings for the intercept factor were all fixed to 1. The loadings for the linear slope model followed an ordered progression with the first loading of the slope factor fixed to zero so that the mean of the intercept factor could be interpreted as the mean of the first timepoint – the fall of sixth grade. Since a one-unit increase in time is typically interpreted as an increase in the predicted outcome for a fixed time interval increase, units of time subsequently corresponded to each wave of data collection measured in years. Thus, the second loading of the slope factor was fixed to .5 (approximately six months after the initial survey), the third loading was fixed to 1.5 (approximately one and a half years later), and the fourth loading was fixed to 2.5.
In the quadratic model, both a linear and quadratic slope were specified. The factor loadings for the linear slope followed the ordered progression described above. The loadings for the quadratic slope were fixed as the squared factor loadings of the linear slope factor. The first loading of the slope factor was fixed to zero, and subsequent loadings were fixed to .25, 2.25, and 6.25, respectively.
In both models, error variances of outcome measures were set to be equal since it was assumed that these would not change over time. As is typical in LGM, the observed intercepts at each wave were constrained to be zero while the latent intercepts were unconstrained to be free (i.e., estimated).
Linear models. Figures 1 and 2 display the LGM of victimization from Wave 1 to Wave 4 with school diversity as a fixed covariate and classroom diversity as a time-varying covariate. As shown in Figure 1, there was a significant negative effect of school diversity on the intercept indicating that school diversity was associated with less victimization, as hypothesized. However, once diversity in the classroom was included as a time-varying covariate at each wave, the effect of school diversity was no longer significant suggesting classroom diversity had a more powerful effect on victimization over time than diversity measured at the school level. School diversity was therefore removed for model parsimony (see Figure 2).

Figure 1. Linear growth model of the role of school diversity on victimization in middle school.
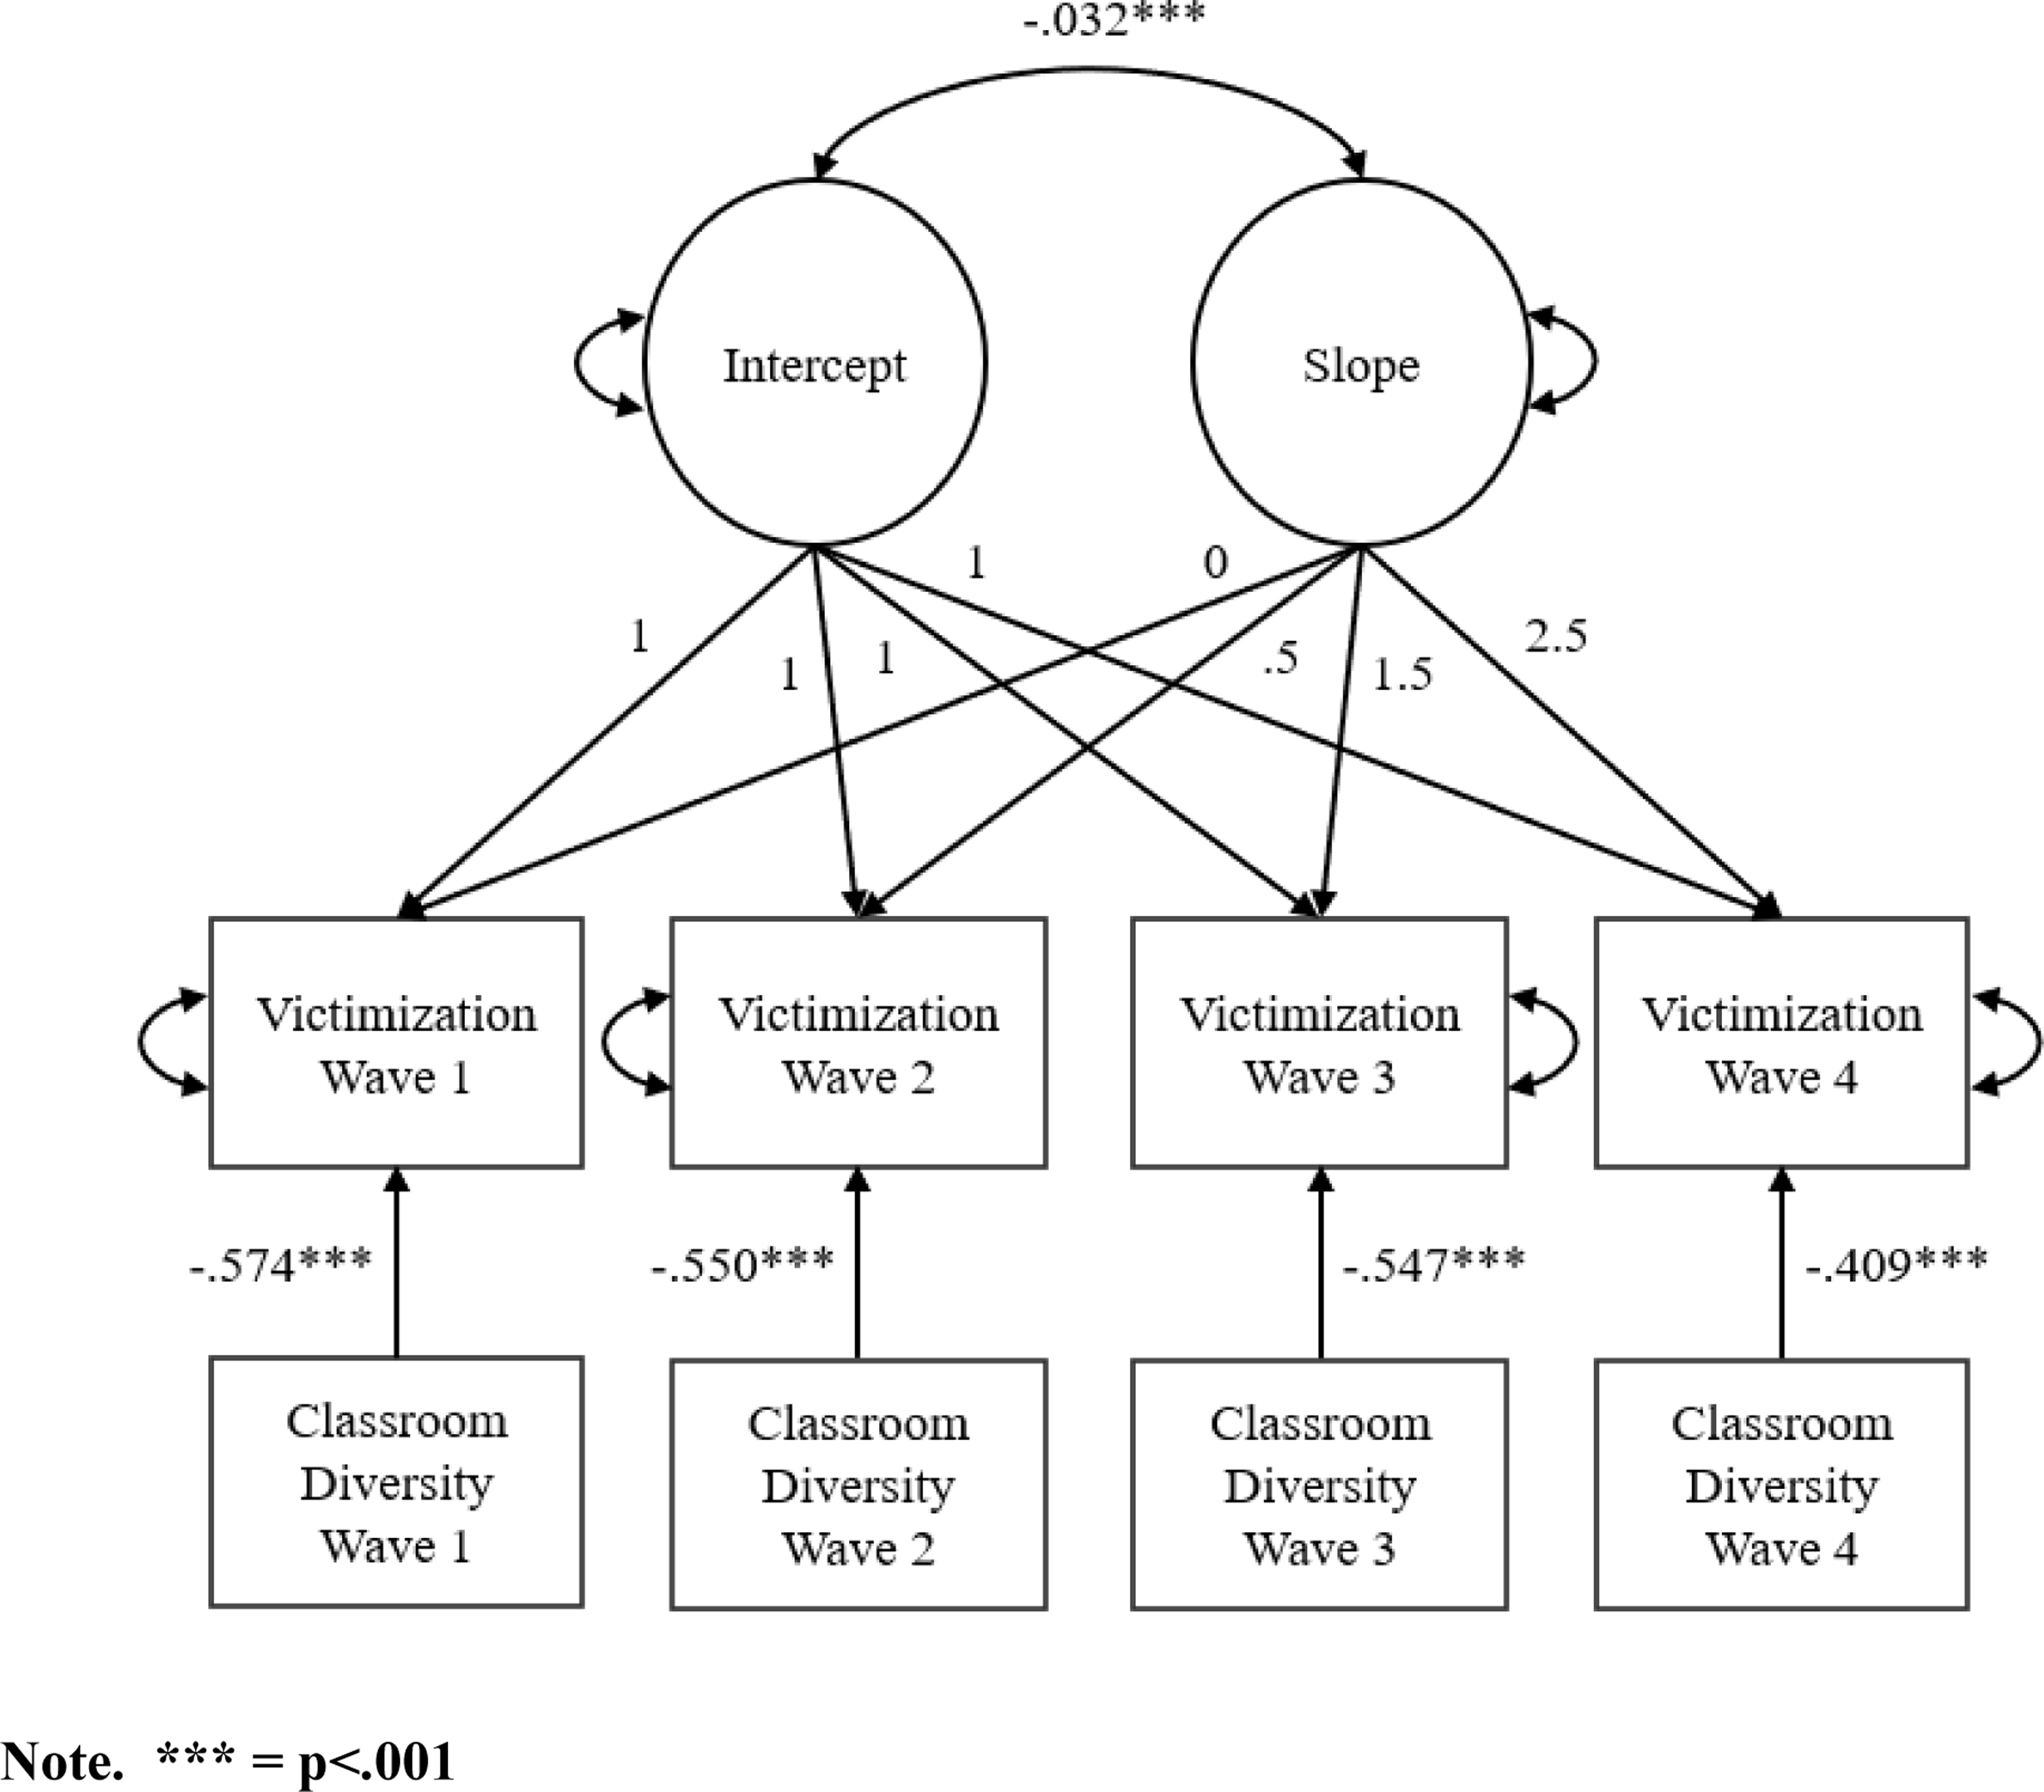
Figure 2. Linear growth model of the role of dynamic classroom diversity on victimization in middle school.
Table 2 displays the results of the linear models with classroom diversity as a time-varying covariate. The latent intercept and slope were both significant – the negative slope indicating that victimization decreased slightly throughout middle school. Variances (which represent differences in individual trajectories) were all significant, justifying the use of LGM. The covariance between the latent intercept and slope was also significant – the negative covariance indicating that youth with higher starting values of victimization experienced less change (e.g., decrease) in victimization over time. In other words, victimization may have been more stable for youth who were more victimized at the beginning of middle school. There was a marginal effect of gender on the intercept suggesting that male youth may have felt slightly more victimized than female youth at the beginning of middle school. There was no effect of gender on the slope indicating that victimization decreased at the same rate for male and female youth.
Table 2. The role of dynamic classroom diversity on victimization in middle school

*p < .05.
**p < .01.
***p < .001.
As hypothesized, dynamic classroom diversity was associated with less victimization at each wave. There was a strong, negative effect of classroom diversity at the beginning of middle school. This effect weakened slightly from Wave 1 to Wave 3 and then weakened more substantially at Wave 4. Thus, classroom diversity was most protective against victimization at Wave 1 when victimization was highest but remained protective throughout middle school (see Table 2 Model 1).
Other significant influences on victimization included victimization of friends, number of friends, and teaming (i.e., sharing classes with the same classmates throughout the school day). Victimization of friends was associated with increases in youth’s own victimization at each wave. The strongest effect was observed at Wave 2. Number of friends was associated with less victimization at Wave 2 only, and teaming was associated with greater victimization at Wave 3 only.
In the second linear model, racial/ethnic differences in the role of classroom diversity on victimization were explored. White youth served as the reference group. All other groups were entered as main effects and in interaction terms with classroom diversity at each wave (see Table 2 Model 2). At Wave 1, Latino youth felt more victimized than other youth. At Wave 2, Black, Latino, Multiethnic, and Other youth felt more victimized, but this effect was buffered by classmate diversity. The same pattern followed for Black and Latino youth at Wave 3 and Latino youth at Wave 4. Thus, classroom diversity appeared to be a protective factor against victimization for ethnic minoritized youth, particularly Latino youth.
Two other covariates had a significant effect on victimization. Victimization of friends was associated with youth’s own victimization at every wave. Proportion of same-race classmates was associated with less victimization at Wave 2 – when all ethnic minoritized youth except Asian youth reported greater victimization.
Quadratic model. In the quadratic model, the same pattern of findings emerged. School diversity was again initially included as a fixed covariate on the intercept and slope but had no effect once classroom diversity was accounted for. Classroom diversity was associated with less victimization at every wave. The effect became stronger over time, peaking at Wave 3, and then decreased substantially at Wave 4. The AIC and BIC values for the linear vs. quadratic models were nearly identical. In addition, the linear slope term in the quadratic model was not significant. The quadratic slope was significant and negative, resulting in a negative growth pattern similar to the linear model reported above. Thus, we chose to focus on the more parsimonious linear model.
Overall, the protective effect of dynamic classroom diversity appeared strongest when students needed it the most. In the linear model, victimization was highest at the beginning of middle school and diversity was most protective. As victimization decreased over time, the effect of diversity weakened. In the quadratic model, victimization increased slightly over time and then decreased. The protective effect of classroom diversity followed the same trajectory, getting stronger over time and then weakening.
Victimization and characterological self-blame
In the next stage of the analysis, we modeled the association between victimization and two important indicators of adjustment in middle school – characterological self-blame and school safety – and examined the moderating role of diversity on these associations over time.
Since the preliminary analysis revealed that both a linear and quadratic growth pattern fit the self-blame data, we tested both linear and quadratic models. Intercept and slope factors followed the specifications detailed above. The same fixed and time-varying covariates were included with the addition of classroom diversity as a main effect and as an interaction effect with victimization because we hypothesized that classroom diversity would moderate the association between victimization and self-blame. In all models, school diversity was again initially included as a fixed covariate on the intercept and slope. There were no effects of school diversity on any intercepts or slopes; thus, only classroom diversity was included in further analyses.
Table 3 shows the moderating role of classroom diversity on the association between victimization and self-blame in middle school (Model 1) and examines differences by race/ethnicity (Model 2). In both models, there was a negative association between the latent intercept and slope suggesting that at higher initial levels, self-blame was less likely to change over time. Female and male youth did not differ on initial levels of self-blame, but females increased in self-blame over time.
Table 3. The role of dynamic classroom diversity on the association between victimization and self-blame

*p < .05.
**p < .01.
***p < .001.
Without accounting for other influences on self-blame, victimization was associated with more self-blame at every wave. With classroom diversity in the model, the main effect of victimization was only marginal at Wave 1 and not significant at all other waves. The effect of classroom diversity on self-blame, however, was significant and negative at every wave (see Table 3 Model 1). This effect got stronger over time but decreased slightly at Wave 4. There was also an interaction effect with victimization at Waves 2 through 4. Students experienced the least self-blame when they were not victimized and in racially/ethnically diverse classes. The protective effect of diversity was weakened by victimization but even students who were moderately victimized reported less self-blame in more diverse classrooms. Only at the highest levels of victimization was classroom diversity no longer protective.
The only significant covariate effect was proportion of same-race classmates which was associated with less self-blame at Waves 2, 3, and 4.
In the quadratic model, classroom diversity was associated with less self-blame at every wave though the effect was only marginal at Wave 1. Otherwise, the same main and interaction effects were observed. The AIC and BIC values for the linear vs. quadratic models were again nearly identical. Thus, we opted for the more parsimonious linear model. Interestingly, in both the linear and quadratic models, the buffering effect of classroom diversity on self-blame got stronger over time, only weakening from Wave 3 to Wave 4.
We next examined differences in the role of victimization and classroom diversity on self-blame by race with White youth serving as the reference group (see Table 3 Model 2). At Wave 1, victimization was associated with sharp increases in self-blame among Multiethnic youth in classrooms with little diversity. In highly diverse classrooms, self-blame increased only slightly as victimization increased. There were no differences by race at Waves 2, 3, and 4 (thus estimates are shown for Wave 1 only and race interactions were removed for Waves 2 through 4). Only one significant covariate effect was observed--teaming was associated with more self-blame at Wave 4 (β = 0.252, p < .05).
In sum, classroom diversity helped reduce self-blame and this effect became stronger over time. Classroom diversity also weakened the association between victimization and self-blame except at the highest levels of victimization. There was only one race/ethnicity effect across all four waves suggesting that classroom diversity is an important protective factor for all middle school youth.
Victimization and school safety
In the final analysis we modeled the association between victimization and school safety and examined the moderating role of diversity over time. As noted above, since the preliminary analysis revealed that only a linear growth pattern fit the data, only a linear model was tested for school safety. The same fixed and time-varying covariates were included as in the previous models. Again, there were no effects of school diversity on any intercepts or slopes.
Table 4 shows the moderating role of classroom diversity on the association between victimization and perceived safety in middle school (Model 1) and examines differences by race/ethnicity (Model 2). In both models, there was a negative association between the latent intercept and slope suggesting that at higher initial levels, school safety was less likely to change over time. Female youth had higher initial levels of school safety but decreased more than males over time. This pattern was observed in both models.
Table 4. The role of dynamic classroom diversity on the association between victimization and perceived safety

*p < .05.
**p < .01.
***p < .001.
Without accounting for other influences on school safety, victimization was associated with decreases in school safety at every wave. Classroom diversity, on the other hand, was associated with greater safety at every wave (see Table 4 Model 1). There was a strong positive effect at Wave 1 that weakened but remained significant over time. With classroom diversity in the model, there was no main effect of victimization on safety at Waves 1 or 2 but there was an interaction effect with classroom diversity. Students felt safest at school when they were not victimized and were in diverse classrooms. The protective effect of diversity was weakened by victimization but even students who were moderately victimized felt safer at school when they were in diverse classrooms. Classroom diversity was least protective at the highest levels of victimization. At Wave 3, the interaction between victimization and classroom diversity was considerably smaller and only marginally significant. However, there was a significant main effect of classroom diversity. At Wave 4 the main effect of classroom diversity and the interaction between victimization and classroom diversity were both significant.
Other significant influences on school safety included number of friends, victimization of friends, and teaming (i.e., sharing classes with the same classmates throughout the school day). Number of friends was associated with more safety at Waves 1, 2, and 4. Victimization of friends was associated with less safety at Waves 1 and 2. Interestingly, teaming was associated with more safety at Wave 1 when students had just started middle school, but by Wave 4 – when students were in their last semester of middle school – it was associated with less perceived safety.
In the next model we examined differences in the role of victimization and classroom diversity on safety by race/ethnicity (see Table 4 Model 2). White youth served as the reference category. At Wave 1, Black and Latino youth felt safer at school when they were in more diverse classrooms. There were no differences by race/ethnicity at Wave 2. At Wave 3, Black, Latino, and Multiethnic youth felt safer at school in more diverse classrooms but only if they were not victimized. When victimized, these youth felt safer in less diverse classrooms. At Wave 4, Other youth were especially likely to feel safe in more diverse classrooms. The covariate effects of number of friends, victimization of friends, and teaming reported above were mostly observed (victimization of friends was significant at Wave 2 and only marginally significant at Waves 1 and 3). To simplify the model presentation, only significant and marginally significant effects were included.
In sum, classroom diversity increased the sense of safety among middle school youth. Classroom diversity also buffered the effect of victimization on safety for all but the most highly victimized youth. And for Black and Latino youth, sense of safety was stronger for victimized youth in less diverse classrooms, which was an unexpected finding. Similar to the self-blame models, there were no effects of school diversity on any intercepts or slopes for school safety, underscoring the importance of exposure to racial/ethnic diversity in the classroom more so than exposure at school more generally.
Discussion
The findings presented here offer new insights into the study of peer victimization in a school-aged population that is becoming more racially and ethnically diverse. School and classroom diversity matter. Together they can operate as protective factors that mitigate the frequency of victimization over the three years of middle school and weaken the links between victimization, characterological self-blame, and school safety. Especially when middle school students were exposed to diversity in their courses, they reported less victimization over time, were less likely to blame themselves for these negative experiences, and to perceive their school as unsafe. The longitudinal impact of structural and dynamic diversity on changes in victimization has not previously been documented. These patterns were also robust across middle school youth of different racial/ethnic groups that also varied in societal status and prestige.
Structural and dynamic school diversity
Both school racial/ethnic diversity measured as a time-invariant predictor and classroom diversity measured as a time-varying predictor based on students’ individual course schedules predicted the slope of victimization and its correlates. But only the classroom measure was associated with adjustment outcomes related to victimization. The role of racial/ethnic diversity is thus better understood as a dynamic construct that changes across time and place. To the extent that researchers have access to students’ course schedules and class rosters with critical demographic information (i.e., race/ethnicity), they can model individuals’ exposure to diversity throughout their school day as a proximal measure of diversity that more accurately represents students’ lived experiences.
What is protective about a racially/ethnically diverse course schedule? Victimization occurs when there is an imbalance of power between perpetrators and victims (Olweus, Reference Olweus1993). We hypothesized that a context with multiple racial/ethnic groups fairly evenly represented creates a numerical balance of power between different racial/ethnic groups. No one group is numerically dominant enough to exert its power over smaller numerical minority groups. Beyond numerical power balance, diverse classrooms also facilitate contact between different groups that can then result in better attitudes about other groups (Paluck et al., Reference Paluck, T Green and Green2019; Pettigrew & Tropp, Reference Pettigrew and Tropp2006). When students feel more positive about diverse outgroup members in their classes, the desire to harass members of those outgroups should decline. Developmental research on social exclusion documents that children and adolescents in diverse contexts are more likely to report that excluding other children from desired activities (a form of relational victimization) is unfair (Killen et al., Reference Killen, Kelly, Richardson, Crystal and Ruck2010). The relationship between intergroup attitudes and the frequency of peer victimization across different racial/ethnic contexts merits further study.
We modeled structural school diversity and dynamic classroom diversity as separate protective factors, but we did not study the interaction between these two predictors. For example, what happens if there is diversity disparity such that classroom exposure to different racial/ethnic groups is less than or more than what would be expected based on the overall diversity of the school? Less diverse classrooms than school suggests that some groups are overrepresented or underrepresented, which could carry its own risks. In earlier cross-sectional research, Juvonen et al. (Reference Juvonen, Kogachi and Graham2018) found that sixth graders who resided in classrooms that were less diverse than their school reported less positive attitudes toward outgoups even as school diversity increased. Such findings alert us to the possibility that the effects of structural school diversity and dynamic classroom diversity are not simply additive. The best case scenario for buffering victimization might well be schools and classrooms that are both high on racial/ethnic diversity. But when students’ exposure to diversity in their classes across time is less than the predicted exposure based on the school diversity, classroom diversity might actually be a risk factor for victimization. The complex interplay between structural and dynamic diversity for understanding victimization and its outcomes is also a topic that is ripe for more research.
The role of other covariates
Was participant race/ethnicity a meaningful predictor?
The answer to this question is probably no. We found few systematic effects of participant race/ethnicity on victimization or its hypothesized outcomes. Black and Latino youth may have reported more victimization than their White peers at some waves, but they also reported feeling safer in school. One unexpected finding was that more victimized Black and Latino youth felt safer in less diverse classrooms, but that pattern was significant only at Wave 3. We are not sure what to make of this finding. Less diverse classrooms could mean that Black and Latino students’ own racial/ethnic group was the numerical majority that provided additional protection against outgroups. Or less diversity could mean that other racial/ethnic outgroups were the numerical majority and offered protection from ingroup derogation. More research on specific configurations of different racial/ethnic groups and whether the perpetrators of victimization are ingroups or outgroups will be needed to address this question.
Regarding measurement of school safety, scholars have recently critiqued these measures for being too colorblind; that is, not sufficiently capturing the racialized experiences of Black youth in particular (Edwards, Reference Edwards2021). This may be the time to re-think whether very general school climate measures are sufficiently nuanced and sensitive to the role of race/ethnicity in what it means to feel safe at school. In general, however, most race/ethnicity effects in the current research were weakened as classroom diversity increased. Nor was there much effect of number of same-race/ethnicity peers in one’s classes. We believe that it is much more fruitful to focus on race/ethnicity within context than on the experiences of different racial/ethnic groups per se. We focused on the meaningful context variable of school and classroom diversity. Other context variables such as the diversity of the neighborhood or larger community also can provide valuable nuance (Nishina & Bellmore, Reference Nishina, Bellmore, Bukowski, Laursen and Rubin2018).
Friendships as protection and risk
Having more friends was associated with feeling less victimized and safer in school, especially in the earlier waves. This pattern is consistent with research on the protective role of friendships. Having even one friend can buffer the negative mental health consequences of victimization, including depression and internalizing symptoms (e.g., Kochel et al., Reference Kochel, Bagwell, Ladd and Rudolph2017). A friend can provide the needed support and resources for youth who may be feeling the most vulnerable.
But that is only part of the story. Having friends who were themselves victims mitigated their protective role. We found that victimization of friends was associated with youth’s own victimization at all waves and with less perceived safety during sixth grade (Waves 1 and 2). Thus, it was only helpful for vulnerable youth to enlist new friendships as they transitioned to middle school if those friends were not themselves victimized.
Such findings highlight some of the complexities associated with studying whether victimized friends help or hinder the adjustment of victimized youth. Some recent studies report that having victimized friends has some advantages. For example, Qin et al. (Reference Qin, Laninga-Wijnen, Steglich, Zhang, Ren and Veenstra2023) found that middle school students experienced increases in victimization as friends’ victimization increased, but they also felt less depressed. Similarly, Schacter and Juvonen (Reference Schacter and Juvonen2019) found that middle school students were less likely to endorse characterological self-blame if their friends were also victimized, suggesting that sharing a social plight with others allows for attributions that do not implicate the self (“it’s not just me”). In the current study, friendships did not influence the relation between victimization and self-blame, perhaps because of the strong effects of classroom diversity. We suggested earlier that diversity may create enough attributional ambiguity to ward off self-blaming tendencies (Graham et al., Reference Graham, Bellmore, Nishina and Juvonen2009). Perhaps the combination of greater racial/ethnic diversity and the presence of friends who are also targets of peer harassment fosters causal appraisals of victimization that are not internal to the self.
Teaming may not help
We modeled an instructional variable not often included in victimization research, but one that may shed light on grouping practices that could have unintended negative consequences. Teamed students share the majority of their classes together, which has the effect of restricting their daily exposure to the larger community of same-grade peers. In previous research, Echols (Reference Echols2015) found that teaming was related to increased victimization over the course of sixth grade for students already unpopular among their peers. Thus teaming offered few opportunities for disliked students to escape their social status and get a “fresh start” with a new set of peers. In the current study, there were modest teaming effects suggesting increased risk across time. Teaming was related to more victimization in seventh grade and less perceived safety in eighth grade. One testable hypothesis is that instructional teaming could have positive social consequences for vulnerable youth if it aligns with racial/ethnic diversity goals. In other words, the cohort of classmates with whom each student travels throughout the school day should be racially/ethnically diverse to the extent possible. We suspect that this pattern of grouping practices would be protective for youth at risk for victimization.
Limitations and future directions
While this article makes a significant contribution to the peer victimization literature, we also acknowledge its limitations. First, the self-report measure of victimization used here did not model different forms of victimization (e.g., physical, relational, verbal). These different types were aggregated in the 4-item measure that is widely used in victimization research. Prior longitudinal research indicates that frequency more than form shapes victimization patterns (Haltigan & Vaillancourt, Reference Haltigan and Vaillancourt2018; Nylund et al., Reference Nylund, Bellmore, Nishina and Graham2007). However, because relational victimization may increase during adolescence relative to the physical or verbal type, future longitudinal research should more systematically model forms as well as frequency of victimization.
Second, and also in part related to measurement of victimization, our research did not address intersectionality of multiple social identities. We studied how race/ethnicity affected victimization patterns and its outcomes, but our measure did not specify the reason for the harassment. We know that multiple (sometimes stigmatizing) social identities place youth at risk for being bullied, including race/ethnicity and also gender conformity, sexual orientation, social, class or weight (e.g., Bucchianeri et al., Reference Bucchianeri, Eisenberg and Neumark-Sztainer2013). A growing body of research indicates that sexual minority adolescents are the group most vulnerable to peer victimization, especially when they are also members of racial/ethnic minoritized groups. (Jackman et al., Reference Jackman, Kreuze, Caceres and Schnall2020; Jackson et al., Reference Jackson, Harvey, Watson, Pereira and Clark2023) Our findings suggested that race/ethnicity of participants was not a major determinant of victimization in diverse classes. Whether structural and dynamic school racial/ethnic diversity in schools are powerful enough to buffer the experiences of victimized youth with multiple stigmatizing identities is an important topic for future research.
Third, our measure of characterlogical self-blame was based on participants’ responses to hypothetical vignettes. Students were presented with a different vignette at each of the four data collection waves to which they reported what they would think if the situation actually happened to them. The four vignettes, although different, were developmentally appropriate in that each depicted typical experiences of victimization during early adolescence such as being pushed around, made fun of, gossiped about, or called bad names. We used different vignettes to better capture this range of experiences and to avoid biases that could arise when participants respond to the same vignette over repeated assessments. We acknowledge, however, that we do not know whether particular vignettes elicited a particular type of responding. We also acknowledge the need for more creative methods beyond hypothetical vigettes, such as daily diaries or experience sampling, that come closer to capturing actual victimization experiences as they unfold (e.g., Nishina & Juvonen, Reference Nishina and Juvonen2005).
A fourth limitation is that we focused on one social cognitive construct (self-blame) related to mental health and one school climate construct (perceived safety) that might partly explain victimization patterns over the middle school years. There are other attributions (see next section) as well as different mental health challenges such as internalizing problems and parent-child relationships that could be predictors of victimization patterns (e.g., Troop-Gordon, Reference Troop-Gordon2017. We focused on self-blame because of the theoretical link between attributions and peer victimization (Graham & Juvonen, Reference Graham and Juvonen1998) and on school safety because it has an empirical base in bullying research that attempts to uncover the school experiences of vulnerable youth (Bradshaw et al., Reference Bradshaw, Bradshaw, Espelage and Nation2021). We included covariates less studied in victimization research such as the victimization of friends and academic teaming, both of which contributed to a more nuanced portrait of peer harassment during middle school. We acknowledge that future longitudinal studies should incorporate more of the known predictors of victimization and recruit samples with the statistical power to examine multiple covariates simultaneously.
Fifth, our research was carried out in the state of California – one of the most racially/ethnically diverse states in the U.S. Latinos are already the numerical majority racial/ethnic group, surpassing Whites, and Asians are the fasting growing group (U.S. Census Bureau, 2020). With its own unique demographic transformation, California is an ideal setting for testing hypotheses about the protective role of school racial/ethnic diversity. Whether our findings can be replicated in other parts of the U.S. with different racial/ethnic configurations remains to be seen. Perhaps insights from California can serve as a model for school-based research in states that are just now experiencing unprecedented growth in racial/ethnic diversity.
Extending beyond our borders to, for example, the European context, migration patterns have also resulted in a dramatic increase in racial/ethnic diversity. The relations between school diversity and peer victimization are especially complex in that context and it is less clear whether more diversity is protective, especially for immigrant-origin youth (Basilici et al., Reference Basilici, Palladino and Menesini2022). Many factors shape the experiences of immigrant and nonimmigrant youth in European schools, including the sociopolitcal climate and historical attitudes toward immigration. Research confirms that peer relations in school are an important context for studying resilience of immigrant-origin youth (Motti-Stefanidi et al., Reference Motti- Stefanidi, Pavlopoulos and He2021). These settings are an ideal context for studying cross-cultural generality or specificity of dynamic diversity as a protective factor.
Implications for practice, intervention, and policy
We documented that school diversity, measured structurally and dynamically, matters for studying factors that might prevent victimization and buffer its negative impact. Harnessing the power of diversity might be especially important at a school transition when youth must establish new social ties and the most vulnerable youth may have the fewest protective resources. While structural diversity may be hard to alter, dynamic diversity at the level of course-taking is amenable to change. Findings such as these are therefore particularly relevant for middle school administrators (e.g., counselors) who are in the best position to maximize the diversity available to students in the same school.
If a central component of racial/ethnic diversity is a balance of power between different groups, then researchers and practitioners should consider other ways to achieve that balance. For example, research on egalitarian versus hierarchical classrooms has been linked to peer victimization. Egalitarian classrooms are those in which popularity is distributed fairly evenly across classmates (most students are average in popularity) whereas in hierarchical classrooms, popularity is clustered among few people at the top who exert power over others to maintain their privileged status (e.g., Ahn & Rodkin, Reference Ahn and Rodkin2014). It has been documented that bullying is less likely to occur in more egalitarian classrooms (Laninga-Wijnen et al., Reference Laninga-Wijnen, Harakeh, Garandeau, Dijkstra, Veenstra and Vollebergh2019). Equipping teachers with the knowledge and skills to shape the social ecology of the classroom could help them organize their classrooms and the activities within them in ways that promote social balance. In other words, teachers could use their invisible hand (Farmer et al., Reference Farmer, Lines and Hamm2011) to shape peer relations including reducing or preventing victimization.
To complement efforts to reorganize the classroom ecology or universal interventions that target everyone, approaches are needed that specifically target victims of bullying and ways to alleviate their pain. Our diversity protective factors were least effective for youth who started out high in victimization and decreased less over the middle school years. If the most vulnerable victims are more likely to blame themselves for their social plight, then one intervention approach might be to change maladaptive self-blame attributions to more adaptive causal appraisals that are not perceived as internal, stable, and uncontrollable. For example, attributions that are unstable (e.g., “I was in the wrong place at the wrong time” or external (e.g., many kids in my school get picked on, it’s not just me”) are likely candidates. The focus would be on helping students at risk for victimization understand the underlying properties of different causes and how to use informational cues to make adaptive attributions. Interventions to alter dysfunctional causal beliefs of bullies have been successful (Graham et al., Reference Graham, Taylor and Hudley2015; Hudley & Graham, Reference Hudley and Graham1993). In those cases the focus has been on attributions that aggressive youth make about other people. The same underlying principles of attributions change can be applied to victims and the attributions they make about themselves.
This is a critical time for addressing peer victimization in schools and for situating that work within the context of racial/ethnic diversity as a protective factor. Despite the growing racial/ethnic diversity of the school-aged population, in many parts of the country schools are more (re)segregated now than they have been since the landmark 1954 Brown v Board of Education Supreme Court decision outlawing school segregation (Orfield et al., Reference Orfield, Frankenberg, Ee and Ayscue2019). While we were writing this article, the Supreme Court ruling on two affirmative action cases involving higher education was issued. As expected, the conservative Court majority struck down affirmative action and dealt a lethal blow to the belief that the use of race conscious policies to increase diversity in colleges and universities is a “compelling interest.” Race conscious policies to achieve diversity in K-12 schools have not been viewed as a compelling interest in recent Supreme Court decisions (the last one in 2007) as conservative justices questioned whether social science research has adequately justified the use of such policies (Tropp et al., Reference Tropp, Smith and Crosby2007). The most effective antidote to such beliefs that dominate the discourse even today is rigorous empirical research documenting the benefits of school racial/ethnic diversity for all youth (Graham, Reference Graham2018). Our research can help make the point to policy makers that diversity can buffer the experience of the types of victimization that touch the lives of many young people. If embraced, such research can help promote legal options to allow the spirit of Brown to flourish.
Funding statement
This research was supported by grants from the National Science Foundation (No. 0921306) and the National Institute of Child Health and Human Development (1R01HD059882-01A2) to Sandra Graham.
Competing interests
None.


