


Introduction
People struggle to detect lies (Zloteanu et al., Reference Zloteanu, Bull, Krumhuber and Richardson2021), being barely better than chance (Bond & DePaulo, Reference Bond and DePaulo2008), overconfident (DePaulo et al., Reference DePaulo, Charlton, Cooper, Lindsay and Muhlenbruck1997), and truth-biased (Levine et al., Reference Levine, Park and McCornack1999). Most deception research centers on methods of improving deception detection (Hauch et al., Reference Hauch, Sporer, Michael and Meissner2014), but little on how people make veracity judgments.
Deception scholars have long debated how deception should be conceptualized and how deception detection (i.e., veracity judgments) should be measured. Some suggest a binary scale (Levine, Reference Levine2001), a continuum of deceptiveness (Burgoon et al., Reference Burgoon, Buller, Ebesu and Rockwell1994), or several dimensions (McCornack, Reference McCornack1992). Levine (Reference Levine2001) and Levine et al. (Reference Levine, Shaw and Shulman2010) argue that deception is a binary construct and, as such, deception judgments suit a binary decision (lie/truth), and that using a continuous scale confounds various constructs (e.g., moral condemnation and lie importance), and question if gradation of deception is even conceptually sound. Burgoon et al. (Reference Burgoon, Buller, Ebesu and Rockwell1994, Reference Burgoon, Buller, Dillman and Walther1995, Reference Burgoon, Buller, Guerrero, Afifi and Feldman1996), conversely, assert that confounding veracity with other such message features is crucial to the judgment process, and, thus, a continuous scale must be used. Continuous scales capture more variability in responding, and alleviate social norms impinging on expressing strict opinions, although, at the expense of decision clarity (Levine, Reference Levine2001). From an operational perspective, however, judgment accuracy and bias are stable regardless of the approach employed (Levine et al., Reference Levine, Shaw and Shulman2010.
Yet, while the measurement debate continues, few consider how the framing of the event itself may impact judgment, especially if we assume that “detection” per se is difficult if not impossible for judges (Zloteanu et al., Reference Zloteanu, Bull, Krumhuber and Richardson2021). The scarce research on question framing has explored unprompted versus prompted veracity evaluations (Clare & Levine, Reference Clare and Levine2019), phrasing the task as detecting “deception” or “truthfulness” (Masip et al., Reference Masip, Alonso, Garrido and Herrero2009), asking indirect questions (ten Brinke et al., Reference ten Brinke, Stimson and Carney2014), and, as mentioned, using a continuous versus binary scale (Levine et al., Reference Levine, Shaw and Shulman2010). However, the framing of uncertainty in such questions has not been explored.
The psychology of judgment and decision-making has focused on understanding how people make judgments under uncertainty (Fischhoff & Broomell, Reference Fischhoff and Broomell2020; Koehler & Harvey, Reference Koehler and Harvey2004; Tversky & Kahneman, Reference Tversky and Kahneman1974). Verbal and written probabilities can be indicated in many ways (Honda & Yamagishi, Reference Honda and Yamagishi2006; Teigen & Løhre, Reference Teigen and Løhre2017), and there exist multiple uncertainty frameworks (Fox & Ülkümen, Reference Fox and Ülkümen2017; Kahneman & Tversky, Reference Kahneman and Tversky1982; Teigen & Løhre, Reference Teigen and Løhre2017; Ülkümen et al., Reference Ülkümen, Fox and Malle2016). While the terminology may differ, two forms of uncertainty are typically recognized: aleatory (i.e., randomness in an outcome) and epistemic (i.e., missing knowledge) (Fox & Ülkümen, Reference Fox, Ülkümen, Brun, Keren, Kirkeboen and Montgomery2011).
People tend to use phrases like “I am 80% sure…” to describe uncertainty about their own knowledge (i.e., epistemic) and phrases like “There is 80% chance…” to describe their uncertainty about external events (i.e., aleatory). This difference in framing is not simply a linguistic feature but is argued to reflect (and affect) the underlying cognitive (Fox & Ülkümen, Reference Fox and Ülkümen2017; Ülkümen et al., Reference Ülkümen, Fox and Malle2016) and/or motivational (Heath & Tversky, Reference Heath and Tversky1991) process used to make a judgment. Thus, the semantic choice may affect the way people interpret and answer the (veracity) question asked.
Objectives
The study compared how framing a question in terms of certainty or likelihood can impact veracity judgments, adopting the framework of Ülkümen et al. (Reference Ülkümen, Fox and Malle2016). It was predicted that the different framing would influence how judges perceive and answer the task.
Hypothesis 1: The framing of uncertainty—in terms of certainty or likelihood—will affect uncertainty estimates.
Hypothesis 2: The framing manipulation will shift response bias, judgment confidence, and deception detection accuracy.
Method
The study was preregistered. The preregistration document, data, and analysis output can be accessed from https://osf.io/cqjvb.
Participants
The sample size was determined a priori, using MorePower 6.0.4 (Campbell & Thompson, Reference Campbell and Thompson2012). A sample of N = 96 was estimated for a 2 × 2 interaction, at α = .05, power = 80%, and Cohen’s ƒ = .30, and N = 192 for the pairwise comparisons of interest, for a Cohen’s d = 0.40 or ηp 2 = .04. These estimates would also produce evidence at a Bayes Factor (BF) > 10 for both interaction and pairwise comparisons.
A total of 261 participants were recruited using the University’s SONA system. After removing incomplete cases (n = 51), the final sample contains N = 210 (F = 184, M = 25, O = 1; MAge = 26.4, SD = 10.58); Certainty (n = 103) and Likelihood (n = 107). A two-way mixed design was used, with Framing (Certainty vs. Likelihood) as the between-subjects factor, and Veracity (Truth and Lies) as the within-subjects factor. The dependent measures were the uncertainty level, deception detection accuracy, judgment confidence, and response bias.
Stimuli
Twenty videos (10 lies and 10 truths) from the Bloomsbury Deception Set (Street et al., Reference Street, Tbaily, Baron, Khalil-Marzouk, Hanby, Wright and Richardson2011) were used. They are approximately 30-s long. Senders are describing a holiday, and half are lying. The videos are gender-matched per veracity, and no sender was used twice.
Procedure
The study was conducted using the Qualtrics platform. Participants were randomly allocated to either the Likelihood or Certainty condition. This affected the framing of the veracity question. In the Likelihood condition, the question was “How likely is it this person is telling a lie?” whereas in the Certainty condition, it was “How sure are you this person is telling a lie?” They responded by entering a percentage (0–100%). For example, in the “likely” condition, they were asked, “Using a percentage from 0 to 100%, how likely is it this person is telling a lie?” They also rated their confidence using a 5-point scale (1 = Not at all to 5 = Completely). The videos were presented in random order. The task took Med = 18 min (MAD = 3 min).
Ethics
The study was approved by the University’s ethics board and was carried out in accordance with the General Data Protection Regulation, the Data Protection Act (2018), and the Declaration of Helsinki. All participants provided informed consent.
Results
Data coding and cleaning were performed as per the preregistered protocol. Data were analyzed using JASP (JASP Team, 2022). Inferences are made using frequentist and Bayesian hypothesis testing.
Uncertainty framing
After removing outliers (n = 3), a 2(Framing: Certainty vs. Likelihood) × 2(Veracity: Lies and Truths)-mixed ANOVA was conducted on the uncertainty responses. No effect of Framing was found, F(1, 205) = 2.28, p = .132, ηp 2 = .01, 90% CI [.00, .05], BFinc = 0.50 (anecdotal; Jeffreys, Reference Jeffreys1983), with responses in the Certainty (M = 42.86, SD = 10.92) and Likelihood (M = 40.51, SD = 11.43) conditions being similar; Mdiff = −2.35 (SE = 1.56), ds = −0.18, 95% CI [−.42, .06], JZS BF10 = 0.49 (anecdotal). The Veracity effect was significant, F(1, 205) = 59.29, p < .001, ηp 2 = .22, 90% CI [.15, .30], BFinc = 1.03e10 (decisive), with Lies (M = 45.28, SD = 13.83) being given a higher percentage than Truths (M = 38.06, SD = 12.33); Mdiff = 7.24 (SE = 0.94), dav = 0.55, 95% CI [.40, .71], JZS BF10 = 1.04e10 (decisive). The interaction was not significant, F(1, 205) = 1.27, p = .262, ηp 2 = .01, 90% CI [.00, .04], BFinc = 0.27 (substantial). See Figure 1 for details.
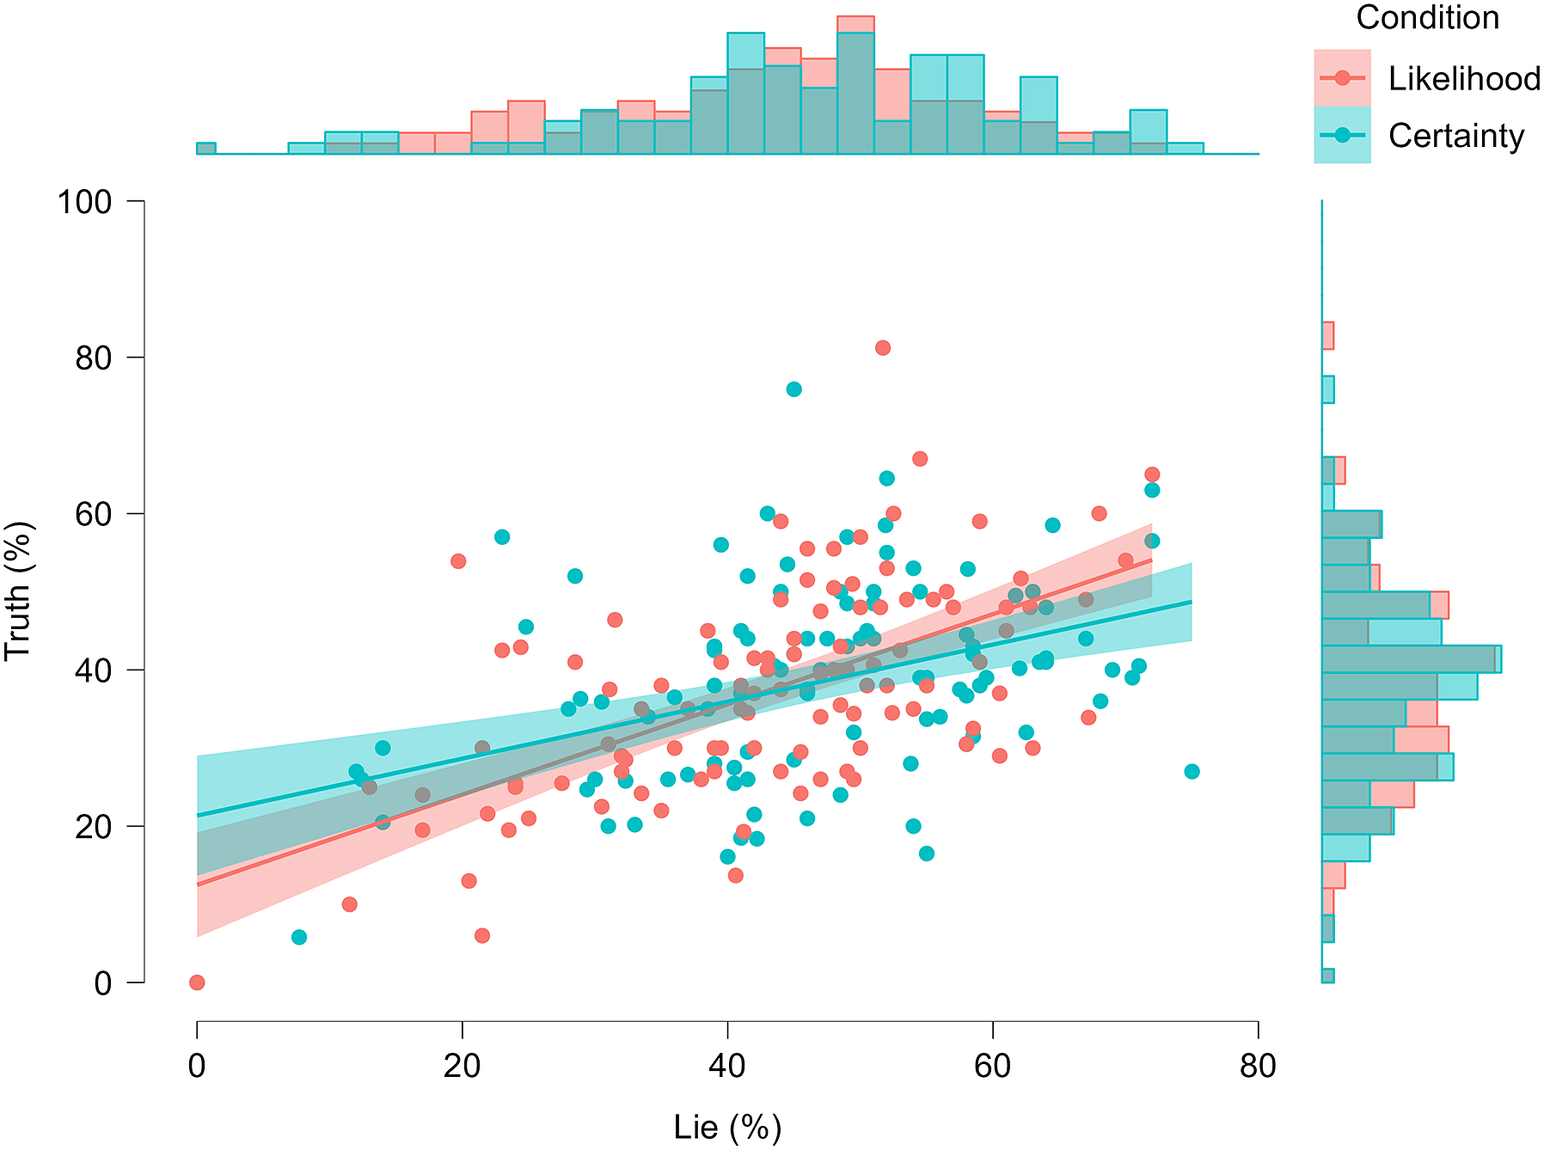
Figure 1. Scatter Plot with Histograms for the Uncertainty Ratings as a Function of Framing and Veracity.
A two one-sided test (TOST) of equivalence (Lakens, Reference Lakens2017) was conducted to discern if the Framing result reflects no effect or insufficient data, given the unclear Bayes Factor. The TOST, using equivalence bounds of ±4.36% (d = ±0.39), yielded a significant result for the lower bound, Δ L, t(205) = −4.32, p < .001, and a nonsignificant result for the upper bound, Δ U, t(205) = 1.29, p = .099. This is interpreted as not equivalent and not different (i.e., insufficient data; Lakens, Reference Lakens2017). However, a Bayesian equivalence test (Morey & Rouder, Reference Morey and Rouder2011) finds strong evidence for the nonoverlapping hypothesis that the effect lies within the equivalence interval, BF∈∉ = 22.73.
Veracity judgments
The uncertainty responses were recoded to create an accuracy score. Values of >50% were taken as a “lie” judgment, <50% as a “truth” judgment, and 50% as “unsure (incorrect).” The judgments were compared to the veracity of each video. If the judgment matched the video veracity, it was taken as “correct” (1); if not, it was taken as “incorrect” (0) and summed per condition.
Deception detection
A mixed ANOVA tested deception detection accuracy (%). The Framing effect was nonsignificant, F(1, 208) = 3.12, p = .079, ηp 2 = .02, 90% CI [.00, .05], BFinc = 0.27 (substantial), with similar accuracy in the Certainty (M = 51.65%, SD = 11.53%) and Likelihood (M = 48.93%, SD = 10.82%) conditions; Mdiff = −2.73% (SE = 1.54%), ds = −0.14, 95% CI [−.29, .02], JZS BF10 = 0.23 (substantial). The Veracity effect was significant, F(1, 208) = 77.10, p < .001, ηp 2 = .27, 90% CI [.19, .35], BFinc = 9.79e19 (decisive) with lies (M = 40.10%, SD = 20.57%) being harder to detect than truths (M = 60.43%, SD = 19.79%); Mdiff = −20.27% (SE = 2.31%), dav = −1.01, 95% CI [−1.25, −.76], JZS BF10 = 9.71e12 (decisive). The interaction was nonsignificant, F(1, 208) = 2.14, p = .145, ηp 2 = .01, 90% CI [.00, .04], BFinc = 0.64 (anecdotal).
Bias
An independent samples t-test compared judges’ response bias between the framing conditions. Bias was computed by classifying each lie response as −1, each true response as +1, and 0 for unsure, which were then summed across trials. A positive total indicates a truth bias, a negative total indicates a lie bias, and 0 represents unbiased.
Bias appears higher (i.e., stronger truth bias) in the Likelihood condition (M = 4.58, SD = 6.65) than the Certainty condition (M = 3.35, SD = 6.07); however, the test was nonsignificant with high uncertainty, t(208) = 1.40, p = .163, Mdiff = 1.23 (SE = 0.88), ds = 0.14, 95% CI [−.08, .46], JZS BF10 = 0.38 (anecdotal). A one-sample t-test revealed that judges were overall truth-biased, M = 3.98 (SD = 6.38), t(209) = −2.10, p < .001, dz = 0.62, 95% CI [.47, .77], JZS BF10 = 4.48e13 (decisive).
An equivalence test, using equivalence bounds of ±2.48 (d = ±0.39), yielded a significant result for Δ U, t(208) = 4.22, p < .001, and a nonsignificant result for Δ L, t(208) = −1.42, p = .078, thus not equivalent and not different. The Bayesian equivalence test, conversely, yielded very strong evidence for the effect lying within the equivalence interval, BF∈∉ = 32.73.
Signal detection theory
The data were also analyzed using signal detection theory (SDT), as this allows the separation of response bias (criterion; c) from accuracy (discriminability; d’). The SDT analysis of discriminability (d’) revealed a similar pattern of (nonsignificant) results for accuracy, but with higher uncertainty, t(208) = −1.88, p = .061, Mdiff = −0.16 (SE = 0.08), ds = −0.26, 95% CI [−.53, .01], JZS BF10 = 1.27 (anecdotal), with similar scores in Certainty (M = 0.08, SD = 0.62) and Likelihood (M = −0.08, SD = 0.60). An equivalence test, using equivalence bounds of ±0.24 (d = ±0.39), yielded a nonsignificant result for Δ U, t(208) = 0.941, p = .174, and a significant result for Δ L, t(208) = −4.71, p < .001, thus not equivalent and not different. The Bayesian equivalence test yielded strong evidence for the effect posterior falling within the equivalence interval, BF∈∉ = 12.86.
The SDT analysis of bias (c) revealed a more uncertain pattern of results that the raw bias results, as the difference between the two framing conditions was significant, tWelch(207.833) = −2.15, p = .033, Mdiff = −0.17 (SE = 0.08), ds = −0.30, 95% CI [−.57, −.02], JZS BF10 = 1.29 (anecdotal), with bias being more pronounced (i.e., a more liberal threshold for classifying a video as truthful) in the Likelihood condition (M = −0.37, SD = 0.61) than the Certainty condition (M = −0.20, SD = 0.57), yet the BF indicates insufficient evidence to make a decisive claim. Indeed, a Bayesian equivalence test finds more of the effect posterior falling within the equivalence interval than outside it, BF∈∉ = 8.11 (moderate).
Confidence
A mixed ANOVA tested differences in judgment confidence. The framing effect was nonsignificant, F(1, 208) = 0.86, p = .356, ηp 2 < .01, 90% CI [.00, .02], BFinc = 0.39 (anecdotal), with similar confidence in the Certainty (M = 3.40, SD = 0.57) and Likelihood (M = 3.33, SD = 0.47) conditions; Mdiff = −0.67 (SE = 0.72), ds = −0.12, 95% CI [−.38, .14], JZS BF10 = 0.23 (substantial). The veracity effect was nonsignificant, F(1, 208) = 1.80, p = .181, ηp 2 = .01, 90% CI [.00, .04], BFinc = 0.25 (substantial). The interaction was nonsignificant, F(1, 208) = 0.05, p = .825, ηp 2 < .01, 90% CI [.00, .01], BFinc = 0.16 (substantial).
A TOST for the framing effect, using equivalence bounds of ±0.20 (d = ±0.39), yielded a significant result for Δ U, t(208) = 1.89, p = .030, and for Δ L, t(208) = −3.74, p < .001. This is interpreted as statistically equivalent and not different. Likewise, the Bayesian equivalence test finds very strong evidence for the effect lying within the equivalence interval, BF∈∉ = 93.23.
Discussion
Hypotheses 1 and 2 were not supported, with the data showing stronger evidence for no effect of uncertainty framing on veracity judgments. The results contradict Ülkümen et al.’s (Reference Ülkümen, Fox and Malle2016) cognitive processes argument, as framing in terms of epistemic or aleatory uncertainty did not affect judges’ cognition and judgment (cf. Heath & Tversky, Reference Heath and Tversky1991). This interpretation is further backed by the average uncertainty level, 42%, being below the expected 50%, especially in the aleatory (“chance”) framing condition (Fox & Ülkümen, Reference Fox, Ülkümen, Brun, Keren, Kirkeboen and Montgomery2011). Thus, the current framing does not seem to shift probabilistic beliefs from a focus on subjective/internal information to stochastic/external information.
The limitation of the current study is the ambiguity of the data and strength of evidence for several results (e.g., bias). Future research must increase the sample size and investigate other operationalizations of uncertainty, for instance, rephrasing the question to focus on truthfulness (Masip et al., Reference Masip, Alonso, Garrido and Herrero2009), or changing the base rate to match real-world probabilities (Levine et al., Reference Levine, Clare, Green, Serota and Park2014). Additionally, although the veracity framing seems not to affect judges, it may affect listeners, as these seemingly prefer speakers who use certainty instead of likelihood statements (Ülkümen et al., Reference Ülkümen, Fox and Malle2016). However, listeners also misinterpret probability statements based on the perceived information severity and speaker tactfulness (Bonnefon & Villejoubert, Reference Bonnefon and Villejoubert2006). Researchers should investigate the perceived evidentiary value of probabilistic veracity statements if made using certainty or likelihood phrasing. Lastly, the similarity in the confidence ratings and the uncertainty judgments should be explored. These ought to reflect separate constructs (e.g., confidence is a meta-judgment regarding one’s decision), especially in the aleatory condition, yet the substantial overlap suggests that judges view the two as parallel.
Conclusion
Contrary to the focal prediction, uncertainty framing—aleatory or epistemic—did not affect veracity judgments. Either the manipulation was too subtle to be captured by the current data, or the process by which people judge veracity is unaffected by uncertainty framing.
Open peer review
To view the open peer review materials for this article, please visit http://doi.org/10.1017/exp.2023.9.
Data availability statement
The data are available at https://osf.io/cqjvb.
Author contribution
Conceptualization: M.Z.; Data curation: M.Z.; Formal analysis: M.Z.; Investigation: M.Z.; Methodology: M.Z.; Project administration: M.Z.; Writing – original draft: M.Z. designed the study, collected the data, performed the analyses, and wrote the article.
Funding statement
This research received no specific grant from any funding agency, commercial, or not-for-profit sectors.
Competing interest
The author declares none.


 Open access
Comments
Comments to the Author: Please find below my comments on the current version of the ms.
-In the introduction, briefly explain the effects of question framing on veracity evaluations in addition to existing manipulations.
-Please include a description of sample size determination of the preregistration, as this is much clearer than what is included in ms.
-Either include more information about the list of seven deception cues or remove from ms. Currently, it is not clear what these cues add to your message.
-Please include how accuracy scores were calculated under veracity judgments, you do this nicely in the pre-registration.
-I believe that the bias analysis should be conducted following the recommendations of Stanislaw and Todorov (1999). Specifically, see p. 142 on how to calculate response bias (c). “c is found by averaging the z score that corresponds to the hit rate and the z score that corresponds to the false alarm rate, then multiplying the result by negative one.”. Consequently, you must exclude the 50% judgements from the analyses, as these participants fail to make a choice. You can additionally investigate whether the number of unsure judgments differ between framing conditions.
-The confidence analysis seems redundant. You ask participants to provide a percentage, this percentage already shows their confidence. The more extreme, the more confident the participant was. This also shows in your confidence findings, which are identical to the uncertainty framing analyses.