


Introduction
The Japanese Murrelet Synthliboramphus wumizusume; hereafter murrelet) is a small seabird endemic to Japan and South Korea and is listed on the IUCN Red List as globally ‘Vulnerable’ (BirdLife International 2015). With a global population of 2,500–10,000 adults it is the one of the rarest alcids in the world (Carter et al. Reference Carter, Ono, Fries, Hasegawa, Ueta, Higuchi, Moyer, Ochikubo Chan, De Forest, Hasegawa and Van Vliet2002, BirdLife International 2015). The species was designated as a Japanese ’national monument’ in 1972 in recognition of its endemic status and need for protection (Hasegawa Reference Hasegawa, Croxall, Evans and Schreiber1984) but continues to decline and, owing to its rarity, is poorly studied and understood.
Murrelet populations are declining due to terrestrial and marine threats. At monitored breeding sites, human disturbance and predation by introduced rats (Rattus rattus, R. norvegicus) and Carrion and Jungle Crows (Corvus corone, C. macrorhynchus) are apparent threats (Carter et al. Reference Carter, Ono, Fries, Hasegawa, Ueta, Higuchi, Moyer, Ochikubo Chan, De Forest, Hasegawa and Van Vliet2002, Ogi Reference Ogi2008, Croxall et al. Reference Croxall, Butchart, Lascelles, Stattersfield, Sullivan, Symes and Taylor2012). By contrast, the marine threats faced by murrelets are less well known, particularly due to poor data on murrelet at-sea distribution. Accidental bycatch of seabirds at-sea in gillnet fisheries has been identified as a major source of mortality, with alcids the most frequently caught group and the north-west Pacific one of the most high-risk areas (Žydelis et al. Reference Žydelis, Small and French2013). Indeed, the Japanese Murrelet was identified as the second most exposed seabird species to gillnet bycatch in a global assessment (Waugh et al. Reference Waugh, Filippi, Blyth and Filippi2011). Murrelets are taken as bycatch in driftnets and gillnets while foraging near breeding colonies (DeGange et al. Reference DeGange, Day, Takekawa, Mendenhall, Vermeer, Briggs, Morgan and Siegel-Causey1993, Carter et al. Reference Carter, Ono, Fries, Hasegawa, Ueta, Higuchi, Moyer, Ochikubo Chan, De Forest, Hasegawa and Van Vliet2002, Ogi Reference Ogi2008), and also in large-scale squid driftnet fisheries while wintering south-east of Hokkaido (Ogi et al. Reference Ogi, Yatsu, Hatanaka and Nitta1993, Piatt and Gould Reference Piatt and Gould1994). Piatt and Gould (Reference Piatt and Gould1994) estimated that in 1990 and 1991, 1–10% of the adult murrelet population was killed in north-west Pacific drift-net squid fisheries, highlighting the level of threat. In addition to bycatch, murrelets are likely to be threatened by human industrial activities while breeding in Japanese waters, such as oiling and pollution (Camphuysen and Heubeck Reference Camphuysen and Heubeck2001) and wind farm development (Furness et al. Reference Furness, Wade and Masden2013).
To counter such threats, marine conservation in Japan has received increasing attention in recent years. In 2008, the Basic Act on Ocean Policy (Kantei 2007) was adopted, followed by publication of the Marine Biodiversity Conservation Strategy of Japan in 2011 (Ministry of Environment Japan 2011). This government strategy clearly defined Marine Protected Areas (MPAs), and under the definition, legally qualified 8.3% of Japanese waters as MPAs. Japan now seeks to designate an additional 1.7% of its exclusive economic zone (EEZ) as MPAs to meet the Convention on Biological Diversity (CBD) Aichi Target 11 (i.e. to conserve ≥ 10% of biologically and ecologically important national marine areas by 2020 (CBD 2010).
However, the current network of MPAs has received criticism from conservationists and researchers for not adequately representing areas of high marine biodiversity and lacking appropriate management (NACS-J 2012). Since 2010, the Wild Bird Society of Japan (WBSJ) has used BirdLife International’s Important Bird and Biodiversity Area (IBA) criteria to identify a network of sites for the conservation of seabirds and marine ecosystems in Japanese waters. Marine IBAs have been identified in waters around breeding colonies, using radii informed by seabird foraging ranges and distribution at-sea (BirdLife International 2010, Thaxter et al. Reference Thaxter, Lascelles, Sugar, Cook, Roos, Bolton, Langston and Burton2012). Although marine IBAs can be delimited more precisely using methods such as seabird tracking, the seaward extension method is recommended as a simple but effective approach, especially when refined using seabird habitat and oceanographic preferences (Thaxter et al. Reference Thaxter, Lascelles, Sugar, Cook, Roos, Bolton, Langston and Burton2012, Soanes et al. Reference Soanes, Bright, Angel, Arnould, Bolton, Berlincourt, Lascelles, Owen, Simon-Bouhet and Green2016).
To assess and mitigate at-sea threats for seabirds, baseline data on at-sea distribution and marine habitat preferences are essential (Lascelles et al. Reference Lascelles, Notarbartolo Di Sciara, Agardy, Cuttelod, Eckert, Glowka, Hoyt, Llewellyn, Louzao, Ridoux and Tetley2014). However, acquiring these data is challenging for seabirds such as murrelets, for which telemetry studies are difficult (Kissling et al. Reference Kissling, Gende, Lewis and Lukacs2015). As such, we conducted ship-based surveys to model the influence of marine habitat variables on the distribution of breeding murrelets while at-sea. We describe: 1) habitat variables that influence near-colony murrelet distributions; 2) habitat variables that influence foraging murrelet distributions; and 3) the marine habitats of murrelets from different colonies. We use constructed models to predict the extent of murrelet at-sea distribution throughout breeding, and assess the adequacy of the current Japanese marine IBA network to protect the murrelets.
Methods
Survey data collection
At-sea surveys for murrelets were conducted around active colonies in four areas: by the WBSJ at Northern Izu islands and Kojine; by Y. Nakamura at Biroujima; and by H. Sato and S. Mori at Oki (Figure 1). Surveys were carried out from 2008 to 2012 during the breeding season and predominantly in the incubation phase. All surveys remained in the vicinity of murrelet colonies (< 50 km) and, with the exception of two surveys at Biroujima, were conducted in daylight hours (Table 1). Surveys were made from the bow of a boat, travelling at 20 km/hr, by 1–4 observers using binoculars. All diving, floating and flying murrelets were counted within 30 m of the boat on both sides and a 90° arc to the bow. Whenever murrelets were encountered, the GPS position was recorded and with the exception of three surveys, the number of murrelets was counted (Table 1).

Figure 1. Japanese Murrelet breeding colony locations in Japan and at-sea survey data undertaken around colonies at Kojine, Northern Izu islands, Biroujima and Oki. Overlapping density counts appear darker. See Table S2 for colony details.
Table 1. Summary of at-sea survey data for Japanese Murrelets collected during this study.

Night survey data (*), presence-absence data only (†)
Marine habitat data
All data handling and statistical analyses were performed in the statistical software environment program R, version 3.1 (R Development Core Team 2014), mapping was conducted using QGIS 2.0.1 – Dufour (QGIS Development Team 2013). To model murrelet observations in relation to marine habitat, we used a number of physical and environmental variables potentially correlated with seabird distribution and abundance (Table S1 in the online supplementary materials) (Louzao et al. Reference Louzao, Bécares, Rodríguez, Hyrenbach, Ruiz and Arcos2009, Oppel et al. Reference Oppel, Meirinho, Ramírez, Gardner, O’Connell, Miller and Louzao2012). Static variables, bathymetric depth (BATHY), seabed slope (SLOPE) and minimum distance to land (D_LAND), were extracted or calculated from the GEBCO 30 arc-second global bathymetry and topography grid (GEBCO 2014). As central-place foragers, the marine habitat accessed by breeding seabirds is heavily influenced by distance from the breeding colony (Grecian et al. Reference Grecian, Witt, Attrill, Bearhop, Godley, Grémillet, Hamer and Votier2012, Oppel et al. Reference Oppel, Weber, Weber, Fox, Leat, Sim, Sommerfeld, Bolton, Broderick and Godley2017). We compiled a list of all known murrelet breeding localities in Japan (Table S2) and calculated a ‘minimum distance to colony’ layer (D_COL) in order to quantify the constraints of central place foraging. Unfortunately, population estimates are unavailable for almost all colonies (but see Carter et al. Reference Carter, Ono, Fries, Hasegawa, Ueta, Higuchi, Moyer, Ochikubo Chan, De Forest, Hasegawa and Van Vliet2002) and thus the impact of intra-specific competition (Lewis et al. Reference Lewis, Sherratt, Hamer and Wanless2001, Wakefield et al. Reference Wakefield, Owen, Baer, Carroll, Daunt, Dodd, Green, Guilford, Mavor, Miller, Newell, Newton, Robertson, Shoji, Soanes, Votier, Wanless and Bolton2017) could not be modelled.
Oceanographic variables sea surface temperature (SST) and chlorophyll-a concentration (CHLA) were created from MODIS Aqua and Terra level 2 satellite image products, downloaded via the OceanColor data portal (http://oceancolor.gsfc.nasa.gov). MODIS level 2 Local Area Coverage (L2_LAC) images are available every 1–2 days with an approximate spatial resolution of 1 km but require quality-control processing to remove suspect pixels (Oceancolor 2015). We used ESA BEAM software (BEAM 2014) to georeference and apply quality-control flags to MODIS L2 imagery, processing images to level 3 quality, while maintaining the ∼ 1 km spatial resolution. Standard level 3 imagery has 17 L2 quality-control flags applied to mask pixels, however we included two types of flagged data: HILT (Observed radiance very high or saturated) and STRAYLIGHT (Straylight contamination is likely) because omitting these would have masked out too many pixels in near-shore areas where murrelet surveys took place. We created composite images by averaging temporally consecutive data together, to account for cloud covered pixels in L2_LAC imagery and previous observations that seabird distribution is rarely related to concurrent conditions in SST and CHLA (Louzao et al. Reference Louzao, Bécares, Rodríguez, Hyrenbach, Ruiz and Arcos2009, Oppel et al. Reference Oppel, Meirinho, Ramírez, Gardner, O’Connell, Miller and Louzao2012). Composite CHLA and SST images were created for each unique survey, by averaging all processed images falling within the period of the survey and the three months preceding. A three-month composite window was used following Lavers et al. (Reference Lavers, Miller, Carter, Swann and Clarke2014) to characterise the broad oceanographic conditions of the murrelet incubation period, and to account for the time needed for energy to flow from remotely-sensed primary productivity to higher trophic levels, which constitute seabird prey (Wakefield et al. Reference Wakefield, Phillips and Matthiopoulos2009). Gradient variables (G_CHL and G_SST) were created from the corresponding CHLA and SST composites, using the 3 x 3 pixel moving window to identify areas of rapid change between neighbouring pixels. All created environmental variables were stored as layers with 1-km cell size using package ’raster’ (Hijmans et al. 2014).
Survey data processing and extraction
Although standardised survey protocols have at times been adhered to around Biroujima and Northern Izu island colonies, combined multi-year datasets represent a number of survey methodologies. To standardise across surveys, we aggregated the murrelet observation data into a spatial grid at 1-km scale (matching the resolution of the environmental variables). For each survey, grid cells overlaying observations of one or more murrelets were attributed with the sum value, and grid cells on the survey route where no murrelets were detected were assigned ‘absent’. As survey routes frequently overlapped (occupied the same grid cells) over the multiple years of sampling, murrelets could conceivably be present and absent in the same cell but at different times, allowing for more accurate extraction of temporally dynamic oceanographic variables. With the murrelet data attributed to the 1-km spatial grid we then extracted data from each of the habitat variables based on the corresponding timestamp. The marine habitat of murrelets from each of the four sampled colonies was summarised from SST, CHLA, BATHY and D_LAND values in pixels where one or more murrelets were encountered.
The majority of surveys (n = 11) in our dataset included count data, however for some surveys (n = 3) only presence-absence data were available (Table 1). Count data were selected for modelling as the ability to estimate density is useful for understanding and inference in conservation management (Nielsen et al. Reference Nielsen, Johnson, Heard and Boyce2005). Removing presence-absence data also removed the two Biroujima night surveys. Single surveys of colonies were dropped from modelling due to lack of observations (Kojine) or presence and absence only (Oki). The remaining colonies, Biroujima, and the Northern Izu islands, were well surveyed and were modelled separately due to their geographic differences (Figure 1). At-sea observations distant from the colony more accurately reflect preferred habitat for foraging compared to those made near-colony, which are complicated by behaviours unrelated to habitat quality such as transiting to and from the colony and rafting (Wilson et al. Reference Wilson, McSorley, Gray, Dean, Dunn, Webb and Reid2009, Grecian et al. Reference Grecian, Witt, Attrill, Bearhop, Godley, Grémillet, Hamer and Votier2012). Most murrelet observations in our data were made within 20 km of the colony (Figure 1). However, surveys from the Northern Izu Island colonies recorded a second cluster of observations at distances of 20–50 km from the colony (Figure S1). Using the > 20 km distance from colony threshold, we took a subset of the Northern Izu Island dataset to represent counts of murrelets that were free of near-colony behaviours and more likely to accurately represent preferred foraging habitat.
Statistical modelling
Before constructing models, predictor variables were tested for multicollinearity. We calculated a Pearson’s correlation score for all possible pairs of variables, using a value of 0.5 and above to identify significantly correlated variables (Dormann et al. Reference Dormann, McPherson, Araújo, Bivand, Bolliger, Carl, Davies, Hirzel, Jetz, Daniel Kissling, Kühn, Ohlemüller, Peres-Neto, Reineking, Schröder, Schurr and Wilson2007). CHLA was significantly correlated with G_CHL and D_COL was significantly correlated with D_LAND, correlated variables were not used together in the same model. Three density models were implemented: ’Biro colony’, using the full Biroujima dataset; ’Izu colony’, using the full Northern Izu Islands dataset; and ’Izu foraging’, using a subset of the Northern Izu Islands dataset for observations > 20 km from the colony. Murrelet counts were fitted as a response using a generalized linear mixed model (GLMM) framework, in package ’lme4’ (Bates et al. Reference Bates, Maechler, Bolker and Walker2015). Survey was used as the random intercept to account for differences between surveys, such as weather or observation team (Zuur et al. Reference Zuur, Ieno, Walker, Saveliev and Smith2009). We calculated the area of each 1-km grid cell covered by each survey (between 0.001 and 1 km2) and included this as an offset term to account for differences in survey effort between cells. The Izu foraging model was modelled using a Poisson error distribution but the Izu and Biro colony models were over-dispersed due to zero-inflation and modelled using a negative binomial error distribution (Zuur et al Reference Zuur, Ieno, Walker, Saveliev and Smith2009). The Izu and Biro colony model terms were selected using forward selection, starting with D_COL, then Month and Year (including interaction terms) and then adding additional environmental variables in turn. The Izu foraging model was built using backward and forward selection, as all variables were assumed to have equal potential influence further from the colony. The support for addition (or removal) of model terms was based on likelihood ratio tests (χ2) and confidence intervals (Bolker et al. Reference Bolker, Brooks, Clark, Geange, Poulsen, Stevens and White2009). We checked model residuals for spatial autocorrelation by calculating Moran’s I values over distances: 1–100 km in the package ’ncf’ (Bjornstad Reference Bjornstad2015) but found no evidence of significant spatial autocorrelation. Goodness-of-fit was assessed for GLMMs split into marginal (var. explained by fixed effects) and conditional (var. explained by fixed + random effects) pseudo R2 components (Nakagawa and Schielzeth Reference Nakagawa and Schielzeth2013), in package ’piecewiseSEM’ (Lefcheck Reference Lefcheck2016). Predictive performance was assessed using Pearson’s and Spearman’s rank correlation coefficients between observed and model-predicted murrelet counts (Potts and Elith Reference Potts and Elith2006). Predictive performance was calculated for each model predicting upon its training dataset, and additionally for Biro and Izu colony models, predictive performance was assessed for each model predicting to the other colony.
Spatial prediction
To assess the adequacy of the current Japanese marine IBA network for breeding murrelets, we used Biro and Izu colony models to predict murrelet at-sea density around all known murrelet colonies (Table S2). We applied a minimum density threshold of 0.5 birds/km2 to model predictions, thereby limiting their extent to areas appropriate for conservation management while protecting core murrelet at-sea densities. For each marine IBA that included a murrelet breeding colony, we calculated the proportion of model-predicted murrelet at-sea distribution that was captured within the marine IBA.
Results
Survey results
A total of 3,161 murrelets were recorded in 1,221 at-sea encounters from a total of 3,485 km of surveys undertaken between 2008 and 2012. Murrelets were encountered singularly and in groups of up to 90 individuals with a mean group size of 2.9 ± 4.2 individuals. The Northern Izu islands were the most intensely surveyed location with a total of 2,283 km of surveys; when gridded at 1 km, murrelets were observed in 17% of surveyed cells. 634 km of surveys were undertaken at Biroujima, with 21% of surveyed cells containing murrelets. At Oki 361 km of surveys were undertaken with 6% of surveyed cells containing murrelets. At Kojine 205 km of surveys were undertaken with 3% of surveyed cells containing murrelets. Mean density of murrelets at-sea was highest around Biroujima colony (1.86 murrelet/km2), followed by Northern Izu colonies (1.16 murrelet/km2) and Kojine (0.06 murrelet/km2). Average group size of murrelets was highest at Northern Izu Islands with 3.1 ± 4.7 individuals per group, followed by Biroujima with 2.2 ± 1.6 individuals per group and Kojine with 1.6 ± 0.84 individuals per group.
Marine habitat at different Japanese Murrelet colonies
The marine habitat in which murrelets were observed, differed significantly between the four surveyed colonies by SST (F 3 = 285.2, P = < 0.001), CHLA (F 3 = 862.7, P = < 0.001); BATHY (F 3 = 538.6, P = < 0.001) and D_LAND (F 3 = 368.8, P = < 0.001; Table 2).
Table 2. Oceanographic characteristics of Japanese Murrelet encounter locations around each surveyed colony. SST = sea surface temperature, CHLA = chlorophyll-a concentration, BATHY = bathymetric depth, D_LAND = distance to land.
Variables influencing Japanese Murrelet at-sea density
The at-sea density of murrelets at Biroujima significantly increased closer to the colony (χ2 1 = 108.8, P = < 0.001), at 1 km from the colony mean murrelet at-sea densities ranged from 1.75 to 7 birds/km2 (Figure 2). Their density was dependent on year (χ2 2 = 26.4, P = < 0.001; 2008 being significantly higher than 2009 and 2012) but did not differ between March and April (χ21 = 2.7, P = 0.1). No other environmental variables significantly influenced murrelet density at Biroujima (Table 3). The D_COL and YEAR fixed terms accounted for all variation within the survey random term, giving an identical marginal and conditional R2 of 0.37.

Figure 2. Predicted Japanese Murrelet density (line) and 95% confidence interval (shade) against colony distance at a) the Northern Izu Islands in April (dotted line, darker shade) and May (solid line, lighter shade); and b) Biroujima in 2008 (dotted line, darker shade) and 2009/2012 (solid line, light shade).
Table 3. Selected variables and predictive ability of density models. r is the Pearson’s correlation coefficient and p the Spearman’r rank correlation coefficient between predicted and observed densities, (train) is predicting upon data used in each model’s construction, (test) is predicting upon independent data from the other colony (Biroujima to Izu and vice versa), : denotes an interaction term, all models included a sampling effort offset term. CHLA = chlorophyll-a concentration, D_COL = distance to colony, D_LAND = distance to land.

The at-sea density of murrelets at Northern Izu colonies also increased closer to the colony, at 1 km from the colony, mean murrelet at-sea densities ranged from 3.49 to 6.74 birds/km2 (Figure 2). However, in contrast to Biroujima, where the distribution of murrelet density in relation to colony distance was static over time, the distance at which murrelets were distributed from Northern Izu colonies changed by month (χ22 = 94, P = < 0.001): murrelets were distributed closer to the Northern Izu colonies in May than in April (Figures 2 and 3). However, there were no significant differences in overall murrelet density between April and May (χ2 1= 2.6, P = 0.11), or between 2010 and 2011 (χ2 1 = 1.7, P = 0.20). The Izu colony model had a marginal R2 of 0.42 and conditional R2 of 0.56, indicating that some of the variance in murrelet density was due to survey differences. Additional environmental variables SLOPE (density was higher over shallower seabed slopes; χ2 1 = 9.9, P = 0.002) and G_SST (density higher at more homogeneous SST gradients; χ21 = 4.8, P = 0.028) also significantly influenced murrelet density at Northern Izu colonies. However, inclusion of these variables added very little to model explanatory power (marginal R2 of 0.44 and conditional R2 of 0.59), so, in the interest of transferability of models to unsurveyed colonies, they were dropped from model predictions.
Figure 3. Predicted Japanese Murrelet density against colony distance from the Biroujima colony model (solid line), in 2009/2012 (Model A) and 2008 (Model B); and from the Izu colony model (dotted line), in May (Model C) and April (Model D). The colony distance is given at which density is predicted to fall below 0.5 birds/km2 for each model prediction.
The at-sea density of murrelets foraging at distances > 20 km from Northern Izu colonies was not influenced by distance to colony (χ2 1 = 0.56, P = 0.451), month (χ2 1 = 0.14, P = 0.708) or year (χ21 = 0.67, P = 0.415). The density of foraging murrelets was significantly influenced by distance to land (χ2 1 = 17.1, P = < 0.001), the model predicted that for every 10 km further offshore, murrelet density increased by 0.2 birds/km2. The density of foraging murrelets was also slightly influenced by CHLA (χ21 = 4.1, P = 0.044), the model predicted that for every 1 mg m-3 increase in the chlorophyll-a concentration, murrelet density increased by 0.025 birds/km2. The Izu density model had a marginal R2 of 0.05 and conditional R2 of 0.24, indicating that almost all of the variance in murrelet density was due to survey differences.
Prediction of density models
The Biro colony model was better than the Izu colony model for predicting murrelet density back onto the sampled colony (Table 3). The Izu colony model was able to predict murrelet density at the Biroujima colony better than the Biro colony model could predict murrelet density at Northern Izu colonies (Table 3). The Izu foraging model was the poorest performing model when predicting to the training dataset and was not used for predicting to independent test data (Table 3). Applying the minimum density threshold of 0.5 birds/km2 to predictions from colony models generated radii of 9 km distance from Biroujima colony in 2009/2012 (hereafter, Model A) and 18 km in 2008 (Model B), and radii of 27 km from Northern Izu colonies in May (Model C) and 39 km in April (Model D; Figure 3).
Assessment of marine IBA network
All 22 known murrelet breeding colonies (within Japanese waters) were included in the Japanese marine IBA network (Figure 4). Thirteen marine IBAs overlapped with the 22 murrelet colonies, each created using seaward extensions (though not always centred on a murrelet colony) of between 8 and 120 km. Around the 22 murrelet colonies, the four radii predicted a total area of at-sea habitat where murrelet densities > 0.05 birds/km2 of between 4,188 km2 (Model A) and 56,134 km2 (Model D; Table 4). Under the most conservative radius of 9 km from the colony (Model A), the 13 marine IBAs captured 95% of murrelet at-sea habitat, by contrast under the most liberal radius of 39 km from the colony (Model D) marine IBA capture of potential habitat fell to 25% (Table 4).
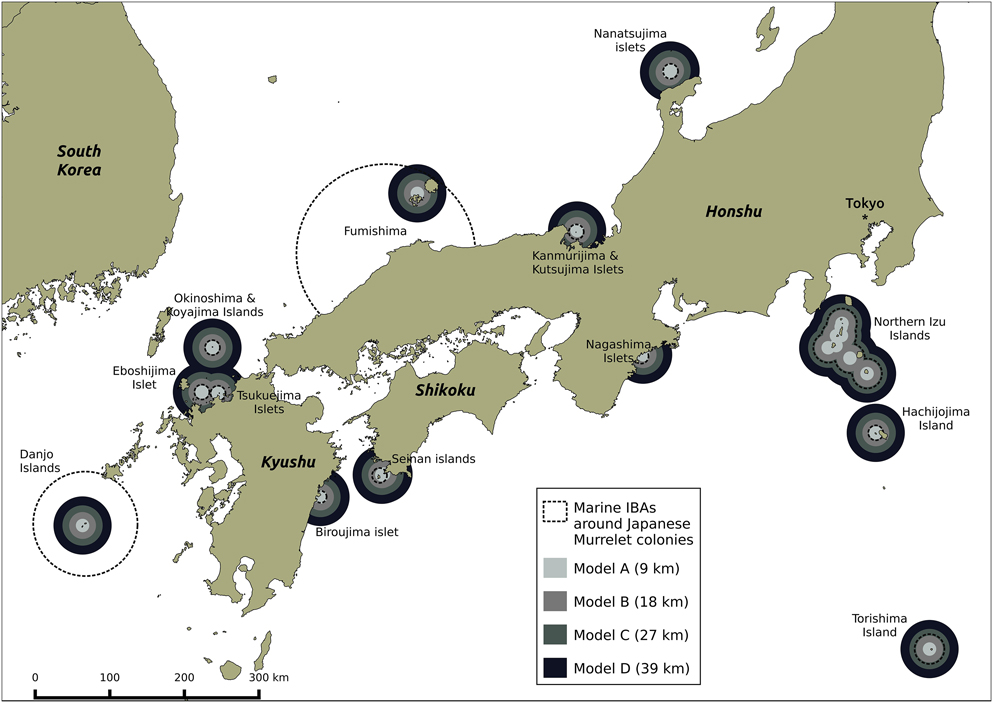
Figure 4. Four radii from model predictions applied to Japanese Murrelet colony locations, and overlap with current Japanese marine IBA network. Each radius is defined as the maximum distance around Japanese Murrelet colonies at which murrelet density is predicted to be above 0.5 birds/km2. Radii are generated from predictions for: Biroujima in 2009/2012 (Model A); Biroujima in 2008 (Model B); Northen Izu colonies in May (Model C); and Northern Izu colonies in April (Model D).
Table 4. Japanese marine Important Bird and Biodiversity Areas (mIBAs) that include Japanese Murrelet colonies. Four radii are provided by density models: Model A, from Biroujima in 2009/2012; Model B, from Biroujima in 2008; Model C, from Northen Izu colonies in May and; Model D, from Northern Izu colonies in April. The extent of each radii (given in brackets under model name) is defined as the distance from the colony at which density is predicted to fall below 0.5 birds/km2. For each colony and the area of sea the radii cover and % of this area captured within each mIBA are reported.
Discussion
At-sea distribution and habitat of breeding Japanese Murrelets
The at-sea density of murrelets in the vicinity of breeding colonies was mostly explained by the distance to the colony, with a contribution from temporal effects. This is consistent with the general dominance of distance to colony in governing habitat use by central-place foraging seabirds (Oppel et al. Reference Oppel, Weber, Weber, Fox, Leat, Sim, Sommerfeld, Bolton, Broderick and Godley2017, Wakefield et al. Reference Wakefield, Owen, Baer, Carroll, Daunt, Dodd, Green, Guilford, Mavor, Miller, Newell, Newton, Robertson, Shoji, Soanes, Votier, Wanless and Bolton2017). Our study period (March–May) covers the later part of pre-laying, the entirety of incubation and the early part of provisioning (Ono Reference Ono1996). Throughout this time murrelets are constrained to the colony and higher densities in the vicinity of the colony are expected (Grecian et al. Reference Grecian, Witt, Attrill, Bearhop, Godley, Grémillet, Hamer and Votier2012). There was no evidence that total murrelet at-sea density differed by month: April no higher than March at Biroujima and May no higher than April at Northern Izu colonies. However, month did interact with distance to colony, showing a shift in at-sea density from more offshore in April to more colony-centred in May. No such change was observed between March and April. Murrelet breeding phenology could explain our results; eggs are laid in March and incubated until hatching in late April and May, at which point parents and their semi-precocial chicks move to the sea (Ono Reference Ono1996). A more colony-centric at-sea distribution in May relative to April could come from observations of adult murrelets accompanying semi-precocial chicks at-sea. Such family groups are limited in their ability to disperse from the colony by chick flightlessness (Sealy et al. Reference Sealy, Pyle and Carter2015). Murrelet density did not vary by year at Northern Izu colonies but was significantly higher at Biroujima in 2008 relative to 2009 and 2012. The 2008 Biroujima prediction is likely the most representative estimate of murrelet at-sea density near this colony given that this was the best sampled year. Furthermore, April murrelet densities predicted for Biroujima in 2008 are higher than those for the Northern Izu islands, which is consistent with colony data for Biroujima being the largest single breeding colony for the species with a population of ∼ 3,000 individuals (Iida Reference Iida2008, BirdLife International Tokyo and Wild Bird Society of Japan 2017), compared to the smaller Northern Izu colonies (combined estimated population of 1,000 individuals; Carter et al. Reference Carter, Ono, Fries, Hasegawa, Ueta, Higuchi, Moyer, Ochikubo Chan, De Forest, Hasegawa and Van Vliet2002). Finally, 2009 was an El Niño year, which impacted Japanese seabirds (Mizutani et al. Reference Mizutani, Tomita, Niizuma and Yoda2013) and could explain reduced murrelet at-sea density. Further study will be able to elucidate whether inter-annual variance in near-colony at-sea density is an artefact of sampling differences or in response to environmental heterogeneity.
The more colony-centric distribution of murrelets around the Biroujima colony compared to the Northern Izu colonies could be related to differences in competition pressure and at-sea habitat between the two locations (Paiva et al. Reference Paiva, Geraldes, Ramírez, Meirinho, Garthe and Ramos2010b, Oppel et al. Reference Oppel, Beard, Fox, Mackley, Leat, Henry, Clingham, Fowler, Sim, Sommerfeld, Weber, Weber and Bolton2015). Intra-specific competition pressure should be higher surrounding the more densely populated Biroujima colony than the Northern Izu colonies, but greater foraging distances (sensu Ashmole Reference Ashmole1963) were not observed. The likely explanation for this disparity is that higher competition pressure at Biroujima was offset by greater background resource availability from the productive neritic habitat we describe. By contrast, the cooler, deeper, less productive, pelagic habitat experienced by murrelets from offshore Northern Izu island colonies, could limit local resource availability and necessitate greater foraging ranges (Paiva et al. Reference Paiva, Geraldes, Ramírez, Meirinho, Garthe and Ramos2010b).
Our exploration of at-sea habitat used by breeding Japanese Murrelets found large differences between colonies. Kojine, at the centre of the Izu island chain is a remote offshore island surrounded by deep, oligotrophic water; whereas Oki, situated in the shallow Sea of Japan, is surrounded by waters ∼ 4°C cooler than the other colonies on Japan’s East coast that are warmed by the Kuroshio Current. Such different marine habitats are likely to promote different foraging strategies (Paiva et al. Reference Paiva, Geraldes, Ramírez, Meirinho, Garthe and Ramos2010a), including different at-sea distributions between populations (Paiva et al. Reference Paiva, Geraldes, Ramírez, Meirinho, Garthe and Ramos2010b). The potential for such local adaptation of foraging strategy in the Japanese Murrelet is problematic for applying at-sea distribution findings from studied to unstudied colonies. Additionally, as population estimates are unavailable for most Japanese Murrelet colonies, we could only link at-sea distributions to marine habitat with considerable uncertainty from unknown intra-specific competition pressure. Future study is required to incorporate these data into models and improve accuracy.
Despite differences in marine habitat between colonies, oceanographic variables explained very little about murrelet density. This could be due to satellite data limitations, such as oceanographic features, which aggregate murrelets for foraging, occurring at spatio-temporal scales beyond the resolution of our data. Alternatively sampling limitations, such as murrelets foraging in excess of 50 km from colonies and thus beyond the scope of our surveys, as seen in congeners (Shoji et al. Reference Shoji, Yoneda and Gaston2012), may have obscured relationships between foraging and oceanographic variables. The Izu foraging model, designed to capture foraging habitat, was also unable to contribute much evidence for important oceanographic characteristics of the habitat. Considering the Izu foraging model pragmatically, we observe that all the murrelets distributed > 20 km from Northern Izu colonies were found north-west of the islands over the mainland shelf. As no other colonies are nearby, we can assume these birds are from Northern Izu colonies and chose neritic habitat (< 200 m depth) for foraging. Murrelets are thought to forage throughout the water column, feeding on small pelagic fishes and euphausiids (Piatt and Gould Reference Piatt and Gould1994) and may favour neritic habitats to prey upon benthic molluscs (Moyer Reference Moyer1957). However, as our surveys around the Northern Izu islands did not extend far into pelagic waters, we cannot discount the possibility that breeding murrelets also target pelagic habitat (e.g. large-scale anticyclonic eddies and warm-core rings; Piatt and Gould Reference Piatt and Gould1994) for foraging.
Overlap of current marine IBA network with predicted Japanese Murrelet at-sea density
Overall the current Japanese marine IBA network appears reasonably well configured to protect murrelets at-sea during breeding. The two marine IBAs capturing almost all murrelet habitat from different model predictions (> 90%) were able to do so due to a large seaward extension radius for a different seabird species: Brown Booby Sula leucogaster (70 km), in the case of Danjo Islands IBA; and Black-tailed Gull Larus crassirostris (120 km), in the case of Fumishima Islet and Oki Islands IBA (BirdLife International Tokyo and Wild Bird Society of Japan, 2017). The Northern Izu Islands IBA and Torishima Island IBA have 20 km seaward extensions and perform reasonably well. The remaining marine IBAs were designated based on seaward extension radii of 10 km or less, hence the steep decline in total marine IBA network coverage of murrelet at-sea habitat from 95% when murrelets are predicted within 9 km of colonies, to 52% when murrelets are predicted within 18 km of colonies. As such, the effectiveness of the marine IBA network to protect murrelets at a broad scale is dependent upon which model prediction is applied: the network performs well if murrelets are distributed within 9 km of colonies (Model A) but poorly if they are distributed within 39 km of colonies (Model D).
This highlights the importance of differences in at-sea murrelet distribution between colonies and the potential for error when predicting to unsampled colonies, especially in different oceanographic regions. Our results, although based only on two breeding locations, suggest that the at-sea murrelet density around a neritic colony cannot effectively predict the more pelagic distribution of an offshore island colony, and that the murrelet density around the offshore island colony, although more informative, cannot fully predict the more colony-centric distribution of the neritic colony. As a speculative recommendation the Izu model predictions could be applied to other offshore island murrelet colonies (Kojine, Torishima, Danjogunto hanagari and Takeshima/Dok) while the Biro model predictions applied to all the other colonies upon the Japanese continental shelf. However, this approach does not account for differences in colony sizes, which are known to impact the foraging range of seabirds via intra-specific competition pressure (Lewis et al. Reference Lewis, Sherratt, Hamer and Wanless2001, Oppel et al. Reference Oppel, Beard, Fox, Mackley, Leat, Henry, Clingham, Fowler, Sim, Sommerfeld, Weber, Weber and Bolton2015, Wakefield et al. Reference Wakefield, Owen, Baer, Carroll, Daunt, Dodd, Green, Guilford, Mavor, Miller, Newell, Newton, Robertson, Shoji, Soanes, Votier, Wanless and Bolton2017). To accurately predict murrelet at-sea distributions to unsampled colonies it is essential that: a) population estimates are obtained for all known Japanese Murrelet colonies (Table S2); and b) at-sea surveys are undertaken at colonies in different oceanographic regimes.
Potential at-sea threats identified by model predictions
Our results indicate that murrelets breeding on neritic colonies do not range far, and that murrelets from offshore islands commute to the mainland shelf to forage. This neritic distribution puts murrelets at greater threat from interaction with anthropogenic marine activities. Murrelets are sensitive to marine pollution and have been killed in oil spills, alongside large numbers of other alcids (Sato Reference Sato1999). In addition to occasional large oil spills, the effects of numerous chronic oil spills from shipping poses a significant threat to seabird population stability (Camphuysen and Heubeck Reference Camphuysen and Heubeck2001, Wiese and Robertson Reference Wiese and Robertson2004). The proximity of murrelet colonies to major ports and shipping lanes (e.g. Northern Izu colonies to Tokyo Bay), likely exposes breeding murrelets to the persistent threat of oiling while foraging (Carter et al. Reference Carter, Ono, Fries, Hasegawa, Ueta, Higuchi, Moyer, Ochikubo Chan, De Forest, Hasegawa and Van Vliet2002). A neritic distribution also exposes breeding murrelets to a higher risk of disturbance and displacement impacts from offshore wind farms (Busch et al. Reference Busch, Kannen, Garthe and Jessopp2013, Furness et al. Reference Furness, Wade and Masden2013), pertinent in Japan given their expansion is promoted in the wake of the 2011 Fukushima nuclear disaster (Busch et al. Reference Busch, Kannen, Garthe and Jessopp2013). Finally, a neritic distribution also exposes breeding murrelets to higher gillnet bycatch as most nets are set within 20 nautical miles of the coast (Waugh et al. Reference Waugh, Filippi, Blyth and Filippi2011). As murrelets forage throughout the water column (Moyer Reference Moyer1957, Piatt and Gould Reference Piatt and Gould1994) they potentially interact with both coastal driftnets (targeting tuna and salmon), and bottom-anchored gillnets (targeting flatfish and greenling) in Japanese coastal waters (Ogi and Shiomi Reference Ogi and Shiomi1991). Given that Japan reports one of highest annual gillnet catches (Waugh et al. Reference Waugh, Filippi, Blyth and Filippi2011), we reiterate here the need for monitoring of seabird bycatch in small-scale gillnet fisheries within the Japanese EEZ (Piatt and Gould Reference Piatt and Gould1994, Carter et al. Reference Carter, Ono, Fries, Hasegawa, Ueta, Higuchi, Moyer, Ochikubo Chan, De Forest, Hasegawa and Van Vliet2002, Ogi Reference Ogi2008, Žydelis et al. Reference Žydelis, Small and French2013).
Supplementary Material
To view supplementary material for this article, please visit https://doi.org/10.1017/S095927091800028X
Acknowledgements
We thank The Tiffany & Co. Foundation, whose support was made possible through a grant to American Friends of BirdLife International, The Keidanren Nature Conservation Fund, The Nippon Foundation and Kaburagi Kikin for partial financial support for the project. We thank T. Yamamoto, S. Oppel, F. Daunt, M. Derhe and two anonymous referees who provided valuable comments that improved the manuscript.


