


Introduction
Past sea-level history (Reference Muller-BeckMüller-Beck, 1966) indicates that the continental shelf along the northern coast of Alaska was exposed to cold air temperatures which caused permafrost to form. Subsequent increases in sea-level until 3 000–4 000 years ago, have resulted in a state of ocean transgression on land. Coastal erosion has continued since then along the flat northern coast of Alaska by thermal, chemical, and mechanical processes, at a typical rate of 1–2 m s-1 (Reference AlexanderAlexander and others, 1975). Near Prudhoe Bay, Alaska, neither the permafrost covered by the ocean during the coastal erosion process nor that covered by sea-level changes has had sufficient time to respond to the new thermal and salt boundary conditions at the sea bed. In addition, the sea-bed temperature appears to be negative (Reference LewellenLewellen, 1973). Therefore, it is probable that substantial areas of sub-sea permafrost exist on the continental shelf, particularly near shore.
The state of the sub-sea soils on Alaska's continental shelves has an industrial importance due to the large oil and gas deposits that are thought to exist there. The rational development of these deposits requires a thorough understanding of soil conditions, particularly in the Arctic, where sub-sea permafrost may present additional difficulties to engineers concerned with offshore foundations, drilling, trenching, and production and transportation of hot oil.
This paper is a summary of the results of a drilling program designed to investigate sub-sea permafrost conditions, carried out between 30 April and 18 May 1975, at a site near the north-west corner of Prudhoe Bay, Alaska (Fig. 1). A brief summary is given of some of the drilling and sampling procedures, penetration measurements, soil analyses, permeability measurements, pore-water salinity measurements, and temperature measurements and analysis. More information is available in a report by Reference Osterkamp and HarrisonOsterkamp and Harrison (1976); some implications for resource development have been given by Reference Osterkamp and HarrisonOsterkamp and Harrison (in press).

Fig. 1. Map showing the location of the drilling line on the north-west comer of Prudhoe Bay.
Drilling and sampling
Drilling was carried out from the 2 m thick fast sea ice with a drill rig mounted on a tracked vehicle. A summary of drilling and sampling methods and other information is given in Table 1. The hole number is the distance from the beach in meters along a line bearing N. 32'5° E. from the North Prudhoe Bay State No. I well (Fig. 1). Negative numbers apply to holes on land. A field designation number was assigned to the holes by the order in which they were drilled. All hole and sample depths were measured from the sea-ice surface. The drilling time does not include down time.
Table I. Summary of drilling and sampling information
Penetration tests
Some definitions need to be discussed before the data are interpreted. The entire study area, except possibly for a thin active layer in very shallow water which is warmed in summer, qualifies as permafrost by the usual definition: ground material continuously below 0°C (Reference MullerMuller, 1947). This definition is not so useful in a salty environment, and the terms ice-“bonded” and “unbonded” permafrost have been used to indicate whether or not the soil particles are bonded by ice in a sub-zero environment. The usage is consistent with a driller's observation as to whether material is “frozen” or “thawed”. Although most sub-sea permafrost was formed on land, and subsequently thawed downward from the sea bed after ocean transgression, the usage of the terms “frozen” and “thawed” is somewhat loose in that a briny soil may exist in an intermediate state in which comparable amounts of ice and brine are present. Also, it may be possible for such a soil to be unbonded even if some ice is present. Nevertheless, a fairly well-defined boundary between bonded and unbonded conditions seemed to exist in the study area, although this is probably not always the case. It also seems likely that an unbonded layer beneath the sea bed at hole 481 and seaward is completely thawed, except possibly very near the unbonded-bonded boundary which underlies it.
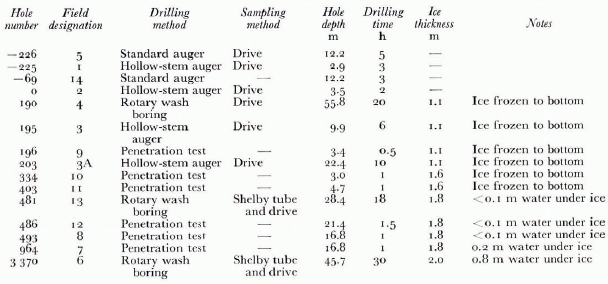
A series of penetration tests was performed in an attempt to locate the unbonded-bonded permafrost boundary by driving the drill rod into the sea bottom. The position of the unbonded-bonded permafrost boundary was taken as the depth where the blow count (the number of blows required to drive the rod 0.30 m) increased substantially. These data are summarized in Figure 2.
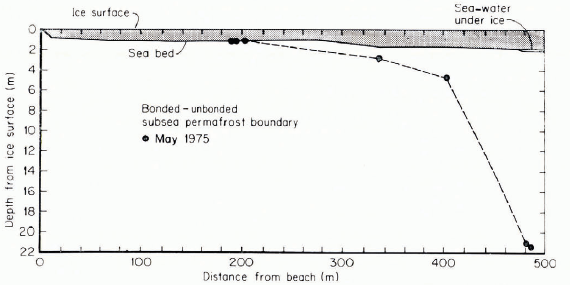
Fig. 2. Profile of the near-shore sub-sea permafrost regime. Sub-sea soils to the right and above the dashed line are unbonded and soils to the left of it are ice-bonded.
In hole 486, the boundary was found at 21.3 m. The boundary in hole 481, a drilled hole, was at 21.1 m according to the driller. It may also be seen as a sharp break in the temperature gradient (see Fig. 5) at about the same depth. No bonded sub-sea permafrost was encountered in hole 3 370 to the depth of 46 m (from the ice surface) that was drilled, but temperature data indicate that the boundary is probably not much deeper than 50 m (Reference Osterkamp and HarrisonOsterkamp and Harrison, 1976).
Fig. 3. Measured electrical conductivity profile of the pore water in soil samples from hole 481. The values are normalized to 25°C. The point at the bonded sub-sea permafrost boundary was calculated from the temperature data. Normal sea-water is about 5.3 (Ω m)-1.

Fig. 4. Extrapolated equilibrium temperatures on 12 June 1975 for hole 190 and logged temperatures on 29 May 1975 for hole 203. These data were put on the same figure because the holes were separated by only 13 m in an area of nearly constant water depth.

Fig. 5. Extrapolated equilibrium temperatures and normalized logged temperatures for hole 48l on l3 June 1975.
Figure 2 shows that a bench exists in the sea bed out to about 280 m offshore over which the water depth is nearly constant at about 1 m. This bench appears to be an erosional feature similar to that observed by Reference LewellenLewellen (1973) in Elson Lagoon. Figure 2 also shows that the depth to the bonded sub-sea permafrost increases rapidly between 400 and 500 m offshore. This suggests that, given the maximum sea-ice thickness (2 m at Prudhoe Bay), the bathymetry is a controlling factor which determines whether or not bonded sub-sea permafrost will be found near the sea bed. In water depths greater than 2 m, where the ice does not normally freeze to the sea bed, the bonded sub-sea permafrost might be expected to be well below the sea bed.
Soil-sample analyses
The soil-sample analyses included gradation, hydrometer, Atterberg-limits, specific-gravity, density, consolidation, moisture-content, and tri-axial compression tests by standard methods. The results have been given by Reference Osterkamp and HarrisonOsterkamp and Harrison (1976).
Generally, the sea bed was sandy gravel or gravelly sand with some silt overlain by a thin layer of silt or sandy silt which increased in thickness seaward from a few meters near shore to about 14 m at hole 3 370. Quartz was the dominant mineral present.
In addition to the standard moisture tests by drying, the moisture contents of some of the Shelby tube samples from holes 481 and 3 370 were calculated on a volume basis, together with the relative saturation, from the bulk densities. The results are shown in Table II. Most of these Shelby tube soil samples and most of the drive samples were saturated as shown by visual observations of supernatant water in the sample jars, although it seems quite possible that some water may have been forced from the samples during the sampling procedure.
Table II. Moisture contents and relative saturations for some Shelby tube samples
The saturated hydraulic conductivity of a thawed Shelby tube sample obtained from the 6.7 m depth from hole 3 370 was measured with the Shelby tube in a cold box at a temperature varying between —2° and 0°C. Sea-water was passed through the sample, which was mounted in a vertical position, under a constant head, and Darcy's law was used to calculate the saturated hydraulic conductivity. The result was 1.8X10⁻⁷ms-1 for the first run, and 6.9 × 10⁻⁷ ms-1 for the second, giving an average of 4 X 10⁻⁷ ms-1. This soil sample consisted of 22% gravel, 20% sand, 49% silt and a minor amount (<10%) of clay.
Hole —69 was a 0.17 m diameter hole drilled on land to a depth of 12.2 m for the purpose of measuring the in situ permeability of the ice-bonded subterranean permafrost to a non-freezing fluid. After the hole was filled with fluid, the fluid level remained constant. It was concluded that the permeability of the bonded subterranean permafrost at this site was essentially zero.
Salt-concentration measurements
The salt concentration of the pore water in the soil samples was studied by three methods: measurement of the electrical conductivity of the supernatant water, determination of the Cl- content of the samples with sufficient supernatant water for conductivity measurement, and major ion analysis of three soil samples.
All of these measurements made on the soil samples obtained by drive sampling are questionable because of the possibilities of sample contamination and an evaporative loss of water from some of the sample jars. The former problem is potentially more serious. All of the unbonded and some of the bonded drive samples were taken when the holes were filled with sea-water brine or with drilling mud made from sea-water brine. (The mud was used to minimize pore-water contamination.) Since a split-tube drive sampler was used, it was possible for the brine or mud to enter the sampling tube and contaminate the sample. This problem was partially alleviated by using cylindrical sample liners, and by carefully scraping the drilling mud from the soil sample when the sampler was opened. However, the possibility of some contamination still exists. More details have been given by Reference Osterkamp and HarrisonOsterkamp and Harrison (1976).
Table III shows the results of calculations based on the analysis of the major ions in three samples. Additional useful information is also given in the table. The depth was measured from the ice surface. Time from the beach was calculated under the assumption that the average coastal retreat was 1.4 ma-1 (Reference AlexanderAlexander and others, 1975). The state of the soil sample refers to the in situ condition of the sample. The measured conductivity is that of the supernatant water and the estimated conductivity was calculated from the ionic concentrations and the partial equivalent conductances appropriate for sea-water (Reference ParkPark, 1964).
Table III. Results from the analysis of major ions in three sub-sea permafrost samples with related information

Agreement between measured and calculated values of electrical conductivity is excellent for samples 4 093 and 13 069.9, but poor for sample 6040. The reason for this disagreement in the case of sample 6 040 is unknown. In some cases, it was possible to compare measured conductivities, estimated conductivities, and conductivities derived from the chlorinity measurements. The difference between these conductivity values for each sample was less than 20% except for sample 6040.
The electrical conductivity profile for hole 481 is shown in Figure 3. These are the measured conductivity values except for the point at the bonded-unbonded sub-sea perma-frost boundary. The freezing-point depression of the relatively coarse-grained soils encountered in this study can be approximated by the freezing-point depression of the pore water due to the presence of dissolved ionic impurities. Extrapolation of the temperature data in hole 481 gave a value for the freezing-point depression of about —2.40°C at the boundary which corresponds to a salinity of 43% and a conductivity of 6.3 (Ω m)-1. This conductivity value appears to be consistent with the other electrical conductivities above it in this profile.
The ice-bonded soil samples also contained salt and, therefore, some liquid phase in situ. Since the soils are reasonably coarse-grained, the in situ fraction of H2O in the liquid phase is given approximately by the ratio of freezing temperature to in situ temperature in deg (e.g. Reference HarrisonHarrison, 1972). Using the in situ temperatures given below, the fractions are about 0.37 for sample 4 093 and 0.56 for sample 13069.9. These samples, although ice bonded, therefore contained comparable amounts of solid and liquid phase in situ. This important conclusion depends on the assumption that no significant contamination occurred during sampling, which, as already noted, is not completely certain.
More data have been given by Reference Osterkamp and HarrisonOsterkamp and Harrison (1976).
Bore-hole temperatures
All bore-hole temperatures were measured with thermistor sensors. The measuring system had a sensitivity of about 0.001 deg and an accuracy of about 0.01 deg. A cable containing thermistors at 5 m intervals was installed in hole 190; the other holes were logged periodically with a single sensor. The last data were obtained on 14 June 1975 and all the offshore holes were destroyed by break-up of the sea-ice cover.
The analysis of the temperature data to remove the disturbance associated with the drilling of the hole is a major task, complicated by several factors: (I) Drilling fluid periodically escaped into the soil, causing long-lived disturbance. (2) A chemical effect exists in soils containing ice which is due to the phase equilibrium between the ice and the briny drilling fluid. (3) Real secular temperature changes, which must be separated from those due to the drilling disturbance, occurred over the period of measurement. (4) Large systematic errors sometimes occurred and these appeared to be associated with adverse field conditions: low temperatures and blowing snow in May, and rain and salt water in June.
An attempt was made to take all these effects into account in the analysis of the temperature data. A description of the method has been given by Reference Osterkamp and HarrisonOsterkamp and Harrison (1976) and will not be repeated here. The results of the analysis are estimates of the unditurbed temperatures (also called equilibrium temperatures) in holes 190, 481 and 3 370, estimates of the error, and an estimate of the thermal diffusivity of the unbonded soil in hole 481.
Hole 190 was logged five times between 7 May and 12 June 1975. The estimated equilibrium temperatures are shown in Figure 4. This was the hole containing the thermistor cable and the systematic errors associated with logging the other holes seem to be largely absent. At depths of 13.7 m and greater, the random errors of the estimated equilibrium temperatures are about 0.007 deg. The systematic (depth-independent) errors are about 0.010 deg or slightly less. The total error at depths of 3.7 and 8.7 m is large, of the order of 0.1 deg.
Hole 481 was logged four times between 20 May and 13 July 1975. The estimated equilibrium temperatures are shown in Figure 5. The curve is broken where significant uncertainty in the equilibrium temperature exists. Above the unbonded-bonded boundary, this uncertainty is largely due to the escape of drilling fluid; below the boundary it is due to the chemical effect noted earlier. Where the curve in Figure 5 is unbroken, the systematic (depth-independent) error in the equilibrium temperature is about 0.05 deg and the random error is about ten times smaller. From the secular changes during the period of logging, an estimate of 21 ±7 m2 s-1 was made for the diffusivity of the unbonded sandy gravel with silt.
Hole 3370 was logged five times between 16 May and 14 June 1975. The estimated equilibrium temperatures are shown in Figure 6. The curve is broken where significant uncertainty in the equilibrium temperature, due to the escape of drilling fluid except near the sea bed, exists. Where the curve is unbroken, errors are about the same as in hole 481.

Fig. 6. Extrapolated equilibrium temperatures on 14 June 1975 and logged temperatures on 28 May 1975 for hole 3370.
The rapid variation of temperature at shallow depths is a seasonal effect. The mean annual sea-bed temperature is a function of distance from shore and time since ocean transgression is shown in Figure 7. These temperatures were obtained by extrapolating the deep, approximately linearly varying temperatures in holes 190, 481 and 3370 to the sea bed; time was obtained from an estimated transgression rate of the order of 1.4 m s-1 (Reference AlexanderAlexander and others, 1975).
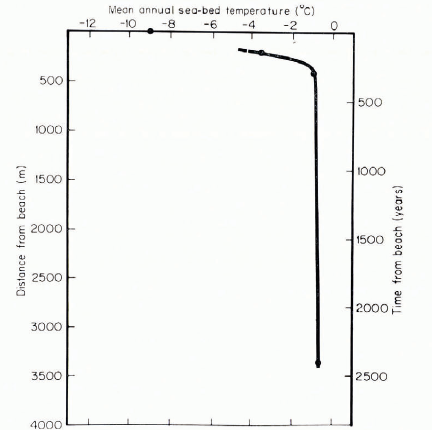
Fig. 7. System of coordinates in the snow cover x, y, z and associated velocities u, v, w and stresses σx, σy, σz.
These data illustrate the rapid increase in temperature with increasing distance from land. On land, the mean annual surface temperature is about —9°C (although a century ago it was roughly 2 deg lower (Reference Gold and LachenbruchGold and Lachenbruch, 1973)). At a distance of only 190 m from shore, where the ice thickness is 1.8 m and the ice is frozen to the bottom for about 5 months of the year, the mean annual sea-bed temperature is — 3.4°C. At a distance of 481 m, where the ice thickness is 1.8 m and the ice does not freeze to the bottom, the mean annual sea-bed tem-perature is about — 1.1°C. At 3 370 m, where there is about 1 m of water under the ice at its maximum thickness, the mean annual sea-bed temperature is —0.7°C.
Reference OsterkampOsterkamp (1975) has suggested that the offshore areas, where the sea ice freezes to the sea bed, should be treated as a special case in the development of the sub-sea permafrost regime. From the discussion given here, and from Figures 4—7, it is evident that major changes in the mean annual sea-bed temperature, and in fact in the whole permafrost regime near the sea bed, occur within about 500 m of shore. These changes seem to be largely associated with the freezing of the sea ice to the sea bed. Therefore, the water depth is an important controlling factor of the mean annual sea-bed temperature, which is the thermal boundary condition for the sub-sea permafrost. It was also noted on p. 630 that water depth has a similarly large effect on the position of the bonded permafrost boundary.
Other work
Other data on the sub-sea permafrost regime at Prudhoe Bay exist, although some of the. industrial data are not available in the open literature. Of particular interest are the refraction and reflection seismic studies described by Reference Rogers and SackingerRogers and Sackinger (unpublished), which trace the unbonded-bonded boundary out from the present study area to a distance of about 14 km from shore, where it lies at a depth of 90-100 m (see also Reference Reimnitz and BarnesReimnitz and Barnes, 1974).
The question of the thickness of the ice-bonded sub-sea permafrost at Prudhoe Bay has not been investigated in detail. But considering that the thickness on land is 600-700 m, that ocean transgression is roughly 1 m a-1 and that melting at the bottom of the ice-rich Prudhoe Bay soils can only be of order 0.01-0.02 m a-1 (Reference Gold and LachenbruchGold and Lachenbruch, 1973), it follows that several hundred meters of relict ice-bonded permafrost should still exist in the present study area.
Some theoretical interpretation of the data, which focuses on the development of the unbonded layer and on transport processes in it, has been done (Reference Harrison and OsterkampHarrison and Osterkamp, 1976[a], Reference Harrison and Osterkamp[b]). A coupled heat-conduction and salt-diffusion model, which includes a moving phase boundary, was solved in closed form. It predicts strongly depth-dependent pore-water salinities which are not observed, and a thickness of the unbonded layer roughly an order of magnitude less than observed. Our conclusion is that salt is transported through the unbonded layer by moving pore water.
Acknowledgements
Many individuals and organizations made this research possible and in particular we should like to mention W. M. Sackinger. This research was sponsored by NOAA, Office of Sea Grant, Department of Commerce, under grant Number 04-5-158-35, the Alaska Oil and Gas Association and by the Outer Continental Shelf Environmental Assessment Program Office of NOAA, Boulder, Colorado, under grant Number 03-5-022-55, task order Number 1. The final draft of this manuscript was prepared at the U.S. Army Cold Regions Research and Engineering Laboratory, Hanover, New Hampshire, and we wish to thank them for making their facilities available to us.


