


Policy Significance Statement
Drawing from international literature covering household wealth proxies, we propose a five-criterion assessment framework to assess the performance of existing wealth proxies for high-spatial resolution intra-city environmental inequality (EI) study. The five criteria include spatial resolution, relevance with household wealth, applicability to urban China,Footnote 1 data availability, and temporal resolution or timeliness. Our study concludes that no existing household wealth proxies could meet all assessment criteria to capture the effects of SES on intra-city EI in China, making it necessary to tailor-make a new household wealth proxy for China. Finally, we summarize challenges to sound data quality and availability, and to privacy and security, followed by recommendations of relevant data policy frameworks to ensure qualitative data collection with moral access control and ethical principles, while taking personal privacy and security dimension into consideration in the process of developing household wealth proxies, in order to facilitate sound evidence-based and fine-grained socio-economic-induced EI studies in China.
Introduction
China’s rapid economic development has been achieved at the expense of socio-economic inequality and environmental deterioration. Despite the rapid per capita gross domestic product (GDP) growth (8.6% per annum) recorded in between 1979 and 2014 (Chen et al., Reference Chen, Yang and Feng2016), the improvement in the living standards of common citizens is moderate and the gaps of wealth between the rich and the poor are widening (Cheng, Reference Cheng2013). In 2014, more than one-third of total household wealth is possessed by only one percent of the households in China, whereas the poorest one-fourth holds less than two percent of the total in China (Xie and Jin, Reference Xie and Jin2015). Meanwhile, as a result of intensive economic development, citizens residing in some parts of China have been exposed to much higher risks of extreme weather and environmental pollution (Wang et al., Reference Wang, Qi, Wang, Guo and Yu2007; Wang et al., Reference Wang, Ling, Huang, Fan, Wang and Yong2012), jeopardizing their quality of life and health (Cheng, Reference Cheng2015; Gao and Li, Reference Gao and Li2013). According to a report published by the Organization for Economic Co-operation and Development (OECD, 2016), outdoor air pollution resulted in 662 premature deaths per million people in 2010 and the number is estimated to reach 1,563/million people per year by 2060 in China. Meanwhile, the loss of GDP due to extra health expenditure and labor productivity is estimated to increase by about 2.1% in 2060 (OECD, 2016).
Environmental pollution induced disparity, and the associated environmental inequality (EI) between the rich and the poor is evident in the cities with the fastest growing economies, such as Beijing and Shanghai in China (Kolenikov and Angeles, Reference Kolenikov and Angeles2009; Taubenbock et al., Reference Taubenbock, Wurm, Setiadi, Gebert, Roth, Strunz, Birkmann and Dech2009; Xie and Jin, Reference Xie and Jin2015). EI is defined as the disproportionate share of environmental burdens and adverse health outcomes among disadvantaged groups (e.g., ethnic minority communities or low-SES groups) (Davoudi and Brooks, Reference Davoudi and Brooks2012). The studies investigating EI in the developed and developing countries have revealed that people with low SES, low income, and education or nonprofessional occupation are more likely to experience a higher level of environmental catastrophe, in the form of air pollution, flood, drought, and extreme heat (Li et al., Reference Li, Han, Lam, Zhu and Bacon-Shone2018; Park et al., Reference Park, Bangalore, Hallegatte and Sandhoefner2018; Winsemius et al., Reference Winsemius, Jongman, Veldkamp, Hallegatte, Bangalore and Ward2015), revealing the existence of climate or environmental inequality (Marlier and Atkinson, Reference Marlier and Atkinson2010; Sharath et al., Reference Sharath, Nirupam, Sowmya and Srinivasa2016). However, these studies have focused on the impacts of EI related to these three main SES indicators, without accounting the potential influencing factors, such as household wealth. Hence, these studies may not have adequately explained EI and the resulting SES disparities (Hajat et al., Reference Hajat, Hsia and O’Neill2015). A number of epidemiological studies have distinguished wealth from income and argued that the former serves a better indicator of economic wellbeing (Pastor-Satorras et al., Reference Pastor-Satorras, Castellano, Van Mieghem and Vespignani2015). In parallel, much of the existing environmental justice literature has argued that household wealth may serve better in China than household income as an SES indicator (Aittomäki et al., Reference Aittomäki, Martikainen, Laaksonen, Lahelma and Rahkonen2010; Benzeval and Judge, Reference Benzeval and Judge2001; Fritzell et al., Reference Fritzell, Nermo and Lundberg2004; Rahkonen et al., Reference Rahkonen, Arber, Lahelma, Martikainen and Silventoinen2000). A household’s wealth condition may reflect better one’s ability to purchase an apartment at one’s desired location (Sun, Reference Sun2015), eventually affecting the household members’ air pollution exposure (Li et al., Reference Li, Han, Lam, Zhu and Bacon-Shone2018). To gain a better understanding of SES-based EI in China, it is important to investigate whether household wealth will influence household air pollution exposure in China.
EI study conducted at the intra-city level is important in capturing the crucial spatial characteristics on environmental exposure (Bowen, Reference Bowen2001; Jerrett et al., Reference Jerrett, Arain, Kanaroglou, Beckerman, Potoglou, Sahsuvaroglu, Morrison and Giovis2005). Intra-city EI study identifies the most polluted areas in the city and hence offers insights to policy-makers for environmental management (Hallegatte and Rozenberg, Reference Hallegatte and Rozenberg2017). Due to the scaling effect, EI studies conducted at the inter-city level in China might not be able to capture the effects of relevant EI studies conducted at the intra-city level. Two studies conducted in the United Kingdom (Huby et al., Reference Huby, Cinderby, White and de Bruin2009) and the United States (Krieger et al., Reference Krieger, Chen, Waterman, Soobader, Subramanian and Carson2002) have produced completely opposite results regarding the relationship between SES and EI at different spatial scales. When designing environmental policies that address the spatial effects of SES on EI, it is therefore necessary to couple SES data with environmental exposure data at the right spatial scale, especially at a finer spatial resolution, such that more specific, relevant results that facilitate area-specific environmental policy-making can be achieved (Fernández and Wu, Reference Fernández and Wu2016).
At the moment, neither fine-grained wealth data collected from existing household surveys, nor fine-grained proxies estimating household wealth distribution are readily available in China, rendering the EI studies at the intra-city level, such as at the block-level of a city in China, highly challenging. At the moment, proxies such as the nightlight satellite imaging are contextualized in the slow growth developing countries in Africa, making the extension of similar proxies to China inappropriate (Olivia et al., Reference Olivia, Gibson, Rozelle, Huang and Deng2011). In contrast to Africa, there are sufficient nightlight facilities across both rich and poor urban areas in China, and the statistical correlation between nightlight and household wealth is weak (Mellander et al., Reference Mellander, Lobo, Stolarick and Matheson2015; Venerandi et al., Reference Venerandi, Quattrone, Capra, Quercia and Saez-Trumper2015). Scholars also show that nightlight can hardly differentiate, especially in the case of a densely populated poor area, from a sparsely populated rich area (Graesser et al., Reference Graesser, Cheriyadat, Vatsavai, Chandola, Long and Bright2012). Therefore, direct extension of similar socio-economic proxy models from studies in Africa to that of China is not recommended, given the very different economic environment and development patterns that China has exhibited as opposed to the relatively less-developed countries such as Africa (Mason, Reference Mason2015). Hence, developing high resolution and precise household wealth proxies specifically relevant for urban China is urgently needed, as it provides the basis upon which meaningful exploration of the relationship between household SES and EI can be conducted (Henderson et al., Reference Henderson, Storeygard and Weil2012; Jean et al., Reference Jean, Burke, Xie, Davis, Lobell and Ermon2016).
In the present study, we first highlight the significance of household wealth related fine-grained EI studies in China. Second, we survey the available Chinese household wealth database, and identify the current research gaps, including the lack of high spatial resolution and high economic representative household wealth data that could support EI studies in China. Third, we survey the available techniques for developing relevant wealth proxies across the world, and outline their strengths and weaknesses based on a five-criteria assessment framework. Fourth, we discuss the pros and cons of existing new household wealth proxies for measuring household wealth at the fine-grained spatial level, with reference to fine-grained SES-induced EI studies in China. Fifth, we summarize the challenges to data availability and quality with concerns about ethics and privacy, and recommend data policies to improve the quality and availability of fine-grained SES data by protecting data privacy and information security in relation to household wealth proxy development in China. Finally, we conclude our study and recommend future directions for developing new household wealth proxies to support fine-grained SES-induced EI studies in China.
Methodology
Our research methodology is structured as follows. First, we surveyed the Chinese and international literature that cover SES-related EI studies, and highlighted the significance of using fine-grained household wealth as a proxy and the relevant datasets for improving EI research in China. Our selection of publications is guided by the following research questions:
1. On which datasets are the majority of SES-related EI studies based?
2. What are the critiques of such datasets?
3. Has household wealth been used as a proxy for EI studies?
4. Have household wealth datasets been available, and are they fine-grained enough for SES-induced EI studies?
Based on the state-of-the-art scientific literature guidelines, we used the following keywords to search for relevant literature, “environmental inequalities,” “socio-economic status,” “poverty estimation,” “poverty mapping,” “wealth proxy,” “fine-grained,” and “scaling effect”. These keywords were keyed into the databases including the Web of Science, Scopus, and the Google Scholar for selecting the relevant review articles. The publications selected will provide a general idea regarding our household wealth proxy and database landscape.
Based on the publications we identified the main wealth proxies developed to further investigate their applications on SES-related EI studies. We further expanded our keyword search by keying in the names of individual proxies and their corresponding supporting technologies. We identified the lack of high-spatial resolution and high-economic representative household wealth data and selected 87 publications for further analysis. Figure 1 summarizes how our key research gaps were identified.
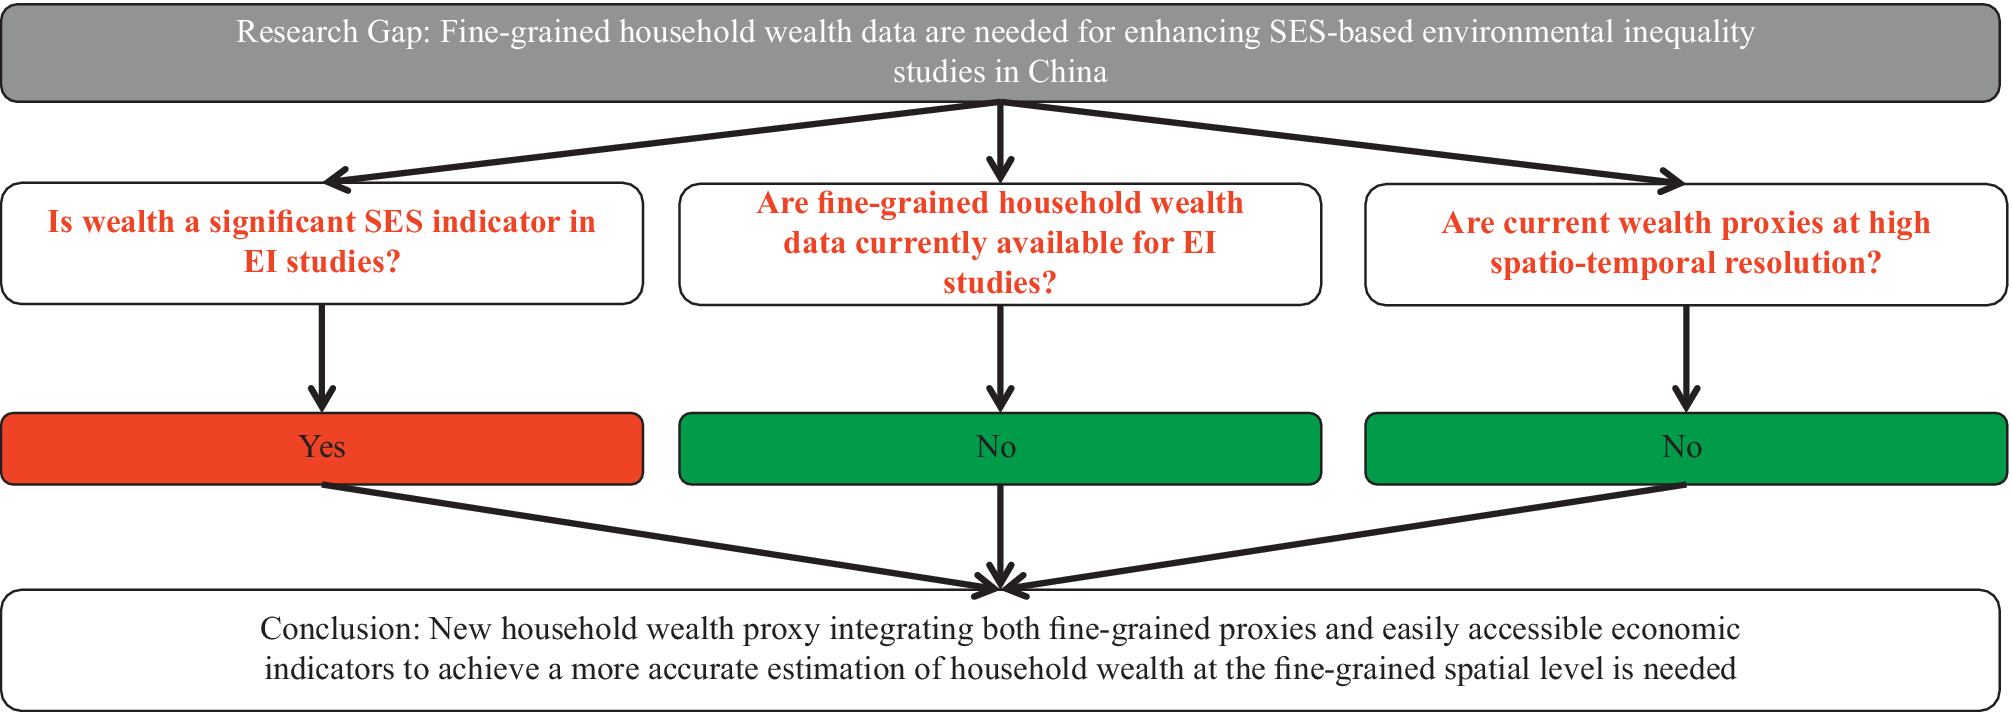
Figure 1. Methodology for identifying the research gaps.
Research Gaps and Research Significance
On wealth on SES-related EI study in China
Traditional measures of SES are often defined by income, education and occupation (Adler and Newman, Reference Adler and Newman2002). Some research has highlighted strong impacts of household SES on risks of environmental exposure (Evans and Kantrowitz, Reference Evans and Kantrowitz2002), such as exposure to hazardous wastes and others, indoor and outdoor air pollution, water pollution, and ambient noise (Miao et al., Reference Miao, Chen, Buzzelli and Aronson2015; Mohai et al., Reference Mohai, Pellow and Roberts2009; Pulido, Reference Pulido1996). Most EI studies have taken into account these three main components of SES, instead of household wealth, an important indicator of economic wellbeing (Morello-Frosch et al., Reference Morello-Frosch, Pastor and Sadd2001), usually by default (Hajat et al., Reference Hajat, Hsia and O’Neill2015). However, household wealth can be an influential factor in environmental exposure and EI in the United States (Morello-Frosch et al., Reference Morello-Frosch, Pastor and Sadd2001). Some scholars argue that the effect of household wealth on environmental exposure could have been easily accounted for by household income, which reflects a household’s economic wellbeing and is positively correlated with one’s environmental exposure. However, there is a significant difference in terms of the distribution of economic values represented by these two variables (Quadrini and Rıos-Rull, Reference Quadrini and Rıos-Rull1997). In both the United States and China, household wealth is more unevenly distributed than household income, which may better capture the socio-economic disparity (Budrıa et al., Reference Budrıa, Dıaz-Giménez, Quadrini and Rıos-Rull2002). Some studies have reported that the relationship between household income and environmental exposure is not particularly strong (Quadrini and Rıos-Rull, Reference Quadrini and Rıos-Rull1997; Taubenbock et al., Reference Taubenbock, Wurm, Setiadi, Gebert, Roth, Strunz, Birkmann and Dech2009). This renders household wealth a more relevant SES indicator for environmental exposure and EI studies in China.
Household wealth can reveal better the level of economic wellbeing than household income, given its higher stability and stronger influence on living standards over the longer term (Aittomäki et al., Reference Aittomäki, Martikainen, Laaksonen, Lahelma and Rahkonen2010). In the United States, fluctuating income cannot fully capture the standards of living (Carle et al., Reference Carle, Bauman and Short2009). It reflects neither one’s financial hardship experienced (Mendes De Leon et al., Reference Mendes De Leon, Rapp and Kasl1994) nor one’s affordability of goods and services (Krieger et al., Reference Krieger, Williams and Moss1997; Tucker-Seeley et al., Reference Tucker-Seeley, Harley, Stoddard and Sorensen2013). In contrast, household wealth, which measures structural and chronic poverty, instead of stochastic and temporary poverty (Hallegatte and Rozenberg, Reference Hallegatte and Rozenberg2017), is less volatile and more credible (Filmer and Pritchett, Reference Filmer and Pritchett2001; McKenzie, Reference McKenzie2005). Compared to income, wealth is prone to be more indicative of household wellbeing in Australia (Headey and Wooden, Reference Headey and Wooden2004). This is especially the case in China. When compared to developed countries, households in China tend to take precautionary measures against any unexpected reductions in future income by accumulating household wealth, in order to ensure that they can enjoy relatively more stable living standards even when their household incomes fluctuate (Giles and Yoo, Reference Giles and Yoo2007).
If household wealth can better indicate one’s economic wellbeing than household income in China, it is logical to deduce that household wealth can be a good indicator of one’s capability to avoid household exposure to environmental hazards in China. Affluent families in China have more flexibility in choosing residence location (Huang and Batterman, Reference Huang and Batterman2000), as they can afford apartments of better environmental quality (Lucas et al., Reference Lucas, Walker, Eames, Fay and Poustie2004). Moreover, a number of studies have indicated that the long-term accumulation of material welfare, instead of income in the short term, tends to be a more significant cause of health inequality (Aittomäki et al., Reference Aittomäki, Martikainen, Laaksonen, Lahelma and Rahkonen2010; Benzeval and Judge, Reference Benzeval and Judge2001; Fritzell et al., Reference Fritzell, Nermo and Lundberg2004; Rahkonen et al., Reference Rahkonen, Arber, Lahelma, Martikainen and Silventoinen2000). As household health condition tends to be correlated with exposure to environmental pollution, the poor health condition of low SES-population indirectly reveals the existence of EI among communities of different SES status (Aittomäki et al., Reference Aittomäki, Martikainen, Laaksonen, Lahelma and Rahkonen2010).
On selecting wealth as an SES indicator for intra-city EI studies in China
Current SES-related EI studies in China are conducted at the inter-city or country level. However, EI, as reflected by differential environmental exposure, may be manifested at a finer spatial level. The scale of analysis is one of the most important methodological issues in EI studies (Bowen, Reference Bowen2001; Mennis, Reference Mennis2002). In general, homogeneous environmental exposure within the study unit is assumed. This assumption is usually made abruptly without reasonable justification (Huang and Batterman, Reference Huang and Batterman2000). Air pollution, for instance, could vary significantly at the intra-city level (Li et al., Reference Li, Han, Lam, Zhu and Bacon-Shone2018). Hence, ignoring spatial heterogeneity could induce uncertainties and errors (Huang and Batterman, Reference Huang and Batterman2000). In addition, due to the spatial scaling effect, variations or even contradictions of statistical results could be identified when spatial data are aggregated at different spatial resolution units (Jelinski and Wu, Reference Jelinski and Wu1996; Wu, Reference Wu2007). In the past, such assumption may not be problematic, because the environmental monitoring data obtained may not be fine-grained due to restrictions in the number of monitoring stations established. In recent years, we have seen the environmental monitoring data evolving toward being more fine-grained with increasing monitoring coverage or interpolating techniques assisted by more advanced algorithm, but potentially relevant SES indicators are yet to achieve comparable resolution. In the United Kingdom, extensive high-quality national monitoring networks are required by the Environment Act 1995 to produce 1-km resolution emission inventory (Longhurst et al., Reference Longhurst, Irwin, Chatterton, Hayes, Leksmono and Symons2009). In Hong Kong, Li et al.’s (Reference Li, Lam, Chen and Gu2017) research has also obtained fine-grained air pollution data at 100 × 100 m spatial resolution, achieving 82% accuracy. EI studies are usually spatially dependent (Fernández and Wu, Reference Fernández and Wu2016; Huby et al., Reference Huby, Cinderby, White and de Bruin2009; Krieger et al., Reference Krieger, Chen, Waterman, Soobader, Subramanian and Carson2002), and can be distorted by the scaling effect (Baden et al., Reference Baden, Noonan and Turaga2007; Cutter et al., Reference Cutter, Holm and Clark1996). Research on the spatial pattern of EI in Chile has shown that the scale of study affects both distribution and correlation intensity between SES and environmental variables (Fernández and Wu, Reference Fernández and Wu2016). Another study conducted in Singapore has shown that EI appears to be stronger when examined at smaller spatial scales, whereas SES indicators are prone to be skewed in frequency distributions at finer scales (Tan and Samsudin, Reference Tan and Samsudin2017). Hence, comparable SES data of similar fine-grained resolution as environmental variables are urgently needed.
Current SES-related EI studies in China conclude that the wealthier the city, the higher the air pollution exposure. This may contradict the results obtained at the intra-city level, as revealed by a recent study conducted in Hong Kong (Li et al., Reference Li, Han, Lam, Zhu and Bacon-Shone2018). This fact is consistent with the deduction of the scale effect, and provides the hints on why inter-city level is not adequate for EI studies. More specifically, research shows that the 30 most economically powerful cities in China are exposed to higher levels of PM2.5 pollution, based on the census data at prefecture city level (Wan and Su, Reference Wan and Su2017). However, research in Hong Kong has demonstrated that, when examining environmental exposure at the Constituency Area (CA)-level (with Hong Kong divided into 412 CAs) across the same city, the lower SES communities are the victims of higher air pollution (Li et al., Reference Li, Han, Lam, Zhu and Bacon-Shone2018). Evidences of EI shown at the intra-city, including EI that are associated with differential exposure to air pollution and water pollution, differential access to waste disposal, urban greening, and natural resources (Davoudi and Brooks, Reference Davoudi and Brooks2012), have been identified in cities such as the United Kingdom and the United States (Bowen, Reference Bowen2001). Without accounting for the scale-dependency of EI, policymakers might risk making too general a conclusion that people with higher SES are exposed to worse environmental quality across all geographic scales, which would affect quality environmental decision-making.
Environmental policy addressing EI will become more effective if one can specify which specific geographical regions and which specific SES groups will require specific adjustments or attention, instead of providing general guidelines or directions. EI is the result of the complex interaction between individuals in the environment (Davoudi and Brooks, Reference Davoudi and Brooks2012). It is important to investigate the fairness of distributing environmental goods not only at the national or the provincial level, but also at the intra-city level (Schlosberg, Reference Schlosberg2004). Intra-city EI research offers new insights on how EI is at work at the micro-level, and creates opportunities for more bottom-up environmental policy-making (Hallegatte and Rozenberg, Reference Hallegatte and Rozenberg2017). For instance, even when climate change-related EI has been widely identified at the global level, uncovering the experience of micro-level EI could still offer significant insights to advance local climate policy-making (Fisher, Reference Fisher2015). Research in East Africa highlights that choosing a more fine-grained spatial scale model for EI research could improve management strategies (MacKenzie et al., Reference MacKenzie, Baird and Hartter2014). Environmental planners have also advocated the benefit of conducting more fine-grained analysis at the block or the community level rather than the city or the regional level to advance local environmental planning (Tan and Samsudin, Reference Tan and Samsudin2017). In short, the mismatch between geographical scales of EI research and policy-making would lead to erroneous misinterpretation of EI, and weaken the effectiveness of environmental policy-making (Fernández and Wu, Reference Fernández and Wu2016).
To the best of our understanding, except for Li et al. (Reference Li, Han, Lam, Zhu and Bacon-Shone2018), who focus on Hong Kong, no SES-related EI study conducted in China has so far examined the relationship between wealth and EI at the fine-grained intra-city level. The relationship between SES and environmental risks has been investigated at the national or the provincial level in China (Pratt et al., Reference Pratt, Vadali, Kvale and Ellickson2015); such results may not be sufficient to provide the needed evidence for location-based EI alleviation. Even though fine-grained wealth-related study is crucial for the Chinese Government to understand the potential crisis induced by EI and to develop effective precautionary measures, it has yet to be conducted in China (Pratt et al., Reference Pratt, Vadali, Kvale and Ellickson2015).
On high spatio-temporal resolution and representative wealth database for intra-city China
The major challenge of conducting fine-grained SES-based EI analysis comes from the low spatial resolution of current wealth databases. A list of databases that provides Chinese household wealth data is summarized in Table 1, and we will discuss below why these databases are not suitable for our use.
Table 1. Database of household wealth in China
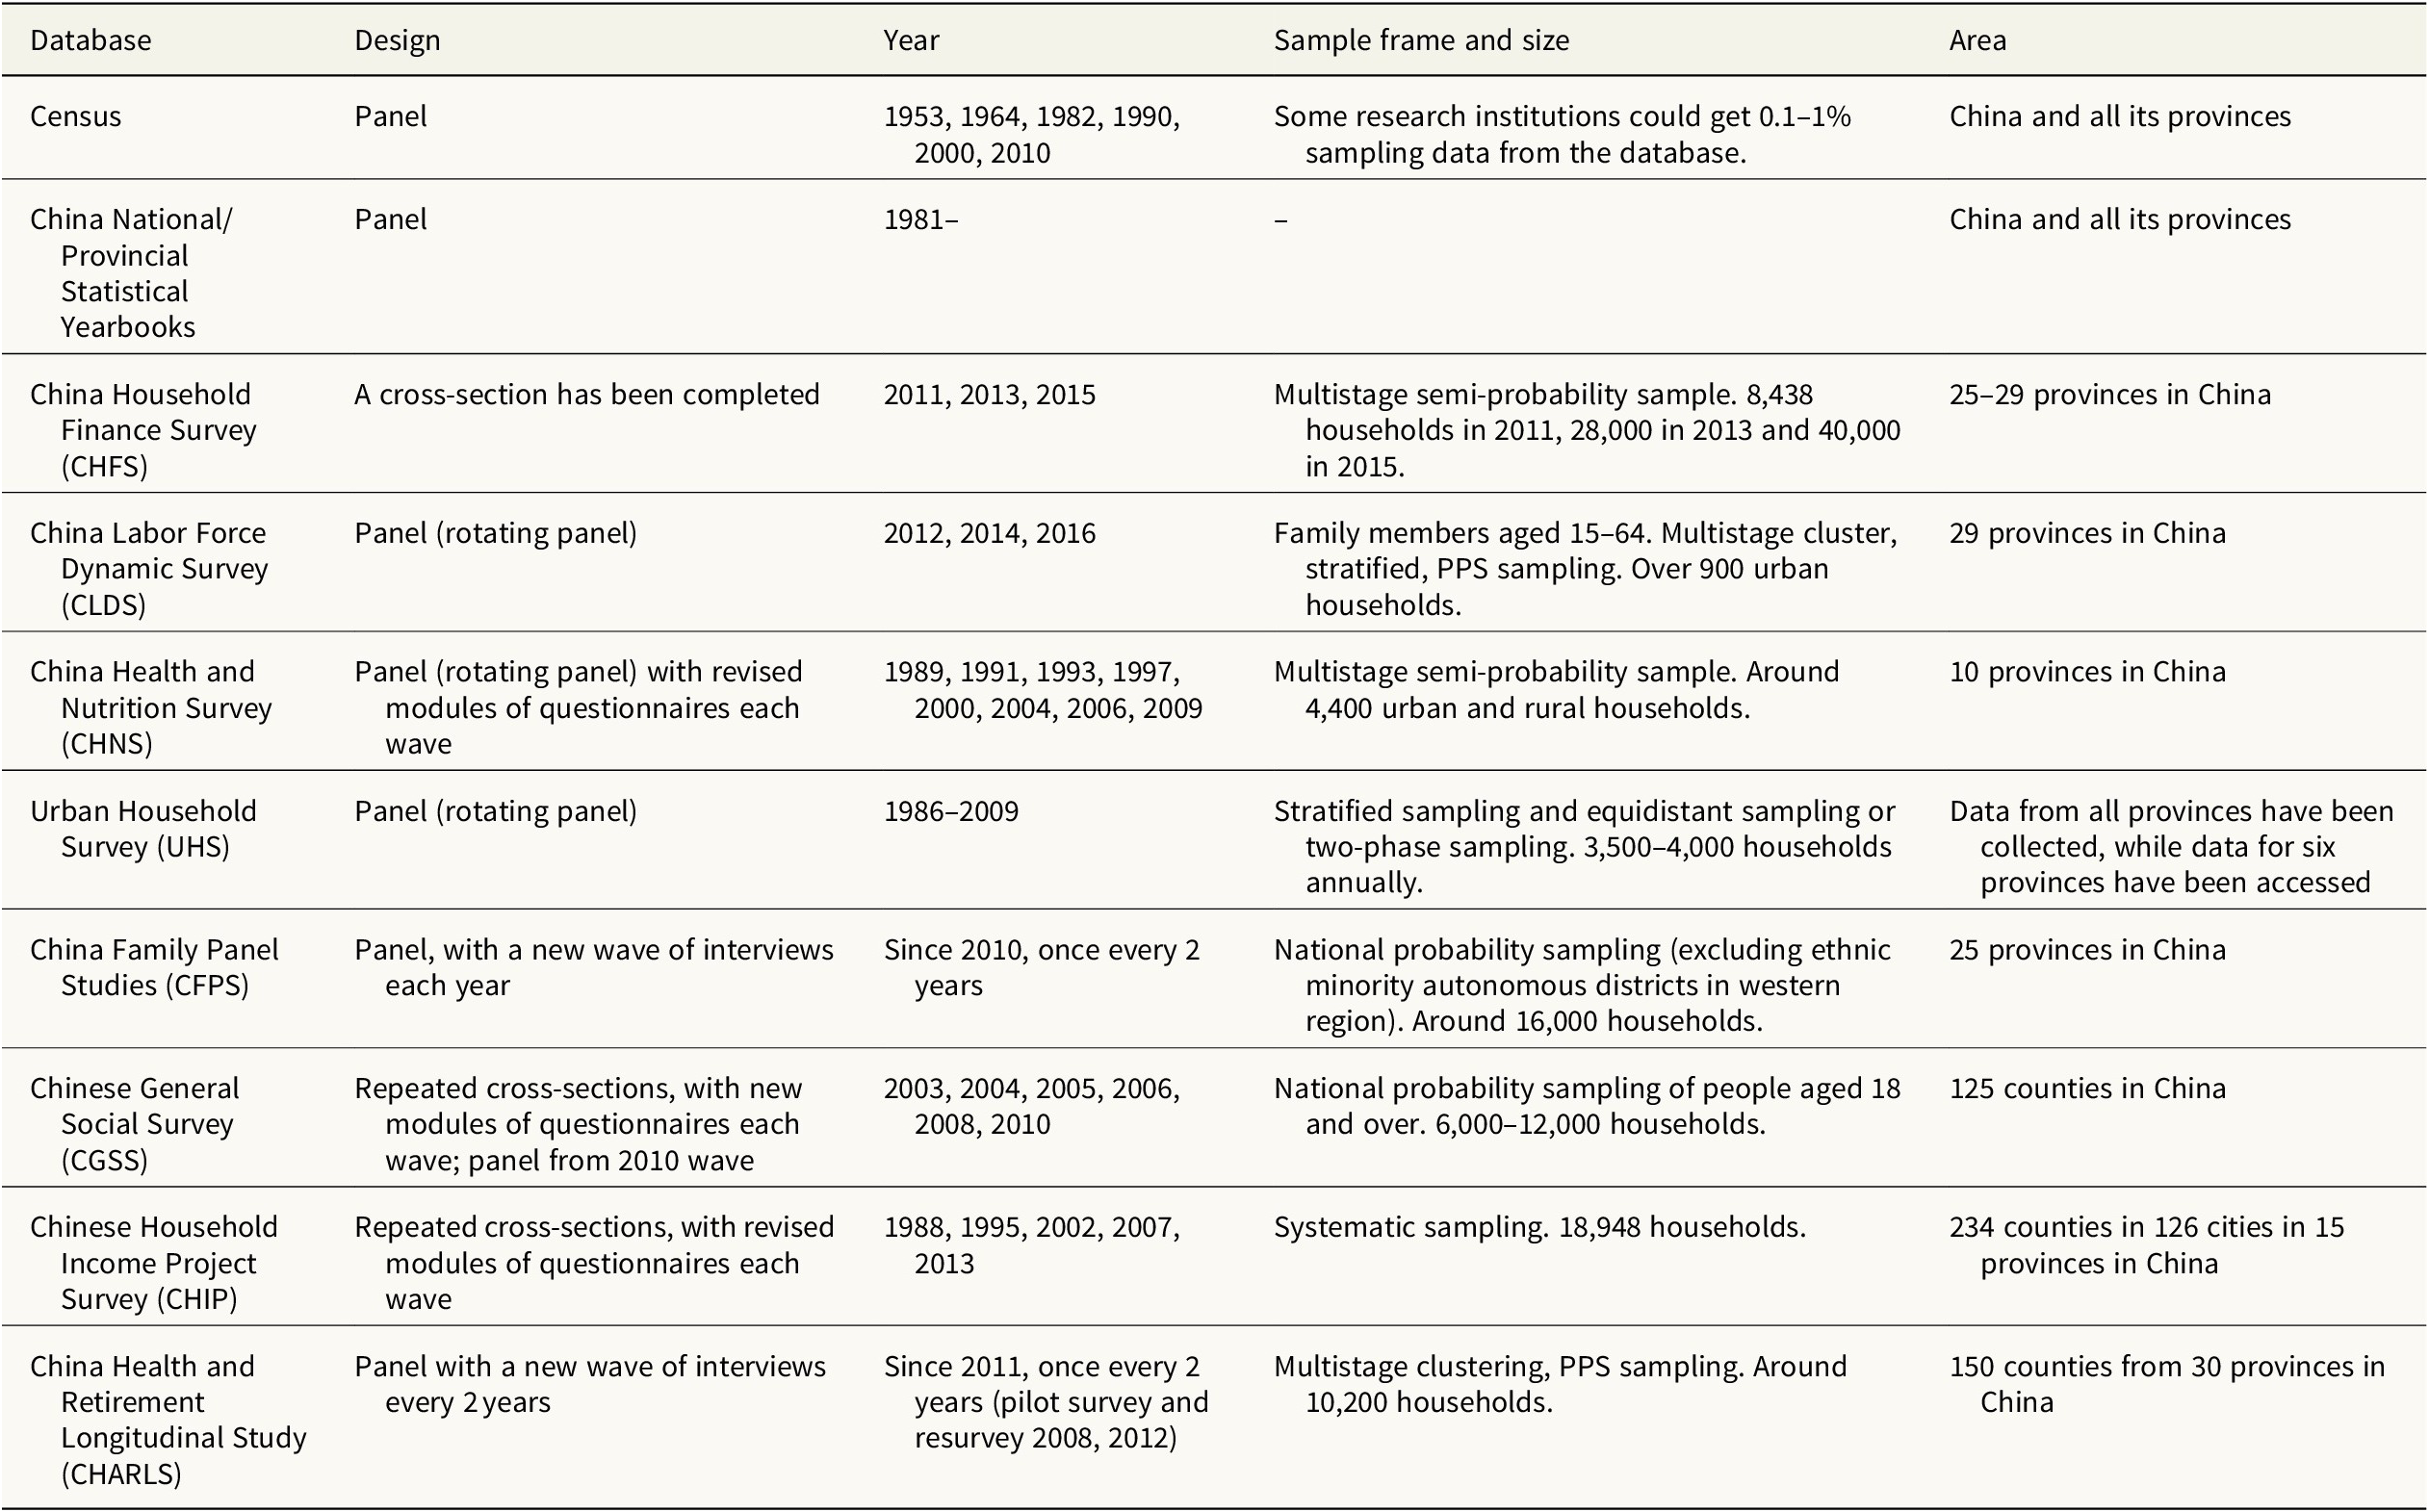
Chinese censuses should in theory obtain household information covering the entire population in China. However, micro-data are not commonly available to the public. Only a few research institutions with specific permission given by the government can have access to the data, representing only 0.1–1% of the sampled data. Furthermore, the time interval between two population censuses is large—it is only taken roughly every 10 years. Hence, the outdated Chinese censuses have failed to provide a true representation of the country’s annual socio-economic development.
Other household surveys besides the national census have been conducted. One of the challenges of such household surveys is their very small sample size; the China Family Panel Studies (CFPS) and Chinese Household Income Project Survey (CHIP) in Table 1 for instance, just sample annually around 16,000 and 18,000 households, respectively. Another challenge being that the disclosure of geographic information in most such household surveys is limited to the provincial level only. As observed from Table 1, only a few surveys, such as the Chinese General Social Survey (CGSS) have broken this down into 125 counties. In reality, China consists of more than 2,800 counties and 660 cities. The data collected from household surveys thus has a low spatial resolution and not representative enough of the entire population. This makes it difficult to determine the wealth distribution and household differences within the intra-city regions, and presents one of the biggest obstacles to conduct fine-grained socio-economic analysis across China. Furthermore, it usually takes one to 2 years for the data to become available to the public after the corresponding surveys have been completed. The lack of timely data is especially inconvenient for researchers to investigate the current intra-city EI reality in China and provide meaningful recommendations for policymakers.
To summarize, the two critical defects for utilizing the current household database in fine-grained EI analysis are:
1. Low coverage and low spatio-temporal resolution—not all blocks or communities are covered in the research; in addition, some data are often infrequent and not timely.
2. Statistical unreliability—the sampling size within each geographical unit is too small, thus undermining the power of statistical tests and the precision of estimations.
In order to overcome these challenges, it is essential to investigate new fine-grained proxies gathered from other data resources to support high spatio-temporal EI studies in China.
Use of Wealth Proxies for High Spatio-Temporal Resolution
As discussed in Section “Research Gaps and Research Significance,” despite the current research gaps in fine-grained wealth database for intra-city China, such database is yet to be established. Hence, proxies that support high spatio-temporal resolution SES-based EI studies in China would be needed. Table 2 summarizes some of the proxies, which have been proposed. We shall next investigate each of these proxies in details below.
Table 2. Summary of five wealth proxies
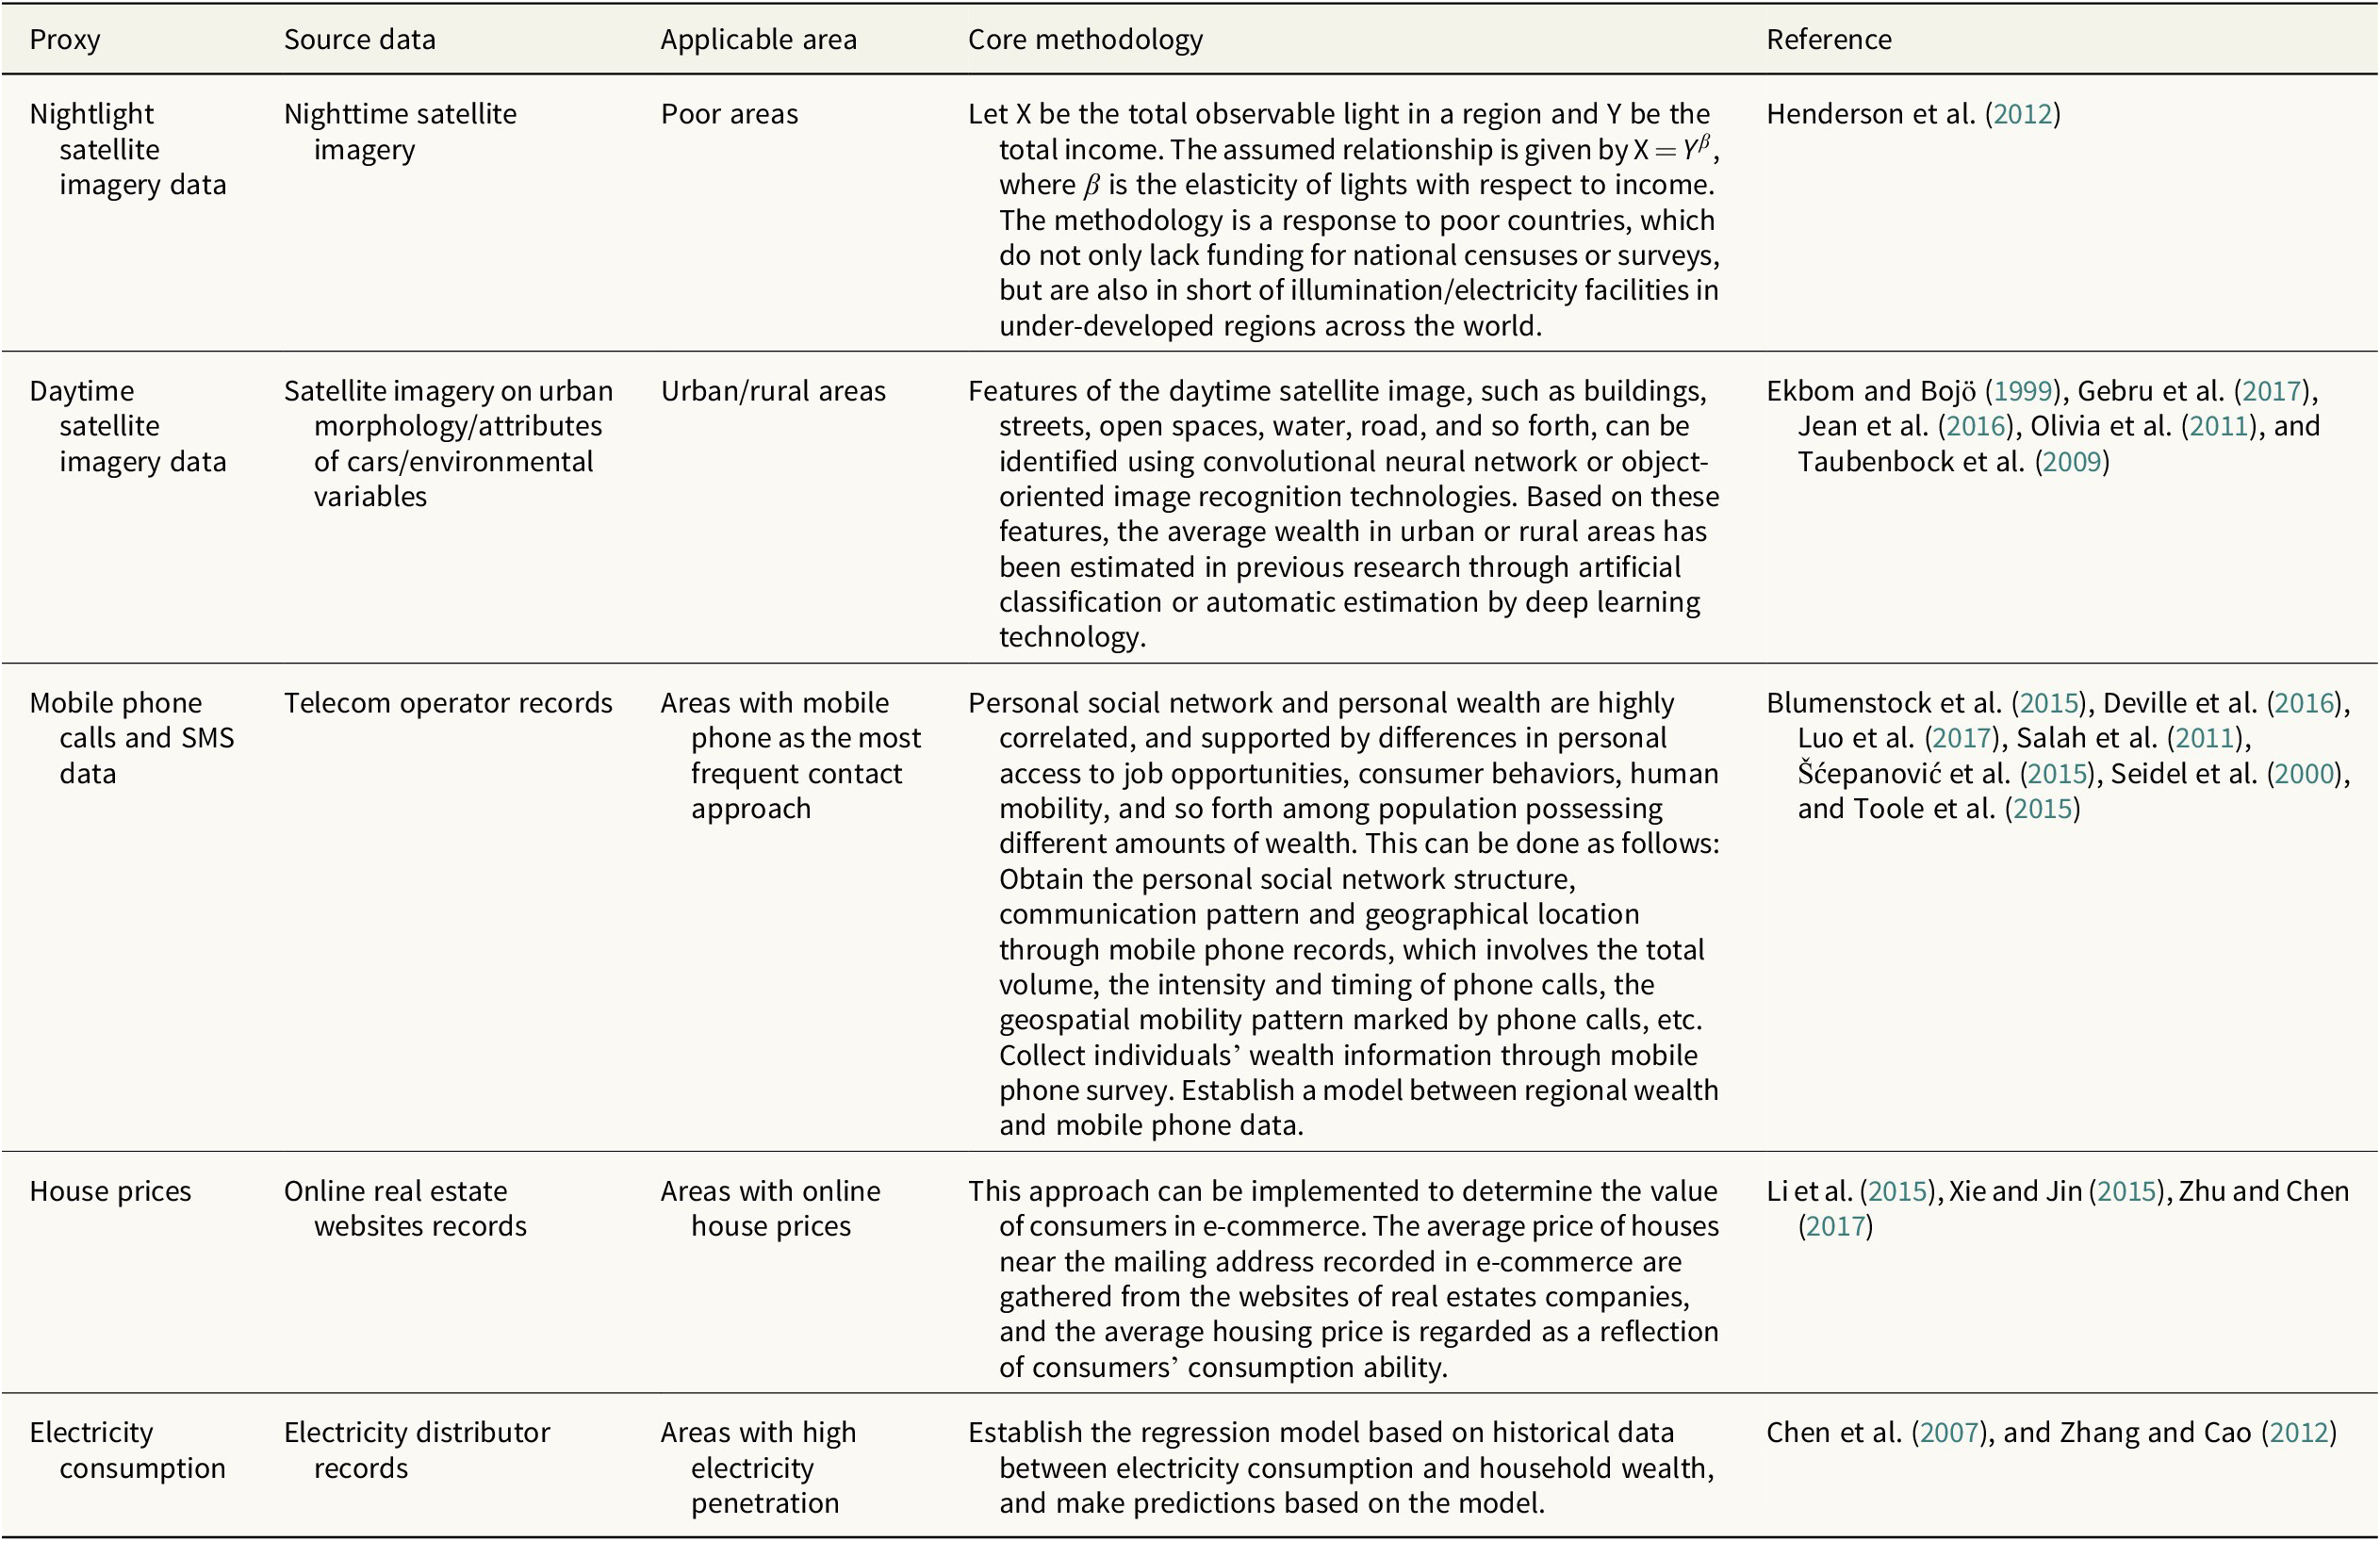
Night-time satellite imagery data
Past studies show that nightlight emission is a legitimate measure of wealth distribution at a spatial level (correlation: 0.73–0.87) (Weidmann and Schutte, Reference Weidmann and Schutte2017). Therefore, rather than relying solely on the nonrepresentative, time-consuming and often inconsistent household survey data as in traditional research, there is a recent trend in developing socioeconomic models that use satellite-based data as proxy measurements and to calibrate such models based on survey data (Elvidge et al., Reference Elvidge, Sutton, Ghosh, Tuttle, Baugh, Bhaduri and Bright2009). Key benefits of utilizing satellite imagery data is shown in Figure 2, which include its relatively low acquisition cost, public availability, data consistency, and most importantly, the high spatial and temporal accuracy it provides to improve our understanding in socio-economic activities of humanity (Elvidge et al., Reference Elvidge, Sutton, Ghosh, Tuttle, Baugh, Bhaduri and Bright2009).
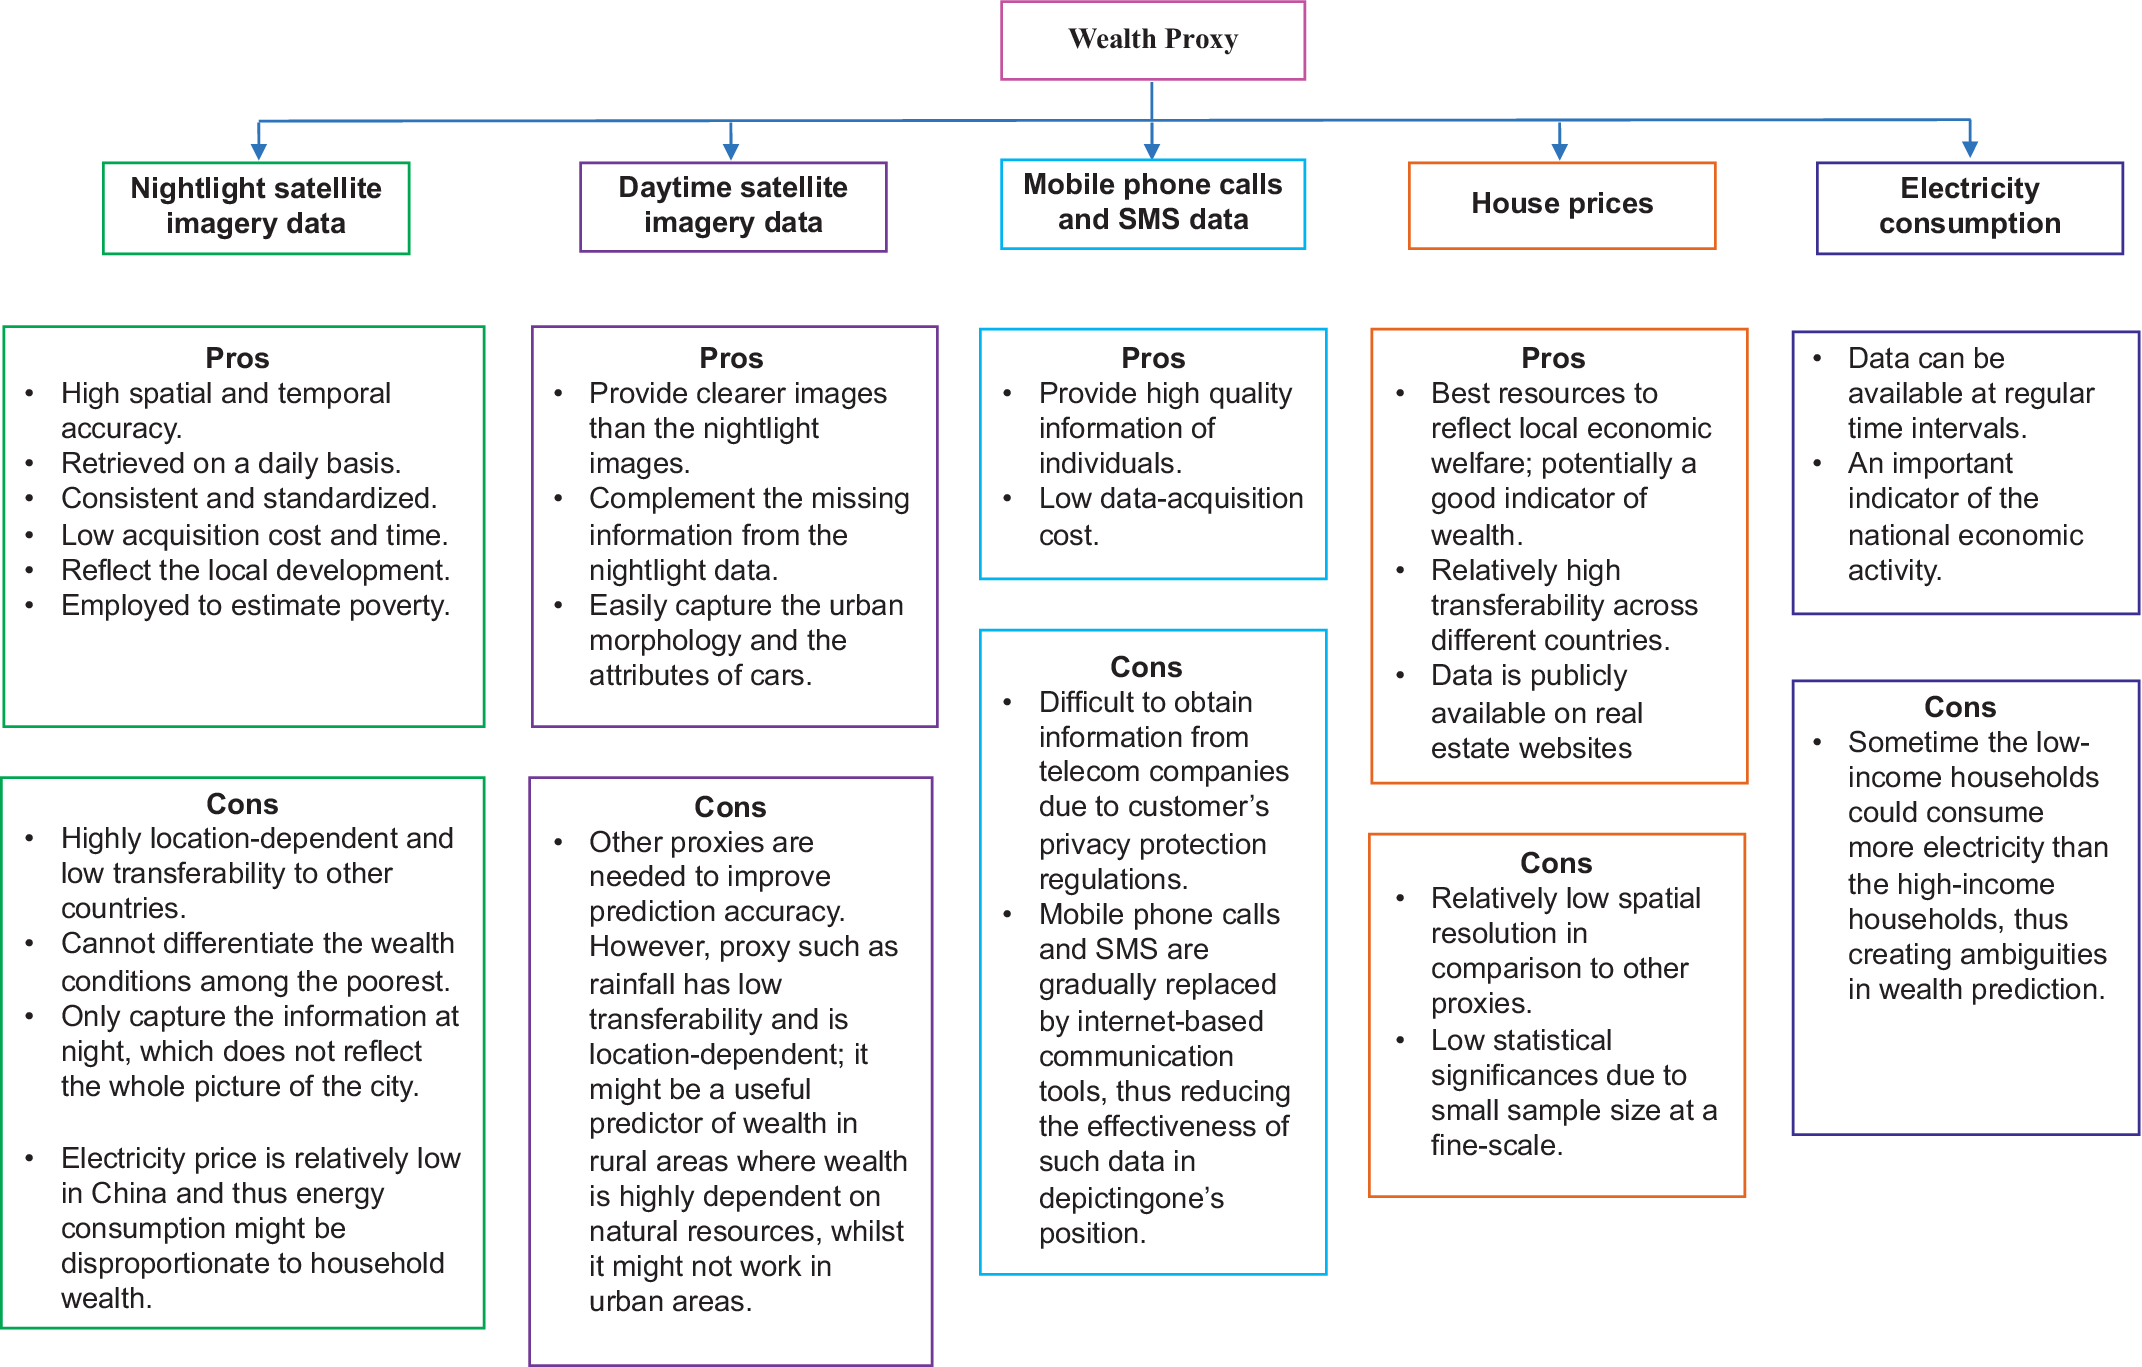
Figure 2. Pros and cons of five existing wealth proxies.
However, there are a few limitations on this methodology (Fernández and Wu, Reference Fernández and Wu2016), which has been reported in Figure 2. If we simply employ nightlight satellite data alone, we might face the difficulty of distinguishing between densely populated poor areas and sparsely populated wealthy areas. Nightlights only display little variation in extremely poor regions such as Africa since it is simply uniformly dark at night. Hence, this motivates us to use daytime satellite imageries such as street maps, land features and water resources as a complement of the nightlight data.
Daytime satellite imagery data
As discussed above, nightlight may serve a good intermediate proxy measurement of wealth, but we also need other proxies to further facilitate cases when nightlight alone cannot predict wealth at high accuracy. Past studies showed that daytime visible features such as roofing materials and urban morphologies have demonstrated a significant linear relationship with local expenditures at the block level (Fernández and Wu, Reference Fernández and Wu2016); attributes of cars and other environmental variables such as rainfall and topography also have appeared to be legitimate measures for predicting local wealth at high-spatial resolution (Cao et al., Reference Cao, Wang and Li2016; Dargay et al., Reference Dargay, Gately and Sommer2007; Watmough et al., Reference Watmough, Atkinson, Saikia and Hutton2016).
Mobile phone calls and SMS data
Another popular proxy for estimating one’s socio-economic status is the use of personal mobile phone usage history. The rationale for using mobile phone metadata as a proxy is not just due to its ability to capture one’s social network and characteristics of communication events and travels, but also its capability to reflect other welfare information like consuming behaviors and histories (Candia et al., Reference Candia, González, Wang, Schoenharl, Madey and Barabási2008). There is enough evidence to justify the significant relationship between mobile phone usage and many socioeconomic factors such as demographic statistics and education levels (Frias-Martinez and Virseda, Reference Frias-Martinez and Virseda2012). In particular, previous research showed that an individual’s wealth can be predicted at high accuracy from features of personal social network retrieved from his/her mobile phone calls and SMS metadata (Luo et al., Reference Luo, Morone, Sarraute, Travizano and Makse2017). Therefore, mobile phone metadata provides an alternative to collecting localized and timely information and again, serves as a complement of the traditional methods such as household survey data and national censuses, often at a relatively lower data acquisition cost.
Nevertheless, mobile phone usage can only provide localized information since the communication behaviors could vary dramatically across countries due to cultural differences, which hampers the transferability of this proxy data (Fernández and Wu, Reference Fernández and Wu2016). Moreover, mobile phone data are usually owned by private companies and might not be available to researchers due to the customers’ privacy protection regulations.
House prices
In contrast to European countries where financial assets and pension funds are the main components of an individual’s wealth, scholars have shown that housing assets account for over 70% of household wealth in China, and that the wealth-to-income ratio is approximately 9.2:1 (Xie and Jin, Reference Xie and Jin2015). These figures are still growing and thus it is natural to consider using house prices as a predictor of household wealth. On the other hand, house prices can also provide useful information about the land resources and reflect the local economic development. It is also convenient to gather house prices from online real estate company websites. A study has shown that the household income is positively correlated to house price (Sun, Reference Sun2015), and thus house price can be used as a potential predictor of the household’s economic status and consuming ability.
Electricity consumption
In addition, electricity expenditure derived from the records of electricity distributors could be a potential proxy for household wealth, although it has not been used in the literature yet. One advantage is that the data can be gathered at regular time intervals. A study shows that electricity usage is an important indicator of national economic activity in Asian countries (Chen et al., Reference Chen, Kuo and Chen2007). Some Chinese scholars have conducted a survey in China, and have claimed that there is a positive correlation between household income and electricity consumption (Zhang and Cao, Reference Zhang and Cao2012).
However, the credibility of using this proxy for household wealth is still questionable, as the Tianjin study excludes the records of both low-income households with high electricity consumption and high-income households with low electricity consumption, without providing sufficient details on the exclusion criteria.
Each proxy has its own pros and cons. In Figure 2, we summarize the advantages and disadvantages of the proxies used in the previous studies.
Assessment of the performance of existing proxies for estimating wealth at the intra-city level in China
In this section, we provide a systematic comparison of the performance of household wealth proxies (see Table 3). Five criteria are used to assess the household wealth proxies’ performance:
1. Spatial resolution, which refers to the size of the spatial dimension that a proxy covers.
2. Direct relevance with household wealth proxy, which refers to how directly a proxy is related to household wealth.
3. Applicability to urban China, which refers to how suitable a proxy can be applied to the context of urban China.
4. Data availability, which refers to how easily accessible the data are to the public.
5. Temporal resolution, which refers to how frequently such data is updated.
Table 3. Assessment of the performance of household wealth proxies based on five criteria
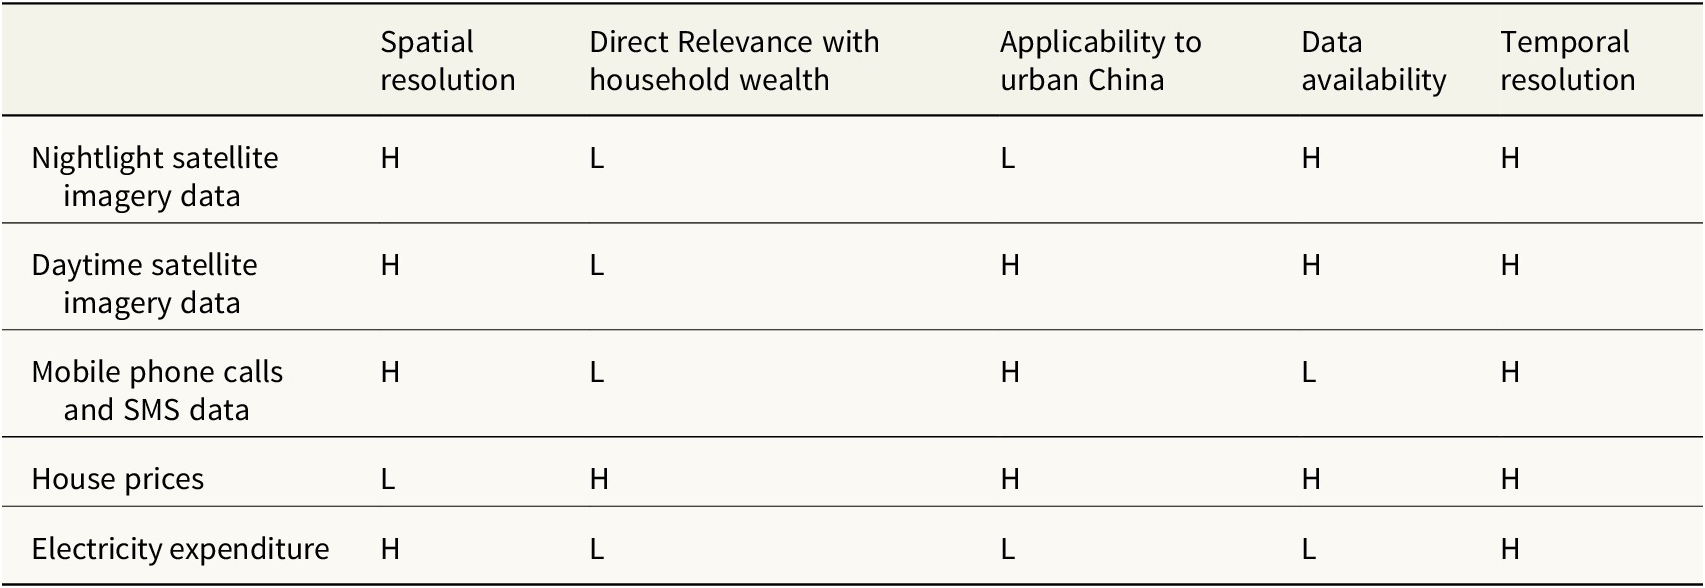
Spatial resolution—H means high spatial resolution corresponding to square grids less than 100 m per side, L means low spatial resolution corresponding to square grids greater than 100 m per side.
Direct relevance with household wealth—H means directly related to household wealth, L means indirectly related to household wealth.
Applicability to urban China—H means highly applicability to urban areas in China, L means low applicability to urban areas in China.
Data availability: H means data readily accessible by the public, L means data not readily accessible by the public.
Temporal resolution—H means data updated at least yearly, L means data not updated at least yearly.
The criteria are listed in rank order in terms of importance in proxy performance. The higher the performance, the higher the reliability of the existing proxy model to estimate wealth. In Table 3, H indicates a high performance in any of the aspects (1–5) described above and L indicates a low performance. Detailed descriptions of performance are included as Notes to Table 3.
In terms of spatial resolution, house prices posted on real estate websites may not perform well since the number of houses on sale in a small sub-district may be relatively limited, whereas the sample size may limit the proxy’s statistical representativeness, while other proxies derived from satellite images have higher spatial resolution (ranging from 1 × 1 m to 10 × 10 m) (Jin and Davis, Reference Jin and Davis2005; Karantzalos and Argialas, Reference Karantzalos, Argialas and Altan2004). In terms of direct relevance with household wealth, house prices are considered more directly relevant for two reasons: first, a residential property takes up the greatest share of assets in most families, while wealthy households are more capable of purchasing expensive houses; second, house prices is a reflection of the scarcity of land resources, and serves an indicator of local economic development.
As compared to house prices, other proxies have a less direct relationship with household wealth. In terms of the proxy’s applicability to urban China, using nightlight image as a proxy may have low performance, since China is relatively well developed, cities have been provided with very good illumination facilities at night, even in some poorer districts, standard illumination systems are available, the applicability of nightlight image as a proxy to household wealth in urban China appears to be low. However, daytime satellite image has been utilized in estimating wealth in both rural and urban areas (Taubenbock et al., Reference Taubenbock, Wurm, Setiadi, Gebert, Roth, Strunz, Birkmann and Dech2009), and thus has a high adaptability. Mobile phone data (calls and SMS) may not be too applicable in China in the future since calls and SMS will likely be phased out in China due to the increasing popularity of internet-based communications via WeChat and Weibo.
In terms of data availability, compared to data from telecom operators or electricity suppliers, house prices or satellite images are more easily accessible online to avoid privacy disclosure issues. Finally, in terms of temporal resolution, it is expected that proxies based on satellite images will be updated daily. Mobile phone call and SMS data and electricity consumption data are usually aggregated over a period of time, for instance, updated monthly. Online house prices are updated hourly or daily. As such, none of the current proxies can achieve high performance in these five dimensions, it will thus be good to look for a new household wealth proxy that can be catered for fine-grained SES-based EI studies in China.
New Wealth Proxy Development
As shown above, none of the existing proxies support our need for a fine-grained and highly accurate wealth proxy for intra-city EI studies in China. In order to achieve a high performance meeting all five criteria, we propose three principal guidelines for future wealth proxy development in China:
1. Combining existing proxies to create a hybrid proxy.
2. Identifying new proxies to account for social and technological trends.
3. Deploying unsupervised or semi-supervised machine learning methodologies.
A hybrid proxy attempts to take advantage of the merits of existing wealth proxies, while avoiding their disadvantages. For China, the features extracted from daytime satellite images, mobile phone data (calls and SMS), and house prices are recognized as applicable to intra-city studies (see Table 3). Among these three types of data, only the house prices are of direct relevance to household wealth, hence it shall be kept in the new model. However, the spatial resolution of house price data is low, and should be compensated by fine-grained daytime satellite images or mobile phone data. Comparing the daytime satellite images and mobile phone data, the former has higher data availability. Hence, a combination of daytime satellite images and house prices is suggested.
More specifically, if only the daytime satellite images are utilized, it might be hard to differentiate the average household wealth between two communities with similar building structures but different locations, for instance, one in the city center and another in the suburbs. However, with the hybrid proxy, such issue can be fixed by incorporating the local house prices. Moreover, the accuracy of using the house prices to estimate the household wealth could be improved by the satellite data. Apart from improving the spatial and temporal resolution, the estimation accuracy can also be improved by observing the housing structures captured by the satellite images.
For the wellbeing of our societies, high spatial resolution gridded data sources are urgently needed, since they play crucial roles in the examination of statistical relationships/correlations for robust socio-economic analysis and technological developments. However, such data sources are unavailable in countries such as China, which creates unnecessary barriers to conduct evidence-based socio-economic research and sound decision-makings in environmental policy evaluations. Previous research has indicated that mobile phone calls and SMS data can predict the wealth of the older population, but are less powerful in predicting that of the younger population (Luo et al., Reference Luo, Morone, Sarraute, Travizano and Makse2017). This might be related to the emerging online communication platforms such as Weibo and WeChat, which have witnessed an increasing popularity among the younger generations. According to a report (Lee, Reference Lee2019), the number of daily active WeChat users in China had reached over one million in 2018, which was equivalent to around 72% of the total Chinese population (World Bank, 2019). Hence, mobile phone data could be a valuable economic activity proxy if the access of online social media network data is permissible/available. Besides, geo-coded data and satellite imagery provided by Google or Gaode map in China can also serve as useful inputs for household wealth proxy constructions. Moreover, various wealth proxy data can be collected via opportunistic sensing or passive crowdsourcing. In some pilot studies, personal mobility data extracted from Uniform Resource Locator (URL) requests (Zhao et al., Reference Zhao, Huang, Yao and Fu2019) and geo-coded text data extracted from online forum platforms (Saeidi et al., Reference Saeidi, Venerandi, Capra and Riedel2017) are found to be correlated with the economic conditions/characteristics at the individual and the neighbourhood level; this could be left as a future research area in our studies of wealth proxy development in China.
Given the lack of relevant ground truths for relevant wealth proxies in high spatial resolution in China (see Methodology), it would be important to develop a more representative household wealth proxy based on unsupervised or semi-supervised machine learning methods from big data.
For instance, an integrated wealth proxy that reflects a household’s spending across all aspects of life can be developed based on proxies that represent expenditures on accommodation, transportation, daily necessities, clothing, accessories, education, and so forth. Zhu et al. (Reference Zhu, Chen, Li and Wang2018) conduct a related study and extract individual home locations, mobility histories via smart card records, local housing prices of the areas travelled by individuals via real estate websites, consumer price data via business review websites, and levels of individual consumption, to develop a composite wealth index based on statistical clustering and feature selection methods such as principal component analysis. The study does not use survey data as the primary input, and is yet to comprehensively account for different types of expenditures of individuals. Furthermore, it has yet made good use of the advanced unsupervised or the semisupervised machine learning techniques, which may be more relevant for multimodal data input and more powerful for discovering any nonlinear relationship between wealth and wealth proxies.
To address these research gaps, a proxy model that follows the three principal guidelines might provide important insights into how the household wealth differs among Chinese citizens residing across different parts of a city, which may subsequently benefit intra-city EI studies.
Implications on Data Policies for China
Our study points to the need for new data policies, as well as high quality data with high availability that meet the principles of privacy protection and ethics in China, for developing high resolution proxy for fine-grained EI analysis and for facilitating relevant policy decision-makings in China. Our policy recommendations and the potential implications include the followings:
Data quality and availability
Given that survey data serve the basis for household wealth analysis, poor survey data quality will inevitably carry negative consequences and misleading statistics (Zhang, Reference Zhang2018). It is therefore extremely important to ensure the quality of survey data for reliable causal inference analysis and sound decision-makings. In order to improve the availability and quality of household wealth survey data in China, data policies should champion openness, representativeness, security and accountability (Gil-Garcia et al., Reference Gil-Garcia, Chun and Janssen2009), and reduce bias and errors (Lutes, Reference Lutes2015).
Although it is stated by laws that any governing statistics in China with census data obtained at or above the county level should be made publicly available in a timely manner (National Bureau of Statistics of China, 2012) it is still unclear how the regulations should be implemented; for instance, when and what type of information should be disclosed, at the fine-grained resolution (National Bureau of Statistics of China, 2002). At the moment, though existing household wealth datasets in China collected via the census method have the highest accuracy and can represent a sizeable population across a broad geographical scale, there is by no publicly available means for researchers to access these census data at the fine-grained resolution. In addition to the government-led census initiatives in China, a number of household wealth surveys have also been conducted by nonofficial institutions, yet the sampling methods in these surveys vary significantly which induces inconsistency and biases in the data (see Table 1).
Establishing online statistical data platforms to provide socio-economic information at the fine-grained resolution can provide the needed data for evidence-based socio-economic analysis and decision-making in China. Such open data can be customized and downloadable for future research studies. To improve data quality, nonofficial statistics can be an important complement to the official census data; nevertheless, it is important to set statistical standards/guidelines on data sampling and collection. An official guideline detailing the sampling methodology can enhance the representativeness of the sampled data and reduce the potential biases and improve accuracy in evidence-based decision-making. Moreover, public consultation and stakeholder engagement exercises should play a role in shaping the design and content of the data collected, which has been a practice adopted by the government in the United Kindom to ensure that the data collected is usable to the public (Cabinet Office, 2018). In the future, China’s online statistical data platforms may also host specific stakeholder meetings to ensure that the data released can meet the demands of their users.
Data privacy and security incorporating moral and ethical principles
The release and use of open data for wealth proxy in developing economies may raise concerns about data privacy and ethics. In the conflict-prone regions, exposing the individuals’ identities may produce grave consequences on individuals. Given the need and research significance of open household wealth data in China, data policies should promote the development of moral- and ethics-driven data system for sound evidence-based decision-makings in China.
As compared to personal privacy protection, the policy of governing moral and ethical access of data by the general public remains relatively under-developed in China. Most western countries have established privacy protection units to protect their citizens’ private information (Zhang, Reference Zhang2018). China has also set up a new department, the Public Security Bureau, subsumed under the Ministry of Industry and Information Technology, to protect its citizens’ privacy. However, privacy protection has yet become a dominant function of the department.
Establishing a specific government agency to regulate data privacy and security can facilitate implementation of relevant laws, and protect the citizens’ privacy (Zhang, Reference Zhang2018). In addition, a national guideline outlining the moral and ethical principles for safeguarding personal data privacy and security can be developed by the government. The guideline may cover the following ethical and moral principles: the principle of respect; the principle of informed consent; the principle of equilibrium; and the principle of social rectification (Yu, Reference Yu2004). Ensuring the moral and the legal use of data can pave the way for social stability and harmony (Lü, Reference Lü2005). Furthermore, the government, academia and industry can work together to facilitate the development and implementation of data security and privacy protection technologies across the public and the private sectors, to enable privacy-heightened evidence-based decision-makings. To protect survey data security, access control mechanisms that segregate the data depending on the level of data sensitivity can be introduced among institutions of data science (Conrad et al., Reference Conrad, Misenar, Feldman and Riggins2012). A decentralized data sharing system can be established to enable sensitive data exchange between government agencies and individuals/companies, based on blockchain distributed ledgers and smart contract technologies (Engin, Reference Engin2018; Zyskind and Nathan, Reference Zyskind and Nathan2015). For wealth data proxy development that involves individual data such as mobile phone records and electricity expenditure, data privacy can be enhanced via data minimization, anonymization, and encryption (Li et al., Reference Li, Yu and He2019). Such measures can be applied throughout the lifecycle of wealth data proxies, including data collection, transmission, storage and analysis. When processing confidential data and releasing results of personal information associated with personal health, financial or daily activities (e.g., shopping history and smart card records), a number of privacy and security techniques can be adopted to improve computational security and to regulate information disclosure (Crowcroft and Gascón, Reference Crowcroft and Gascón2018). Measures can be undertaken to protect personal privacy and security, via differential privacy, homomorphic encryption, secured multi-party computation, enclave and edge cloud (for instance, the databox technology developed by Prof. Jon Crowcroft and his team of the University of Cambridge) (The Royal Society, 2019).
Conclusion
Our study has demonstrated that household wealth may serve a more relevant predictor of differential exposure and related EI at the intra-city level than income in China. With the growing availability of fine-grained environmental data, more fine-grained household wealth-related EI studies are urgently needed. We put forward the following conclusions and recommendations to improve household wealth socio-economic EI study in fine-grained resolution in China:
1. Fine-grained household wealth-related EI studies that carry both research and policy significance, and provide better understandings of intra-city household wealth distribution are needed. Spatial resolution can greatly influence the statistical results of EI studies, and policy interventions based on intra-city analysis may reduce city-level EI in China. However, only few significant studies have been conducted at the intra-city level, thus restricting our understanding of the intra-city level air pollution induced EI.
2. The small sample size extracted from household economic surveys lack representativeness for any fine-grained socio-economic studies in China. Moreover, existing freely accessible household wealth databases do not provide the locations of Chinese households, due to the privacy protection laws in China. Therefore, current household wealth databases could hardly support fine-grained socio-economic studies in China. There is a need to develop a new representative household wealth proxy for fine-grained socio-economic and EI study in China.
3. The fine-grained wealth proxies developed from the nightlight imagery, the daytime satellite imagery, the mobile phone calls and the SMS data, the house prices and the electricity expenditure, can hardly meet our five proposed criteria, namely, spatial resolution, temporal resolution, direct relevance with household wealth, applicability to urban China, and data availability.
4. A new household wealth proxy is recommended to facilitate the fine-grained intra-city EI study in China. A hybrid household wealth proxy incorporating the daytime satellite images, the house prices, and the mobile phone data retrievable via internet-based communication tools may support fine-grained socio-economic-related EI study, assist the formulation of proper urban policies to close the EI gap, and to improve the quality of life of citizens in China.
5. Legal, policy and technology measures for improving data quality and availability, and for improving morals and ethics, for securing privacy and security of data collection and access, are fundamentally important to ensure that in future, good quality SES data in fine-grained resolution, such as the wealth proxy data, can be fully developed and openly shared in an ethical and moral manner to facilitate sound evidence- and location-based decision-makings in China.
Acknowledgments
We gratefully acknowledge the insights shared by Stephanie Sun, on using the house prices as a proxy for household wealth in China, the research assistance of Shanshan Wang, and the editorial assistance of Clinton Ohlers on the Section, “Implications on Data Policies for China”.
Funding Statement
This research is supported in part by the Theme-based Research Scheme, Research Grants Council, under Grant No. T41-709/17-N. The funder had no role in study design, data collection and analysis, decision to publish, or preparation of the manuscript.
Competing Interests
The authors declare no competing interests exists.
Data Availability Statement
Data sharing is not applicable to this article as no datasets were generated or analysed during this study.
Author contributions
Conceptualization, V.O.K.L., J.C.K.L; Methodology, J.C.K.L.; Formal Analysis, J.C.K.L. and R.B.; Data Curation, R.B.; Writing—Original Draft, J.C.K.L., Y.H., R.B., J.L., Writing—Review and Editing, J.C.K.L., Y.H., J.L., and K.J.M.; Supervision, J.C.K.L. and V.O.K.L.; Funding Acquisition, J.C.K.L. and V.O.K.L.


 Open access
Comments
No Comments have been published for this article.