


1. Introduction
The Southern High Plains region of Texas (SHPT) is one of the most cotton-intensive production areas in the world. Producers in this region face challenges related to increasing input costs, volatile seed and lint prices, and limited productivity given water constraints (Parajulee and Shrestha, Reference Parajulee and Shrestha2014). Irrigation water and nitrogen fertilizer are two common limiting input factors in SHPT cotton production. Declining Ogallala aquifer volume has contributed to increased proportions of dryland cotton acreage during the last 10 years (U.S. Department of Agriculture, National Agricultural Statistics Service, 2018). Additionally, cotton farmers are challenged by increasing nitrogen fertilizer prices (Bronson et al., Reference Bronson, Booker, Bordovsky, Keeling, Wheeler, Boman, Parajulee, Segarra and Nichols2006). Moreover, nitrogen is one of the most expensive inputs, accounting for 15% to 20% of cotton production costs (Smith, Reference Smith2016).
Economically, optimal fertilizer rates can be obtained by maximizing expected net revenues subject to crop yield functions. The fitting of crop yield response functions to yield data has become an increasingly common method among economists to derive economic profitability models in agricultural crop production systems (Tembo et al., Reference Tembo, Brorsen, Epplin and Tostão2008).
Of all the functional forms developed on theoretical and empirical grounds, polynomial functions are most commonly used (Frank, Beattie, and Embleton, Reference Frank, Beattie and Embleton1990; Harper et al., Reference Harper, Lambert, Larson and Gwathmey2012; Heady and Dillon, Reference Heady and Dillon1961; Hurley, Oishi, and Malzer, Reference Hurley, Oishi and Malzer2005; Roberts, English, and Larson, Reference Roberts, English and Larson2006; Xu et al., Reference Xu, Guan, Jayne and Black2009). This functional form is assumed to be linear in parameters with no plateau growth and often overestimates maximum yield and optimal fertilizer recommendation (Ackello-Ogutu, Paris, and Williams, Reference Ackello-Ogutu, Paris and Williams1985; Lanzer and Paris, Reference Lanzer and Paris1981). The linear response plateau (LRP) model, proposed by Cate and Nelson (Reference Cate and Nelson1971), has become popular in recent years. This functional form is based on the agronomic principle of “law of minimum” formulated by Von Liebig (Reference Von Liebig1855), per which crop growth is governed by the most limiting (“minimum”) factor until another factor becomes limiting. The constant yield with an additional input represents the yield potential of the crop, also referred to as the plateau yield. The point where the plateau begins corresponds to the optimal input. Contrary to polynomial response forms, the LRP model does not allow for nutrient substitution and implies a sharp transition to a plateau maximum.
Past studies have argued that LRP models explained crop response to fertilizers at least as well as polynomial forms, if not better (Ackello-Ogutu, Paris, and Williams, Reference Ackello-Ogutu, Paris and Williams1985; Anderson and Nelson, Reference Anderson and Nelson1975; Babcock and Blackmer, Reference Babcock and Blackmer1994; Grimm, Paris, and Williams, Reference Grimm, Paris and Williams1987; Lanzer and Paris, Reference Lanzer and Paris1981; Paris, Reference Paris1992; Perrin, Reference Perrin1976; Waugh, Cate, and Nelson, Reference Waugh, Cate and Nelson1973). However, plateau response functions have often assumed that inputs are perfectly controllable, and plateau is deterministic (Cox, Reference Cox1996; Llewelyn and Featherstone, Reference Llewelyn and Featherstone1997; Paris and Knapp, Reference Paris and Knapp1989). In reality, agricultural inputs are not fully controlled and are often hard to quantify (Sher and Amir, Reference Sher and Amir1994), and crop response to inputs can vary with years and field locations (Cerrato and Blackmer, Reference Cerrato and Blackmer1990). Further, the nonrandom plateau function does not consider potential interaction between the primary input (nitrogen) and environmental factors when modeling crop yield response (Boyer et al., Reference Boyer, Larson, Roberts, McClure, Tyler and Smith2015). With the increasing criticism of the deterministic plateau, focus shifted to stochastic plateau functional forms. Makowski and Wallach (Reference Makowski and Wallach2002) considered the stochastic plateau, and Berck and Helfand (Reference Berck and Helfand1990) examined randomness in plateau. Raun et al. (Reference Raun, Solie, Johnson, Stone, Mullen, Freeman, Thomason and Lukina2002) considered randomness of inputs, plateau, and intercept but did not consider random effects. Paris (Reference Paris1992) found a switching regression model supported the Von Liebig hypothesis.
Recently, Tembo et al. (Reference Tembo, Brorsen, Epplin and Tostão2008) modified the LRP by including uncorrelated random effects that shifted both the intercept and plateau, which allowed them to be stochastic, and developed the linear response stochastic plateau (LRSP) functional form. The LRSP functional form includes two independent random effects: year random effects and plateau year random effects. The year random effect acts as an intercept, and the plateau year random effect allows year-to-year variation of expected yield potential. The study also developed a direct formula to estimate optimal fertilizer rates that maximize expected returns. The LRSP function has been used extensively to model crop yields to fertilizers in cotton, wheat, forage, corn, potatoes, and sorghum (Asci, Borisova, and VanSickle, Reference Asci, Borisova and VanSickle2015; Biermacher et al., Reference Biermacher, Brorsen, Epplin, Solie and Raun2009; Boyer et al., Reference Boyer, Larson, Roberts, McClure, Tyler and Zhou2013, Reference Boyer, Larson, Roberts, McClure, Tyler and Smith2015; Brorsen and Richter, Reference Brorsen and Richter2012; Harmon et al., Reference Harmon, Boyer, Lambert, Larson and Gwathmey2016; Kaitibie et al., Reference Kaitibie, Epplin, Brorsen, Horn, Krenzer and Paisley2003, Reference Kaitibie, Nganje, Brorsen and Epplin2007; Tumusiime et al., Reference Tumusiime, Brorsen, Mosali, Johnson, Locke and Biermache2011; Zhou et al., Reference Zhou, Clark, Lambert, English, Larson and Boyer2015).
Although both deterministic- and stochastic-plateau–type models have been popularly utilized with large degrees of predictability in many production situations, these models could have an additional random effect on the response portion and might result in suboptimal fertilizer decision rules for the single-year planning model because of the dynamic nature of fertilizer in soil. Crops acquire nitrogen from two sources: applied nitrogen in the current crop production year and carryover nitrogen from previous years (Lemon et al., Reference Lemon, Boman, McFarland, Bean, Provin and Hons2009). Further, carryover nitrogen at a given time depends on previous nitrogen application and prior levels of residual nitrogen. Without accounting for carryover information in a dynamic model, these plateau-type models may not optimize production efficiency and environmental sustainability in the long run. Consideration of carryover nitrogen prior to nitrogen application changes the producer’s decision framework from maximizing expected profit in a given year to maximizing the net present value (NPV) of net returns over a planning horizon. This is because application levels in a given year are based on their application rates from the previous year. Given this, many Texas High Plains cotton producers use soil test data to adjust year-to-year nitrogen application regimes.
Studies have shown that accumulation of carryover fertilizers significantly affects crop yield and net revenue in succeeding years (Harmon et al., Reference Harmon, Boyer, Lambert, Larson and Gwathmey2016; Harper et al., Reference Harper, Lambert, Larson and Gwathmey2012; Jomini et al., Reference Jomini, Deuson, Lowenberg-DeBoer and Bationo1991; Raun et al., Reference Raun, Solie, Johnson, Stone, Whitney, Lees, Sembiring and Phillips1998; Segarra et al., Reference Segarra, Ethridge, Deussen and Onken1989). However, the degree of nitrogen accumulation varies with the soil environment (e.g., rainfall) and soil health (e.g., available soil microbes, cation exchange, and organic matter). It may be noted that geographic variation influences nitrogen carryover effects. In arid regions with dry soil, nitrogen uptake is often less than that seen in higher rainfall areas. This increases the likelihood that residual nitrogen will be left in the soil (Huang, Lu, and Uri, Reference Huang, Lu and Uri2001). Thus, it can be speculated that the degree of nitrogen carryover is likely greater in a low-rainfall area such as the Texas High Plains. Soil nitrogen testing provides carryover information to assist producers in improving the application of nitrogen fertilizer, including determination of whether nitrogen fertilizer is needed, and avoidance of excess nitrogen fertilizer use, which reduces fertilizer costs.
Fertilizer carryover effects were discussed previously by Heady and Dillon (Reference Heady and Dillon1961), Fuller (Reference Fuller1965), Anderson (Reference Anderson1967), Kennedy et al. (Reference Kennedy, Whan, Jackson and Dillon1973), Godden and Helyar (Reference Godden and Helyar1980), and Kennedy (Reference Kennedy1981). These studies resulted in the derivation of the optimality condition for fertilizer application with carryover effects using a dynamic optimization approach. However, most classical dynamic programming models have assumed either polynomial or deterministic plateau yield response functional forms (Harper et al., Reference Harper, Lambert, Larson and Gwathmey2012).
Economic literature on simultaneous use of plateau yield function and dynamic optimization of fertilizers using carryover information is limited. Recent work by Harmon et al. (Reference Harmon, Boyer, Lambert, Larson and Gwathmey2016, Reference Harmon, Boyer, Lambert and Larson2017) determined the value of soil test information for potassium in upland cotton production utilizing plateau functions; however, studies using the stochastic plateau model, while considering carryover effects, in nitrogen management decisions are scarce. Thus, this article utilizes stochastic and plateau functions to consider changes in nitrogen fertilizer recommendation levels, when considering carryover, with respect to nitrogen-to-cotton price ratios. Using a stochastic plateau crop yield function in a dynamic programming approach could improve nitrogen fertilizer recommendation levels and offer more efficient cotton production.
In this study, we combine stochastic and nonstochastic plateau functions in a deterministic dynamic optimization model, which considers an intertemporal nitrate nitrogen residual function. We examine optimal nitrogen rates, which maximize expected yield, expected profits, and NPV of returns using stochastic and deterministic plateau functions considering carryover nitrogen. This allows us to examine the value of using a stochastic plateau function over its deterministic counterpart, while incorporating nitrogen carryover information under different input-output price scenarios. Specifically, this research uses Tembo et al.’s (Reference Tembo, Brorsen, Epplin and Tostão2008) stochastic plateau yield function with Kennedy’s (Reference Kennedy1986, Reference Kennedy1988) dynamic programming model to make methodological contributions in the estimation of optimal input decision rules in production economics.
2. Experimental design and data
A long-term field experiment was conducted on a 5-acre, subsurface drip-irrigated field at the Texas A&M AgriLife Research farm near Plainview, Texas (34.147 N, −101.947 W). Five nitrogen application rates (0, 50, 100, 150, and 200 lb./acre) were applied to the same experimental units consistently for 14 consecutive years from 2002 to 2015. The experiment consisted of a randomized block design with five treatments and five replications. Residual soil nitrogen was monitored annually before applying nitrogen treatment, by taking two 24-inch core samples from each plot. Samples were sent to Ward Laboratories in Kearney, Nebraska, for analysis. Regionally well-adapted commercial cotton cultivars were used over the duration of this study, including PM2379RR (2002, 2003, 2004, and 2005), FM960B2R (2006, 2007, 2008, 2009, and 2010), DP104B2RF (2011), FM9063B2RF (2012, 2013, and 2014), and FM9180B2F (2015). Change in cultivars over the study duration was necessitated because of new cultivar development and discontinuation of older cultivars. Average lint yield from each plot was calculated in pounds per acre for each year.
Analysis of variance (ANOVA) for yield and net returns by applied nitrogen with pairwise comparison based on the least significant difference is shown in Table 1. These results indicate that zero-applied nitrogen (i.e., plots that received no nitrogen augmentation) produced the lowest yield, and yield increased linearly with nitrogen augmentation until the highest yield occurred with 150 lb./acre of applied nitrogen. The yield achieved with a nitrogen application rate of 150 lb./acre was significantly higher than that with zero and 50 lb./acre of applied nitrogen but was not significantly different from 100 and 200 lb./acre of applied nitrogen. The results imply that optimum applied nitrogen lies somewhere between 50 and 150 lb./acre of applied nitrogen. The weakness of ANOVA is that only discrete choices are considered, so the single optimum point within the given ranges cannot be identified.
Table 1. Least square means of cotton lint yield and net return above nitrogen cost, 2002–2015

a The selected prices are $0.50/lb. and $0.65/lb. for nitrogen and cotton, respectively.
b Gross Revenue = Yield × $0.65/lb.
c Net Returns = Gross Revenue – (Applied Nitrogen × $0.50/lb.).
Note: Values in the same column and with the same uppercase letters are not significantly different, and figures in parentheses indicate standard deviation.
Prices of nitrogen and lint cotton (in dollars per pound) used in this study were acquired from Texas A&M AgriLife Extension Service budgets prepared for the South Plains District of Texas (Smith, Reference Smith2016). Five sets of lint and nitrogen prices were used to estimate the different levels of return streams via NPV analysis. Ten-year average prices were taken as a reference, $0.65/lb. and $0.50/lb. for lint and nitrogen, respectively, and four additional price sets corresponding to 20% and 40% below and above the average prices. Thus, the five price scenarios for lint and nitrogen prices per pound, respectively, were $0.39 and $0.30, $0.52 and $0.40, $0.65 and $0.50, $0.78 and $0.60 and $0.91 and $0.70. A 10-year planning horizon and a 35-lb./acre initial condition of residual nitrate nitrogen were also considered. Further, a 5% discount rate was applied to represent the opportunity cost of land in cotton production, as per previous studies (Harper et al., Reference Harper, Lambert, Larson and Gwathmey2012).
Normal data are an underlying assumption for maximum likelihood estimation, so assessment for normality of residuals is a prerequisite. Tests for normality of residuals were applied using both graphic and numeric methods. Results showed that both the Kolmogorov-Smirnov test and the Cramer–von Mises test were not significant (P = 0.18, P = 0.16); thus, there is evidence that the residuals follow the normal distribution. A simple linear model was run over the study period and showed a yield trend slope of −7.24 with a standard error of 6.06. That is, the Student t-test results did not show a significant time trend, so time trend was not considered when modeling cotton yield response. Other studies have found considerable genetic improvement in cotton using GMO (genetically modified organism) varieties (Ouedraogo, Brorsen, and Arnall, Reference Ouedraogo, Brorsen and Arnall2016); however, we find no similar trend over time, likely because of the use of non-GMO varieties in this study.
3. Conceptual and empirical models
In the present study, nitrogen is considered a limiting factor so that augmentation of nitrogen leads to a linear increment in cotton yield. Under the concept of zero elasticity of substitution for all levels of nitrogen, the Von Liebig hypothesis of “law of minimum” infers the notion of plateau (Anderson and Nelson, Reference Anderson and Nelson1975; Lanzer and Paris, Reference Lanzer and Paris1981; Paris, Reference Paris1992; Perrin, Reference Perrin1976). The notion of plateau implies that a cotton crop responds to a supply of nitrogen at a constant slope until maximum potential yield (plateau) is reached. Once the plateau is reached, nitrogen will no longer be a limiting factor, and an additional unit of nitrogen suggests wastage of the input and economic burden to producers. The relationship between nitrogen application and the attainment of plateau is illustrated in Tembo et al. (Reference Tembo, Brorsen, Epplin and Tostão2008).
3.1. Linear response plateau function
Using LRP functional form, the lint yield response to nitrogen can be expressed as follows:
 $${y_{it}} = min\left( {{\beta _0} + {\beta _1}N{T_{it}},\,\mu } \right) + {\tau _t} + {\epsilon _{it}},$$
(1)
$${y_{it}} = min\left( {{\beta _0} + {\beta _1}N{T_{it}},\,\mu } \right) + {\tau _t} + {\epsilon _{it}},$$
(1)
where yit
is lint yield (pounds per acre) from plot i in period t, β
0 is response at the origin, β1 is the linear slope parameter for nitrogen, NTit
is total nitrogen from plot i in period t, μ is the plateau, ${{\rm{\tau }}_t}\sim N\left( {0,\,\sigma _\tau ^2} \right)$
is an intercept year random effect, and
${{\rm{\tau }}_t}\sim N\left( {0,\,\sigma _\tau ^2} \right)$
is an intercept year random effect, and ${\epsilon _{it}}\sim N\left( {0,\,\sigma _\epsilon ^2} \right)$
is a random disturbance term. Both error terms are assumed to be i.i.d. (independent and identically distributed), and total variance
${\epsilon _{it}}\sim N\left( {0,\,\sigma _\epsilon ^2} \right)$
is a random disturbance term. Both error terms are assumed to be i.i.d. (independent and identically distributed), and total variance $\left( \sigma _T^2 \right) = \sigma _\epsilon ^2 + \sigma _\tau ^2$
.
$\left( \sigma _T^2 \right) = \sigma _\epsilon ^2 + \sigma _\tau ^2$
.
The function is continuous, but derivatives do not exist with respect to NT at the knot point where the linear response and plateau are joined (Park et al., Reference Park, Stoecker, Hattey and Turner2007). The optimal level of nitrogen ( $NT_{it}^*$
) can be determined based on equation (1). A nonstochastic LRP function will show constant positive marginal value product (MVP) when β0 + β1
NTit
< μ, and nitrogen should be applied until MVP (Ptβ
1, where Pt
is the price of lint [dollars per pound] in year t) equals marginal fixed cost minus the value of fertilizer savings in the current year, because of carryover effects of the previous year’s fertilizer application (k). Thus, the optimal nitrogen level for LRP would be either zero or the nitrogen level to reach the plateau (Boyer et al., Reference Boyer, Larson, Roberts, McClure, Tyler and Zhou2013; Park et al., Reference Park, Stoecker, Hattey and Turner2007; Tembo et al., Reference Tembo, Brorsen, Epplin and Tostão2008):
$NT_{it}^*$
) can be determined based on equation (1). A nonstochastic LRP function will show constant positive marginal value product (MVP) when β0 + β1
NTit
< μ, and nitrogen should be applied until MVP (Ptβ
1, where Pt
is the price of lint [dollars per pound] in year t) equals marginal fixed cost minus the value of fertilizer savings in the current year, because of carryover effects of the previous year’s fertilizer application (k). Thus, the optimal nitrogen level for LRP would be either zero or the nitrogen level to reach the plateau (Boyer et al., Reference Boyer, Larson, Roberts, McClure, Tyler and Zhou2013; Park et al., Reference Park, Stoecker, Hattey and Turner2007; Tembo et al., Reference Tembo, Brorsen, Epplin and Tostão2008):
 $$N = \left\{ {\matrix{{NT*}&{\,\,if\,{p_t}{\beta _1} \gt k} \cr 0 & {otherwise} } ,} \right.$$
(2)
$$N = \left\{ {\matrix{{NT*}&{\,\,if\,{p_t}{\beta _1} \gt k} \cr 0 & {otherwise} } ,} \right.$$
(2)
 $$NT* = {{\mu - {\beta _0}} \over {{\beta _1}}}.$$
3.2. Linear response stochastic plateau function
Following Tembo et al. (Reference Tembo, Brorsen, Epplin and Tostão2008), the LRSP to model lint yield response to nitrogen is
 $${y_{it}} = min({\beta _0} + {\beta _1}N{T_{it}},\mu + {u_t}) + {\tau _t} + {\epsilon _{it}},$$
(3)
$${y_{it}} = min({\beta _0} + {\beta _1}N{T_{it}},\mu + {u_t}) + {\tau _t} + {\epsilon _{it}},$$
(3)
where ${u_t}\sim N(0,\sigma _u^2)$
is a plateau year random effect that enters nonlinearly, and other terms are as defined previously. Total nitrogen (NTit
) is used to model the yield function based on model selection criteria such as Akaike information criterion, Bayesian information criterion, and likelihood ratio test, rather than including both applied nitrogen (NAit
) and carryover nitrogen (NRit
). Three residual terms are assumed to be i.i.d., and total variance
${u_t}\sim N(0,\sigma _u^2)$
is a plateau year random effect that enters nonlinearly, and other terms are as defined previously. Total nitrogen (NTit
) is used to model the yield function based on model selection criteria such as Akaike information criterion, Bayesian information criterion, and likelihood ratio test, rather than including both applied nitrogen (NAit
) and carryover nitrogen (NRit
). Three residual terms are assumed to be i.i.d., and total variance $\left( \sigma _T^2 \right) = \sigma _u^2 + \sigma _\tau ^2 + \sigma _e^2$
.
$\left( \sigma _T^2 \right) = \sigma _u^2 + \sigma _\tau ^2 + \sigma _e^2$
.
Based on the censored normal distribution theorem developed for Tobit models and applying chain rules, one can derive the optimal total nitrogen level as developed by Tembo et al. (Reference Tembo, Brorsen, Epplin and Tostão2008, p. 427):
 $$NT_{it}^* = {1 \over {{\beta _1}}}({\phi ^{ - 1}}\sigma _u^2 - {\beta _0} + \mu ),$$
(4)
$$NT_{it}^* = {1 \over {{\beta _1}}}({\phi ^{ - 1}}\sigma _u^2 - {\beta _0} + \mu ),$$
(4)
where ${\Phi ^{ - 1}} = {\Phi ^{ - 1}}( {1 - {k \over {{p_t}{\beta _1}}}} )$
is the inverse of the standard normal cumulative distribution function assuming (
${\Phi ^{ - 1}} = {\Phi ^{ - 1}}( {1 - {k \over {{p_t}{\beta _1}}}} )$
is the inverse of the standard normal cumulative distribution function assuming ( ${\beta _1} \ge {k \over {{p_t}}}$
); otherwise zero nitrogen would be optimal. Alternatively, it can be expressed as follows:
${\beta _1} \ge {k \over {{p_t}}}$
); otherwise zero nitrogen would be optimal. Alternatively, it can be expressed as follows:
 $$NT_{it}^{\rm{*}} = {1 \over {{\beta _1}}}\left( {\mu + {Z_\alpha }{\sigma _u} - {\beta _0}} \right),$$
(5)
$$NT_{it}^{\rm{*}} = {1 \over {{\beta _1}}}\left( {\mu + {Z_\alpha }{\sigma _u} - {\beta _0}} \right),$$
(5)
where ${Z_\alpha } = [ {{{{\beta _0} + {\beta _1}\left( {N{T_{it}}} \right) - \mu } \over {{\sigma _u}}}} ]$
is the standard normal variate with
${Z_\alpha } = [ {{{{\beta _0} + {\beta _1}\left( {N{T_{it}}} \right) - \mu } \over {{\sigma _u}}}} ]$
is the standard normal variate with $\alpha = 1 - \emptyset = {k \over {{ p_t }{\beta _1}}}$
, and the expected profit-maximizing yield is calculated by Tembo et al. (Reference Tembo, Brorsen, Epplin and Tostão2008) as
$\alpha = 1 - \emptyset = {k \over {{ p_t }{\beta _1}}}$
, and the expected profit-maximizing yield is calculated by Tembo et al. (Reference Tembo, Brorsen, Epplin and Tostão2008) as
 $$E\left( {{y_{it}}} \right) = \left( {1 - \Phi } \right)a + \Phi \left( {\mu \!\!- {{{\sigma _u}\phi } \over \Phi }} \right),$$
(6)
$$E\left( {{y_{it}}} \right) = \left( {1 - \Phi } \right)a + \Phi \left( {\mu \!\!- {{{\sigma _u}\phi } \over \Phi }} \right),$$
(6)
where $a = {\beta _0} + {\beta _1}N{T_{it}},\Phi = \Phi [ {{{a - \mu } \over {{\sigma _u}}}} ] = prob\left( {\mu \le a} \right)$
is the cumulative normal distribution function and
$a = {\beta _0} + {\beta _1}N{T_{it}},\Phi = \Phi [ {{{a - \mu } \over {{\sigma _u}}}} ] = prob\left( {\mu \le a} \right)$
is the cumulative normal distribution function and $\phi = \phi [ {{{a - \mu } \over {{\sigma _u}}}} ]$
is the standard normal density function. Maximum likelihood parameter estimates for equations (1) and (3) were obtained using the NLMIXED procedure in SAS 9.4 (Brorsen and Ouedraogo, Reference Brorsen and Ouedraogo2015; SAS Institute Inc., 2016).
$\phi = \phi [ {{{a - \mu } \over {{\sigma _u}}}} ]$
is the standard normal density function. Maximum likelihood parameter estimates for equations (1) and (3) were obtained using the NLMIXED procedure in SAS 9.4 (Brorsen and Ouedraogo, Reference Brorsen and Ouedraogo2015; SAS Institute Inc., 2016).
In the case of symmetric distribution, which occurs when k/(pβ 1) equals 0.5, the optimum level of nitrogen for the nonstochastic plateau model would be equal to that for the stochastic plateau model (Tembo et al., Reference Tembo, Brorsen, Epplin and Tostão2008). When the distribution is symmetric and k/(pβ 1) < 0.5, the optimal level of nitrogen under the stochastic plateau model is higher than with a nonstochastic model if all other parameters are the same.
3.3. Carryover function
The linear carryover function is a commonly used functional form (Harper et al., Reference Harper, Lambert, Larson and Gwathmey2012; Park et al., Reference Park, Stoecker, Hattey and Turner2007), where carryover nitrogen in the next production year is linearly proportional to the total available nitrogen in the soil in the current year. The nitrogen carryover function used here is a linear function of total available nitrogen adapted from Kennedy (Reference Kennedy1986) and used by Segarra et al. (Reference Segarra, Ethridge, Deussen and Onken1989) for nitrogen in cotton production. Further, we assume that applied and residual nitrogen levels have different effects on the amount of nitrogen being carried over to the next period because of soil nitrate-nitrogen dynamics. The linear carryover function is given by
 $$N{R_{it + 1}} = {\alpha _o} + {\alpha _1}N{A_{it}} + {\alpha _2}N{R_{it}} + {{\rm{\tau }}_t} + {\varepsilon _{it + 1}},$$
(7)
$$N{R_{it + 1}} = {\alpha _o} + {\alpha _1}N{A_{it}} + {\alpha _2}N{R_{it}} + {{\rm{\tau }}_t} + {\varepsilon _{it + 1}},$$
(7)
where α1 and α2 are parameters; NAit
and NRit
are the amounts of applied and carryover nitrogen from plot i in period t, respectively; ${{\rm{\tau }}_t}\sim N\left( {0,{\rm{}}\sigma _t^2} \right)$
is an intercept year random effect that captures the year-to-year variation of residual nitrogen in soil; and
${{\rm{\tau }}_t}\sim N\left( {0,{\rm{}}\sigma _t^2} \right)$
is an intercept year random effect that captures the year-to-year variation of residual nitrogen in soil; and ${\epsilon _{t + 1}}\sim N\left( {0,\,\sigma _\epsilon ^2} \right)$
is a random disturbance term. Both error terms are assumed to be i.i.d.
${\epsilon _{t + 1}}\sim N\left( {0,\,\sigma _\epsilon ^2} \right)$
is a random disturbance term. Both error terms are assumed to be i.i.d.
3.4. Dynamic programming approach
A risk neutral, profit-maximizing cotton producer can choose an amount of nitrogen fertilizer (NAt ) to be applied for each production year (t), (t + 1…T) with carryover nitrate nitrogen (NRt ), which maximizes the NPV of a stream of returns over a planning horizon (Kennedy, Reference Kennedy1986; Kennedy et al., Reference Kennedy, Whan, Jackson and Dillon1973). The optimality condition of this scenario can be expressed as follows:
 $${}_{N{A_t}}^{MAX}NPV = \mathop \sum \limits_{t = 1}^T {\delta ^t}[{P_t} \times {Y_{it}}\left( {N{T_{it}}} \right) - {C_t} \times N{A_{it}}],$$
(8)
$${}_{N{A_t}}^{MAX}NPV = \mathop \sum \limits_{t = 1}^T {\delta ^t}[{P_t} \times {Y_{it}}\left( {N{T_{it}}} \right) - {C_t} \times N{A_{it}}],$$
(8)
 $${\rm{subject}}\,{\rm{to}}\,N{T_{it}} = N{A_{it}} + N{R_{it}},$$
(9)
$${\rm{subject}}\,{\rm{to}}\,N{T_{it}} = N{A_{it}} + N{R_{it}},$$
(9)
 $$N{R_{it + 1}} = \alpha N{T_{it}},$$
(10)
$$N{R_{it + 1}} = \alpha N{T_{it}},$$
(10)
 $$N{A_{it}},N{R_{it}},N{T_{it}} \ge 0,$$
(11)
$$N{A_{it}},N{R_{it}},N{T_{it}} \ge 0,$$
(11)
with NR1 is given:
 $$N{R_{iT+ 1}} = 0,$$
(12)
$$N{R_{iT+ 1}} = 0,$$
(12)
 $$N{R_{0{\rm{}}}} = NR\left( 0 \right),$$
(13)
$$N{R_{0{\rm{}}}} = NR\left( 0 \right),$$
(13)
where NPV is the per acre present value of returns (in dollars); T is the length of the decision-maker’s planning horizon in years; NTit , Pt , and Ct are defined previously; Yit (NTit ) is the cotton yield function (pounds per acre) in year t; δ = (1 + r)−1 is the discount factor, where r is the discount rate reflecting the producer’s opportunity cost of time; and α is the carryover coefficient (0 ≤ α ≤ 1), which is a proportion of available nitrogen fertilizer in period t + 1 that is carried over from nitrogen application in period t. The decision variable is NAit , the amount of nitrogen to be applied in each crop season. The static variable is residual NRit remaining in the soil before planting next year’s cotton. Fixed costs were ignored because they do not affect the determination of the optimal amount of nitrogen to apply. Equation (8) was estimated using the general algebraic modeling system (Segarra et al., Reference Segarra, Ethridge, Deussen and Onken1989).
The optimal amount of nitrogen (NA*) to apply each year can be solved using a recursive functional equation (Bellman, Reference Bellman1957), which is given by
 $${F_t}\left\{ {N{R_{it}}} \right\} = {}_{N{A_{it}}}^{max}\{ \delta {P_t}{Y_{it}}\left( {NA_{it}^{\rm{*}} + N{R_{it}}} \right) - {C_t} \times NA_{it}^{\rm{*}} + \delta {F_{t + 1}}\left[ {\alpha \left( {NA_{it}^{\rm{*}} + N{R_{it}}} \right)} \right]\},$$
(14)
$${F_t}\left\{ {N{R_{it}}} \right\} = {}_{N{A_{it}}}^{max}\{ \delta {P_t}{Y_{it}}\left( {NA_{it}^{\rm{*}} + N{R_{it}}} \right) - {C_t} \times NA_{it}^{\rm{*}} + \delta {F_{t + 1}}\left[ {\alpha \left( {NA_{it}^{\rm{*}} + N{R_{it}}} \right)} \right]\},$$
(14)
with FT
+1{NTiT+1
} = 0, as a terminal condition, where Ft
{NRit
} is the present value of net returns (dollars per pound) from optimal nitrogen application ( $NA_{it}^*$
) in each year of the period t considering nitrogen carryover NRit
, NAit
is the amount of nitrogen applied from plot i in year t, δ = (1 + r)−1 is the discount factor, Pt
is the price of lint (dollars per pound) in year t, Ct
is the cost of nitrogen (dollars per pound) in year t, Yit
represents cotton yield (pounds per acre) from plot i in year t, α is a carryover parameter (0 ≤ α ≤ 1), and the proportion of fertilizer available in period t (NRit
+ NAit
) carried over to period t + 1.
$NA_{it}^*$
) in each year of the period t considering nitrogen carryover NRit
, NAit
is the amount of nitrogen applied from plot i in year t, δ = (1 + r)−1 is the discount factor, Pt
is the price of lint (dollars per pound) in year t, Ct
is the cost of nitrogen (dollars per pound) in year t, Yit
represents cotton yield (pounds per acre) from plot i in year t, α is a carryover parameter (0 ≤ α ≤ 1), and the proportion of fertilizer available in period t (NRit
+ NAit
) carried over to period t + 1.
The envelope theorem (Leonard and van Long, Reference Leonard and van Long1992) is applied to estimate the value of carryover fertilizers to subsequent years. Differentiating equation (14) with respect to NAit gives the first-order necessary condition for an interior maximum, which is as follows:
 $${{\partial {F_t}} \over {\partial NA_{it}}} = \delta {P_t}{{\partial {Y_{it}}} \over {\partial N{A_{it}}}} - {C_t} + \delta \alpha {{\partial {F_{t + 1}}} \over {\partial N{R_{it + 1{\rm{}}}}}} = 0.$$
(15)
$${{\partial {F_t}} \over {\partial NA_{it}}} = \delta {P_t}{{\partial {Y_{it}}} \over {\partial N{A_{it}}}} - {C_t} + \delta \alpha {{\partial {F_{t + 1}}} \over {\partial N{R_{it + 1{\rm{}}}}}} = 0.$$
(15)
Again, differentiating equation (14) with respect to NRt , the first-order condition for net return maximization (Harper et al., Reference Harper, Lambert, Larson and Gwathmey2012) is as follows:
 $${{\partial {F_t}} \over {\partial N{R_{it}}}} = {\delta _t}{P_t}{{\partial {Y_{it}}} \over {\partial N{A_{it}}}} + \delta \alpha {{\partial {F_{t + 1}}} \over {\partial N{R_{it + 1{\rm{}}}}}} = 0.$$
(16)
$${{\partial {F_t}} \over {\partial N{R_{it}}}} = {\delta _t}{P_t}{{\partial {Y_{it}}} \over {\partial N{A_{it}}}} + \delta \alpha {{\partial {F_{t + 1}}} \over {\partial N{R_{it + 1{\rm{}}}}}} = 0.$$
(16)
Because this is a linear term, the marginal responses to total, applied, and carryover nitrogen are identical (Kennedy, Reference Kennedy1986), and we see that
 $${{\partial NT_{it}} \over {\partial N{A_{it}}}} = {{\partial N{T_{it}}} \over {\partial N{R_{it}}}} = 1,{\rm{and}}$$
(17)
$${{\partial NT_{it}} \over {\partial N{A_{it}}}} = {{\partial N{T_{it}}} \over {\partial N{R_{it}}}} = 1,{\rm{and}}$$
(17)
 $${{\partial {Y_{it}}} \over {\partial N{T_{it}}}} = {{\partial {Y_{it}}} \over {\partial N{A_{it}}}} = {{\partial {Y_{it}}} \over {\partial N{R_{it}}}};{\rm{}}\left( {{\rm{by\,chain\,rule}}} \right),{\rm{we\,get}},{\rm{}}{{\partial N{R_{it + 1}}} \over {\partial NA_{it}}}{\rm{}} = {\rm{}}\alpha.$$
(18)
$${{\partial {Y_{it}}} \over {\partial N{T_{it}}}} = {{\partial {Y_{it}}} \over {\partial N{A_{it}}}} = {{\partial {Y_{it}}} \over {\partial N{R_{it}}}};{\rm{}}\left( {{\rm{by\,chain\,rule}}} \right),{\rm{we\,get}},{\rm{}}{{\partial N{R_{it + 1}}} \over {\partial NA_{it}}}{\rm{}} = {\rm{}}\alpha.$$
(18)
From equations (15), (16), and (17), this can be written as
 $${{\partial {F_t}} \over {\partial NR_{it}}} = {C_t},$$
(19)
$${{\partial {F_t}} \over {\partial NR_{it}}} = {C_t},$$
(19)
which implies that the value of an additional unit of nitrogen fertilizer being carried over from the previous year to the current year should be equal to the per unit cost of nitrogen in the current year, irrespective of the amount being carried over.
Updating ${{\partial { F_t }} \over {\partial N{R_{it}}}}$
for a single period t + 1 and from equations (16) and (18), we get
${{\partial { F_t }} \over {\partial N{R_{it}}}}$
for a single period t + 1 and from equations (16) and (18), we get
 $$\delta {P_t}{{\partial {Y_t}} \over {\partial N{T_{it}}}} = {C_t} - \delta \alpha {C_{t + 1}} = k.$$
(20)
$$\delta {P_t}{{\partial {Y_t}} \over {\partial N{T_{it}}}} = {C_t} - \delta \alpha {C_{t + 1}} = k.$$
(20)
For the sake of convenience, we assume Ct – δ t αCt +1 to be k, which states that the present MVP of fertilizer should be equal to the opportunity cost of the marginal unit of nitrogen fertilizer to achieve the optimality condition. If a cotton farmer does not consider nitrogen carryover, then NRt = 0 and the optimal condition for a single-period nitrogen application becomes
 $$\delta {P_t}{{\partial {Y_t}} \over {\partial N{T_t}}} = {C_t}.$$
(21)
$$\delta {P_t}{{\partial {Y_t}} \over {\partial N{T_t}}} = {C_t}.$$
(21)
This suggests that the single-year planning model yields suboptimal or inefficient levels of nitrogen application, and the discounted nitrogen fertilizer savings remain in the soil until the period is no longer considered. Further, Tembo et al. (Reference Tembo, Brorsen, Epplin and Tostão2008, p. 426) showed
 $${{\partial {Y_t}} \over {\partial N{T_t}}} = {\beta _1}\left( {1 - \Phi } \right),$$
(22)
$${{\partial {Y_t}} \over {\partial N{T_t}}} = {\beta _1}\left( {1 - \Phi } \right),$$
(22)
where $\Phi = \Phi [ {{{{\beta _0} + {\beta _1}N{T_t} - \mu } \over {{\sigma _u}}}}]$
is a standard normal cumulative distribution function and 0 ≤ ϕ ≤ 1.
$\Phi = \Phi [ {{{{\beta _0} + {\beta _1}N{T_t} - \mu } \over {{\sigma _u}}}}]$
is a standard normal cumulative distribution function and 0 ≤ ϕ ≤ 1.
Substituting equation (21) into equation (20) produces the optimality condition as
 $${\delta _t}{P_t}{\beta _1}\left( {1 - \Phi } \right) = k.$$
(23)
$${\delta _t}{P_t}{\beta _1}\left( {1 - \Phi } \right) = k.$$
(23)
These savings (δαC
t+1), which are the discounted savings from nitrogen fertilizer carried over to the next year, were subtracted from the price because fertilizer carryover reduces the amount of applied fertilizers needed in the following years. Equation (23) states that for the optimality condition ( $N{ A_t } = NA_t ^*$
), the profit-maximizing condition occurs when the present value of the current crop and input savings from future fertilizer equal the expected fertilizer cost in subsequent years. The general rule of dynamic optimization is that fertilizer be applied up to the level where the expected present value of returns from the current year crop and future fertilizer application savings obtained from the marginal unit of fertilizer equal the current fertilizer cost (Kennedy, Reference Kennedy1986).
$N{ A_t } = NA_t ^*$
), the profit-maximizing condition occurs when the present value of the current crop and input savings from future fertilizer equal the expected fertilizer cost in subsequent years. The general rule of dynamic optimization is that fertilizer be applied up to the level where the expected present value of returns from the current year crop and future fertilizer application savings obtained from the marginal unit of fertilizer equal the current fertilizer cost (Kennedy, Reference Kennedy1986).
3.5. Yield response function estimation
The models were constructed using the PROC NLMIXED procedure in SAS using maximum likelihood estimation methods. The NLMIXED procedure maximizes the marginal log-likelihood functions, directly using the theory of nonlinear mixed effects models (Wolfinger, Reference Wolfinger1999).
The random disturbance term and intercept year random effect enter the functions linearly, whereas the plateau year random effect enters nonlinearly, which does not have a closed form solution and can only be approximated numerically. The most common problem associated with nonlinear optimization is obtaining convergence, and the optimization algorithm may converge to a local instead of a global optimum (SAS Institute Inc., 2013). To address this, first-order approximation was used to obtain starting values, and various combinations of starting values were then used as the starting points in nonadaptive, 31-point Gaussian quadrature, which is much less likely to fail to converge or converge to a local optimum (Brorsen and Richter, Reference Brorsen and Richter2012). The Newton-Raphson optimization algorithm was used to carry out the maximization.
4. Results
4.1. Parameter estimates
Parameter estimates for cotton lint yield response to total nitrogen, using both functional forms, are reported in Table 2. All parameters and variance components were significantly different from zero at the 1% level, based on Wald t-tests. The plateau random effect was significant with the LRSP model, indicating that the plateau is stochastic.
Table 2. Cotton yield response to nitrogen with stochastic and deterministic plateau functions

a Slope of nitrogen is for total nitrogen.
b Random effects are for year.
Note: Asterisks (*, **, and ***) indicate P < 0.10, P < 0.05, and P < 0.01, respectively (two-tailed test).
Source: Data from Texas A&M AgriLife Research farm near Plainview, Texas, 2002–2015.
Goodness of fit for both stochastic and deterministic plateau functions was evaluated using the likelihood ratio test with 1 degree of freedom. The calculated likelihood ratio test statistic was 30.8 with a critical chi-square value of 6.63, providing evidence that the stochastic plateau model fit the cotton yield data relatively better than its deterministic counterpart. These results agreed with previous studies (Boyer et al. Reference Boyer, Brorsen, Raun, Arnall and Solie2012, Reference Boyer, Larson, Roberts, McClure, Tyler and Zhou2013; Harmon et al. Reference Harmon, Boyer, Lambert, Larson and Gwathmey2016; Kaitibie et al., Reference Kaitibie, Nganje, Brorsen and Epplin2007).
The expected plateaus of cotton lint yield were 1,226 lb./acre and 1,225 lb./acre for LRP and LRSP functions, respectively. The estimated marginal productivity of total nitrogen was slightly higher with the LRSP model (3.94) than with LRP (3.90), so less nitrogen was needed to reach the plateau. Tembo et al. (Reference Tembo, Brorsen, Epplin and Tostão2008) and Tumusiime et al. (Reference Tumusiime, Brorsen, Mosali, Johnson, Locke and Biermache2011) emphasized attenuation bias to explain the lower estimates of nitrogen productivity with the deterministic plateau model. The MVP of nitrogen with the LRSP model, when the price of cotton was $0.65, was $2.56/lb. Further, the threshold level of total nitrogen required to achieve a plateau knot was slightly higher for LRP (105 lb./acre) than that for LRSP (104 lb./acre).
4.2. Nitrate nitrogen carryover function
The nitrate nitrogen carryover function describes the rates at which both applied nitrogen and nitrate nitrogen, residual available in the soil from previous years, become available to the current year’s crop. The nitrogen carryover function is estimated via the linear mixed effects model using maximum likelihood estimation as shown in Table 3.
Table 3. Soil nitrogen carryover function parameter estimates

a Random effects are for year.
Note: Asterisks (*, **, and ***) indicate P < 0.10, P < 0.05, and P < 0.01, respectively (two-tailed test).
Source: Data from Texas A&M AgriLife Research farm near Plainview, Texas, 2002–2015.
Positive signs for an intercept and lag of applied and residual nitrogen were expected in the nitrogen carryover function. Both applied and residual nitrogen variables were used in carryover functions (variance inflation factor was 1.12, indicating no evidence of multicollinearity).Footnote
1
All parameters were significantly different from zero at any conventional confidence level, except for applied nitrogen, which was significant at the 5% significance level. The estimated intercept implies that nearly 16 lb./acre of nitrogen was added each year in soil, as plant-available nitrogen may become accessible through natural phenomena such as the decay and breakdown of organic matter, weathering of soil particles, nitrogen fixation by leguminous weedy plants between two cropping seasons, and so forth. Different carryover coefficients for applied and residual nitrogen were observed. The estimated carryover coefficient for applied nitrogen was 0.06, which indicated that for each 100 lb./acre of applied nitrogen, soil nitrogen (in the form of nitrate nitrogen) increased by 6 lb./acre the following year. Thus, 6% of the previous year’s total applied nitrogen carried over to the current year as residual nitrate nitrogen. Interestingly, the carryover coefficient for residual nitrogen indicated that nearly 47% of residual nitrogen was not used by the plant and carried over to the following period. This result indicates that nitrogen form, applied versus residual, affects carryover amounts differently. This finding is in line with Stoecker and Onken (Reference Stoecker and Onken1989), who showed that the effect of residual soil nitrogen on cotton yield was significantly different from that of applied nitrogen. We speculate that residual nitrate nitrogen is more stable in the soil profile, and less vulnerable to nitrogen losses, than nitrogen augmented in the soil in the current year. Because amounts of nitrate nitrogen in soil are affected by nitrogen application timing, form of nitrogen applied, rate of application, and amount of irrigation and rainfall, it is not surprising that the carryover coefficient of a more stable residual nitrogen is greater than the edaphically vulnerable applied nitrogen in our study. Using the likelihood ratio test, the null hypothesis of lack of random effects was rejected (likelihood statistics: 19.97 and $\chi _{1,\,0.05}^2 = 3.84$
).
$\chi _{1,\,0.05}^2 = 3.84$
).
4.3. Optimal nitrogen application rules
The optimal nitrogen level for deterministic plateau was either 104 lb./acre when the price of nitrogen was less than the sum of MVP ($2.53/lb.) of nitrogen and the value of fertilizer savings in the following year (because of carryover effect), or zero otherwise. Unlike the nonstochastic plateau, optimal nitrogen levels vary for the stochastic plateau given nitrogen-to-cotton price ratios and variance of plateau. Table 4 shows optimal nitrogen levels and corresponding expected maximum yield for 25 sets of cotton and nitrogen prices. The optimal level of total nitrogen ranged between 109 and 166 lb./acre when nitrogen-to-cotton price ratios ranged from 0.32 to 1.79. With the historical price scenarios, the total optimal nitrogen fertility was estimated to be 142 lb./acre. Once cotton yield response and carryover dynamics are known, a producer can determine the most profitable level of nitrogen to be applied in the current production year. For instance, a producer who considers carryover nitrogen information in nitrogen application decision rules can maintain the amount of nitrogen available for plant uptake by applying variable amounts annually.
Table 4. Profit-maximizing total nitrogen, cotton yield, and recommended applied nitrogen scenarios with stochastic plateau function

Notes: Profit-maximizing yield corresponds to total nitrogen levels. Recommended level of nitrogen application is derived from per acre dynamic optimization of applied nitrogen with stochastic plateau function that maximizes the net present value over a 10-year planning period. This was calculated as profit-maximizing total nitrogen less a steady-state level of carryover nitrogen when considering soil test information.
Table 4 further depicts the expected profit-maximizing levels of nitrogen fertilizer application considering LRSP as the suitable functional form for 25 alternative cotton-nitrogen price scenarios. Dynamic optimization provides the optimal levels of nitrogen for augmentation, which is the difference between total nitrogen required to achieve plateau and residual nitrate nitrogen available in the soil because of carryover effects of the previous year’s total nitrogen. The expected optimal nitrogen application, which maximized NPV, ranged from 71 lb./acre to 123 lb./acre depending on a given nitrogen-to-cotton price scenario. The lowest optimum nitrogen application level (i.e., 71 lb./acre) was obtained with a higher nitrogen-to-cotton price ratio (1.79) and vice versa. Under the current input-output price combinations ($0.50 and $0.65), the steady-state optimum level of applied nitrogen was 101 lb./acre. Thus, 101 lb. of nitrogen applied in the current production year produced 2.54 bales of cotton.Footnote 2 As such, the optimum nitrogen recommendation is to apply approximately 40 lb. of nitrogen for each bale of cotton production. Bronson (Reference Bronson2008) also showed that 40 lb. of total nitrogen was required to produce 1 bale of lint in West Texas, regardless of cotton variety or irrigation system. However, Hons et al. (Reference Hons, Lemon and McFarland2003) and Lemon et al. (Reference Lemon, Boman, McFarland, Bean, Provin and Hons2009) recommended 50 lb. of nitrogen per bale of cotton production from all sources. Nitrogen application decision rules should consider quantities of residual soil nitrogen, nitrogen in irrigation water, and plant-available nitrogen resulting from natural phenomena such as decay of organic matter. Contribution of nitrate nitrogen via irrigation water was unlikely at the study location; thus, differences in findings from this study and prior work are attributed to cultivar genetic performance.
Under a historical price scenario, the optimal levels of nitrogen were lower with deterministic plateau than with stochastic plateau because c/(pβ1) was always less than 0.5, a condition generally used to compare the nitrogen requirement for profit maximization between stochastic and nonstochastic models. Under historical nitrogen-to-cotton price ratio scenarios (i.e., price ratios in the range of 0.5 to 1, if β1 > 2), the LRP functional form underestimates the optimal nitrogen application levels for cotton production.
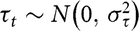
With dynamic optimization using parameter estimate yield functions, it is important to highlight that optimal nitrogen application levels vary across periods for a given nitrogen-to-cotton price ratio assuming a fixed amount of initial nitrogen residual. Figure 1 depicts optimal levels of applied nitrogen dynamics using LRP and LRSP functions over a 10-year planning period when nitrogen and cotton prices are $0.50 and $0.65/lb., respectively, and assuming a 35-lb./acre initial nitrogen residual. Considering the LRP functional form, it shows that 69 lb./acre of applied nitrogen in the first year of the planning period is optimal, with application rate decreased until the steady-state optimal level of applied nitrogen, 67 lb./acre, is achieved, which is far below the current recommendation level. In contrast, when the LRSP functional form is assumed, given 35-lb./acre initial residual nitrogen, 107 lb./acre of applied nitrogen in the first year of the planning period would be optimal, with application rate decreased until a steady-state optimal nitrogen level of 101 lb./acre is reached.
Figure 1. Steady-state optimal levels of applied nitrogen across periods with stochastic and deterministic plateau functions, assuming residual nitrogen of 35 lb./acre as a starting point.
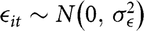
The optimization model solves for specific input-output price combinations, but discrete combinations may vary substantially, so that a generalized relationship based on relative, rather than absolute, price scenarios could be more useful. Accordingly, a generalization of optimal nitrogen application levels was derived by regressing the optimal nitrogen application against the nitrogen-to-cotton price ratios. The 25 sets of optimal applied nitrogen levels along with their corresponding nitrogen-to-cotton price ratios are listed in Table 4. Figure 2 depicts the relationship between these optimal decision rules of nitrogen application and nitrogen-to-cotton price ratio. As expected, results indicate that the higher the nitrogen-to-cotton price ratio, the lower the optimal level of nitrogen applied.
Figure 2. Relationship between applied nitrogen rates and nitrogen-to-cotton price ratios from the stochastic plateau function, assuming 35 lb./acre initial nitrogen residual.
The Texas A&M AgriLife Extension Service showed that the average nitrogen-to-cotton price ratio in the SHPT ranged from 0.5 to 1.0 between 2005 and 2015. At these historical price ratios, optimal nitrogen application levels lie in a range of 95 lb./acre to 112 lb./acre. Nevertheless, the current producer practice of nitrogen use in the SHPT is to apply 125 lb./acre regardless of prices, which is clearly much higher than any of these optimal application rates. This also suggests that if nitrogen-to-cotton price ratios remain close to the historical ratios, and if decision makers follow the nitrogen application optimal decision rules based on the LRSP model, cotton yield would be optimized and cotton production would be a more profitable enterprise. The optimal level of nitrogen application based on LRP models does not vary with nitrogen-to-cotton price ratios; rather, it remains constant until it satisfies the condition given in equation 2.
4.4. Net present values and valuation of carryover nitrogen
The empirical distributions of NPV for each of the 25 dynamic models, considering LRSP and LRP functional forms, are presented in Table 5. The benefit of using the LRSP model over the LRP model can be observed in the differences in expected NPV between these two models. Using LRSP functional form, substantially higher NPVs could be achieved. These increased NPVs ranged from $26 to $1,571/acre. Furthermore, if NPVs are evaluated at the average price combinations, the loss to producers from using LRP to predict optimal nitrogen application levels would be $614/acre, projected over a 10-year time interval. Additionally, in order to calculate the value of carryover nitrogen, we considered a discount factor of 5% and carryover coefficient of 0.21; thus, the reduction in nitrogen price was found to be 20% (carryover coefficient, 0.21, divided by discount factor, 1.05) in the following period.
Table 5. Net present value (NPV) of returns from dynamic optimization of applied nitrogen using stochastic (LRSP) and deterministic (LRP) plateau functions

Note: LRP, linear response plateau; LRSP, linear response stochastic plateau.
5. Conclusion
Currently available crop production models often combine either the dynamic programming approach with quadratic functions or stochastic plateau functions alone, without accounting for carryover nitrogen in fertilization problems. Selecting inappropriate functional forms or excluding substantial amounts of residual nitrogen from the model may result in imprecise as well as higher-on-average fertilizer recommendation. This research combines stochastic plateau functions with dynamic optimization techniques in order to develop optimal nitrogen decision rules. This article also examines the benefit of using a stochastic plateau function, in conjunction with carryover information, over a deterministic plateau. Specifically, this research combines Tembo et al.’s (Reference Tembo, Brorsen, Epplin and Tostão2008) stochastic plateau yield function with Kennedy’s (Reference Kennedy1986) dynamic programming model.
The results favor the stochastic plateau function, as it demonstrates a better fit to the data than its deterministic counterpart. Although there is a payoff to using the stochastic plateau function, the amount of payoff depends on the nitrogen-to-cotton price ratio. Unlike the deterministic plateau, profit-maximizing nitrogen level with the stochastic plateau is a function of the variance of plateau random effects and nitrogen-to-cotton price ratios. It should be noted that the LRP function may underestimate the profit-maximizing level of nitrogen under good growing conditions and may do the opposite under poor growing conditions. This result backs the finding of Tembo et al. (Reference Tembo, Brorsen, Epplin and Tostão2008) who stated that “use of a stochastic plateau provides insight into why farmers may apply more or less nitrogen than would appear optimal” (p. 432).
It is important to note that the results derived in this study may be used with caution in other geographic areas because of the regional differences in climatic conditions, soil types, and production practices. Nevertheless, the approaches used in this study are applicable for the evaluation of crop production efficiency through optimal input application decision rules in other geographic locations and/or in other crop production systems.
The findings of this study are particularly important in light of escalating nitrogen prices, as well as the serious environmental challenge of managing nitrate contamination in groundwater. Moreover, this research considered the plateau year random effect because of year-to-year variation in yield plateau inflicted by environmental and weather conditions. Further research should include field plateau random effects to capture field-to-field variation of yield plateau for multiple field locations.
The results of this study provide useful insight into the value of nitrogen carryover information when using stochastic versus deterministic plateau functions. Reduction in nitrogen usage, based on carryover information, may help cotton farmers improve their profits, all else remaining constant. Additionally, negative environmental consequences resulting from the overapplication of nitrogen may be avoided.
Acknowledgements
The authors gratefully acknowledge the comments of three anonymous reviewers, which contributed to the improvement of this paper.


 Open access