


INTRODUCTION
The European Union (EU) began implementing biofuel-related targets in 2003 (European Parliament 2003). The Biofuel Directive set indicative biofuel penetration targets of 2% by the end of 2005 and 5.75% by the end of 2010. In 2009, the EU Commission passed two major directives supporting the increased use of renewable fuels extending to 2020. The Renewable Energy Directive (RED) mandates that 20% of all energy usage in the EU, including at least 10% of all energy in road transport fuels, be produced from renewable sources by 2020. Alongside the RED, an amended Fuel Quality Directive (FQD) was passed requiring that, by 2020, the road transport fuel mix in the EU should be 6% less carbon intensive than a fossil diesel and gasoline baseline.
The increasing amount and demand of used biobased fuel components require reliable and independent measurement techniques of the biocontent ratio determinations in blends. It is not only a scientific interest, but also an economic demand (Oinonen et al. Reference Oinonen, Hakanpää-Laitinen, Hämäläinen, Kaskela and Jungner2010; Deneyer et al. Reference Deneyer, Peeters, Renders, van den Bosch, van Oeckel, Ennaert, Szarvas, Koranyi, Dusselier and Sels2018; Varga et al. Reference Varga, Major, Janovics, Kurucz, Veres, Jull, Peter and Molnár2018; Delli Santi et al. Reference Delli Santi, Bartalini, Cancio, Galli, Giusfredi, Haraldsson, Mazzotti, Pesonen and De Natale2021). Renewable components in the fuel industry, such as biofuels, are generally made by biological processing of recent organic materials. Based on classical analytical techniques, such as chromatography methods, it is difficult to distinguish the fossil (petroleum based) and biogenic (recent) component of the mixed fuel samples because the physical and chemical properties of these materials are quite similar. That is why they can be applied together in the same engine as well, but the analytical differentiation within the mixture is not trivial (Deepanraj et al. Reference Deepanraj, Dhanesh, Senthil, Kannan, Santhoshkumar and Lawrence2011; Lawrence et al. Reference Lawrence, Koshy Mathews and Deepanraj2011; Varga et al. Reference Varga, Major, Janovics, Kurucz, Veres, Jull, Peter and Molnár2018).
The carbon content of the fuel materials is generally high, so the measurement of the carbon isotopes composition, for the purpose of biocontent analysis, can be representative of the whole sample biocontent ratio as well (Dijs et al. Reference Dijs, van der Windt, Kaihola and van der Borg2006; Varga et al. Reference Varga, Major, Janovics, Kurucz, Veres, Jull, Peter and Molnár2018; Haverly et al. Reference Haverly, Fenwick, Patterson and Slade2019). Laser-based radiocarbon measurements have begun to gain ground nowadays, but the precision and accuracy are better in the case of the accelerator mass spectrometry (AMS) method, and the necessary amount of sample is also lower for AMS measurement, however the laser-based 14C determination could be a cost-effective way for the industry in the future (Genoud et al. Reference Genoud, Vainio, Phillips, Dean and Merimaa2015, Reference Genoud, Lehmuskoski, Bell, Palonen, Oinonen, Koskinen-Soivi and Reinikainen2019; Delli Santi et al. Reference Delli Santi, Bartalini, Cancio, Galli, Giusfredi, Haraldsson, Mazzotti, Pesonen and De Natale2021). The liquid scintillation counting (LSC) based method could be cheaper than the AMS, but burdened with many difficulties, such as quenching in the fuel blend samples which are not transparent liquids (Doll et al. Reference Doll, Wright, Morley and Wright2017; Krajcar Bronić et al. Reference Krajcar Bronić, Barešić, Horvatinčić and Sironić2017). Radiocarbon-based biocontent ratio measurement is also used for the determination of the biocomponent ratio in plastics and other materials that can be produced also from bio and fossil sources (Quarta et al. Reference Quarta, Calcagnile, Giffoni, Braione and D’Elia2013; Palstra and Meijer Reference Palstra and Meijer2014; Santos et al. Reference Santos, Macario, Jou, Oliveira, Cardoso, Diaz, Anjos and Alves2019; Rogers et al. Reference Rogers, Turnbull, Dahl, Phillips, Bridson, Raymond, Liu, Yuan and Hill2021).
Determination of the biological component ratio by the radiocarbon (14C) method has been standardized (ASTM D6866 2020). Using this standard method, the 14C/12C isotopic ratio can be determined by AMS (Norton et al. Reference Norton, Hood and Devlin2007; Oinonen et al. Reference Oinonen, Hakanpää-Laitinen, Hämäläinen, Kaskela and Jungner2010; Culp et al. Reference Culp, Cherkinsky and Ravi Prasad2014; Funabashi et al. Reference Funabashi, Ohara and Kunioka2014; Varga et al. Reference Varga, Major, Janovics, Kurucz, Veres, Jull, Peter and Molnár2018; Haverly et al. Reference Haverly, Fenwick, Patterson and Slade2019). Although the method is standardized, different laboratories use different preparation methods and AMS instruments made by different manufacturers for the measurement. Therefore, intercomparison activities are required for the comparison and demonstration of compliance of the different measurement protocols at AMS laboratories worldwide (Rozanski and Stichler Reference Rozanski and Stichler2006; Haverly et al. Reference Haverly, Fenwick, Patterson and Slade2019; Wacker et al. Reference Wacker, Scott, Bayliss, Brown, Bard, Bollhalder, Friedrich, Capano, Cherkinsky and Chivall2020; Quarta et al. Reference Quarta, Molnár, Hajdas, Calcagnile, Major and Jull2021).
Our aim was to involve three separate laboratories in the presented intercomparison campaign for the determination biocontent of unknown bio-, fossil, and mixed-fuel samples, in the framework of the IAEA (International Atomic Energy Agency) CRP (Coordinated Research Projects): Enhancing Nuclear Analytical Techniques to Meet the Needs of Forensic Sciences. Our AMS 14C study shows the intercomparison of the results data of two biofuel, one fossil fuel, and two blends from these materials. The samples were measured at (a) the Centre of Applied Physics, Dating and Diagnostics (CEDAD), University of Salento, Lecce, Italy, (b) ETH Zürich, Department of Earth Sciences, Ion Beam Physics laboratory, Zürich, Switzerland, and (c) Institute for Nuclear Research, International Radiocarbon AMS Competence and Training (INTERACT) Center, Debrecen, Hungary. The samples were provided by the Hungarian oil company, MOL Plc.
MATERIALS AND METHODS
Fuel Samples
Five fuel samples were processed in the three participating laboratories. A fatty acid methyl ester (FAME) (Vyas et al. Reference Vyas, Verma and Subrahmanyam2010) sample and hydrotreated vegetable oil (HVO) (Aatola et al. Reference Aatola, Larmi, Sarjovaara and Mikkonen2010; Dimitriadis et al. Reference Dimitriadis, Natsios, Dimaratos, Katsaounis, Samaras, Bezergianni and Lehto2018) were used as modern biocomponent, and “EVO” fossil fuel was used as pure fossil material for creating two different mixtures (Mixed 1 and Mixed 2) (Table 1). 10 mL from these samples was delivered to each laboratory in glass vials for AMS analysis. The laboratories had no knowledge about the 14C content of the samples, only that the samples were bio and fossil fuels or blends of the two components.
Table 1 Properties of processed fuel samples.

The mixed samples were chosen by the recent regulations and general biocomponent ratio in fuels in Europe and Hungary. In our former study, a wider range of mixed samples were tested, but this recent study focuses only on the ∼10% biocomponent ratio (Varga et al. Reference Varga, Major, Janovics, Kurucz, Veres, Jull, Peter and Molnár2018).
Sample Processing at CEDAD
About 5 mg of bio-fuel samples without any preliminary chemical processing were frozen and vacuum sealed in quartz tubes together with CuO and silver wool. The samples were then combusted at 900°C for 8 hr in a muffle oven. The released CO2 was recovered by breaking the quartz tubes under vacuum, cryogenically purified and reduced to graphite at 600°C by using hydrogen as reducing agent and iron powder as catalyst.
All the samples yielded ∼1 mg of graphite which was then pressed in the aluminum cathodes of the AMS system (3 MV TandetronTM Mod. HVEE 4130HC) for the measurement of the isotopic ratios (Calcagnile et al. Reference Calcagnile, Maruccio, Scrimieri, Delle Side, Braione, D’Elia and Quarta2019). Measured 14C/12C ratios were then corrected for mass fractionation by using the δ13C term measured online with the AMS system and for machine and chemical processing background. Uncertainty on measured isotopic ratios was calculated by considering both the scattering of the 10 repeated determinations performed on the same sample and the radioisotope counting statistics (Calcagnile et al. Reference Calcagnile, Quarta and D’Elia2005).
Sample Processing at ETH
At the ETH laboratory, 2–3 mg of fuel samples was weighed into 9 mm Vycor tubes, which were filled with CuO wires and precooked at 950°C. The tubes were sealed under vacuum and placed a muffle furnace for 2 hr to combust at 950°C. The ampoules were then cracked under vacuum and the CO2 cryogenically recovered and transferred to 6 mm diameter tubes, which allowed for dividing the CO2 to multiple tubes (sub-samples). These were then cracked, and CO2 was transferred to the AGE graphitization system using He flow. Graphite samples were pressed into the targets for analysis with LIP MICADAS (Synal et al. Reference Synal, Stocker and Suter2007). For the data evaluation the Bats AMS software was used (Wacker et al. Reference Wacker, Bonani, Friedrich, Hajdas, Kromer, Nemec, Ruff, Suter, Synal and Vockenhuber2010a).
Sample Processing at INTERACT
At the INTERACT the fuel samples were not chemically prepared before the combustion. From the fuel samples, 4–5 mg was weighed by a glass capillary into a borosilicate combustion tube already containing ∼300 mg MnO2 powder as oxidation reagent. Then the tubes were cooled by mixture of dry ice and alcohol slush (to –70°C) to avoid fuel evaporation during glass sealing performed under vacuum by flame. The sealed fuel samples were combusted off-line at 550°C, 24 hr in a muffle furnace (Janovics et al. Reference Janovics, Futó and Molnár2018; Varga et al. Reference Varga, Major, Janovics, Kurucz, Veres, Jull, Peter and Molnár2018). The ampoules containing the combusted fuel samples were then cracked under vacuum and the produced CO2 was cryogenically recovered and transferred to the graphitization ampules in a gas handling line (Janovics et al. Reference Janovics, Futó and Molnár2018). At INTERACT the sealed tube graphitization method was used to convert the purified CO2 to graphite by Zn reduction method (Rinyu et al. Reference Rinyu, Molnár, Major, Nagy, Veres, Kimak, Wacker and Synal2013). A MICADAS type accelerator mass spectrometer was used for the determination of carbon isotopic composition (Wacker et al. Reference Wacker, Christl and Synal2010b; Molnár et al. Reference Molnár, Rinyu, Veres Mi, Wacker and Synal2013). For the data evaluation the Bats AMS software was used (Wacker et al. Reference Wacker, Bonani, Friedrich, Hajdas, Kromer, Nemec, Ruff, Suter, Synal and Vockenhuber2010a).
Biocontent Calculation
The measured, raw 14C activity (pMC) data were corrected by the value of the measured value of the fossil (EVO) component. (pMCEVO)
 $${\rm{\;pM}}{{\rm{C}}_{{\rm{EVO}}}} = {\rm{pM}}{{\rm{C}}_{\rm{s}}} - {\rm{pM}}{{\rm{C}}_{\rm{f}}}$$
where pMCs is the measured 14C activity (pMC) value of the biocomponent or mixed sample and the pMCf is the measured 14C activity (pMC) value of the fossil (EVO) component.
The biobased carbon content (Cb) was calculated by the standard method (ASTM D6866 2020):
 $${{\rm{C}}_{\rm{b}}} = \left( {{{{\rm{pM}}{{\rm{C}}_{\rm{s}}}} \over {{\rm{pM}}{{\rm{C}}_{{\rm{ref}}}}}}} \right) \times 100$$
where pMCs is the measured 14C activity (pMC) value of sample, and the pMCref is the 14C activity (pMC) value of the reference, biocomponent sample. The Cb can be calculated using the pMCEVO to use the fossil component corrected 14C activity (pMC) value instead of the pMCs for the calculation of biobased carbon content (CbEVO).
The actual biobased carbon (Ca), according to the mass balance between the applied bio component and the fossil matrix, may differ from the standardized Biobased carbon content calculation. Ca was calculated by the following equation:
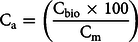 $${{\rm{C}}_{\rm{a}}} = \left( {{{{{\rm{C}}_{{\rm{bio}}}} \times 100} \over {{{\rm{C}}_{\rm{m}}}}}} \right)$$
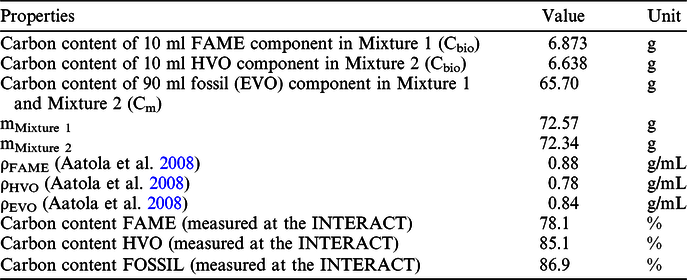
where Cbio is the carbon content (g) of the biocomponent (FAME or HVO) and Cm is the carbon content (g) of the mixed sample. The carbon content was determined at the INTERACT after the purification of the CO2 gas, measured in a known volume by pressure transducer (Janovics et al. Reference Janovics, Futó and Molnár2018). The carbon content of the bio and fossil components for the calculation of carbon content of the mixed samples were determined by using the literature data of the density of bio and fossil components (Aatola et al. Reference Aatola, Larmi, Sarjovaara and Mikkonen2010; Varga et al. Reference Varga, Major, Janovics, Kurucz, Veres, Jull, Peter and Molnár2018), measured carbon content of bio and fossil sources that was measured in the INTERACT (Janovics et al. Reference Janovics, Futó and Molnár2018; Varga et al. Reference Varga, Major, Janovics, Kurucz, Veres, Jull, Peter and Molnár2018) and mass percentage of the blends measured at the laboratory of MOL by gravimetric method with a Sartorius 1702MP8 Electronic Analytical Balance (precision ±0.1 mg). Table 2 presents the input data for Equation 3.
Table 2 Input data for Equation (3).
Simple difference from the actual biobased (Ca) content was calculated between the measured and actual biobased carbon content (Cdiff):
 $${{\rm{C}}_{{\rm{diff}}}} = {{\rm{C}}_{\rm{b}}} - {{\rm{C}}_{\rm{a}}}$$
Expected 14C activity of the mixture is obtained by combining Equations (2) and (3):
 $${\rm{pM}}{{\rm{C}}_{\rm{e}}} = \left( {{{{{\rm{C}}_{{\rm{bio}}}} \times {\rm{pM}}{{\rm{C}}_{{\rm{ref}}}}} \over {{{\rm{C}}_{\rm{m}}}}}} \right)$$
where Cbio is the carbon content (g) of the biocomponent (FAME or HVO) and pMCref is the measured 14C activity (pMC) value of the biological material in the mixture, Cm is the carbon content of the mixture.
RESULTS AND DISCUSSION
Five fuel sample were measured in each laboratory by accelerator mass spectrometry method. Then, based on the processing and AMS measurement data, biobased carbon content was calculated for the mixed fuel samples. The actual (Ca), calculated biobased content (Cb), measured and expected 14C activity (pMC) of the fuel samples are shown in the Table 3. The Table 3 also show the calculated difference of the actual biobased content and show the data calculated by EVO corrected 14C activity (pMC) values. The raw measurement data and calculations are shown in the Supplementary Material S1 file.
Table 3 Measured carbon content, expected and measured mean radiocarbon ratio (pMC), calculated actual biobased carbon content, EVO corrected biobased carbon content calculated by the AMS measurements and the difference between actual (Ca) and calculated biobased carbon content (Cb).
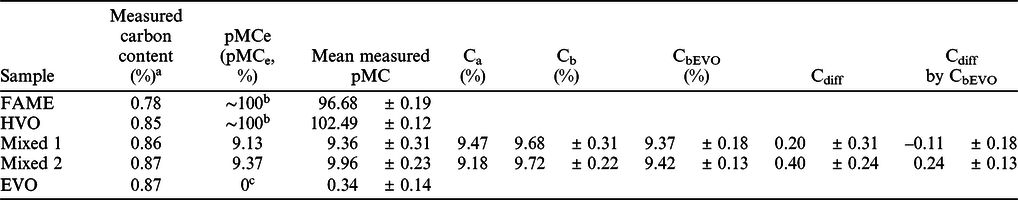
a The carbon content of the samples was measured in the INTERACT laboratory by the method described in Janovics et al. (Reference Janovics, Futó and Molnár2018) and Varga et al. (Reference Varga, Major, Janovics, Kurucz, Veres, Jull, Peter and Molnár2018).
b The expected 14C activity of biogenic component is around 100 pMC, this value was not calculated by Equation (5), but the expected value depends on the year of the production of the biological material
c The expected 14C activity of fossil component is 0 pMC, due to the long geological storage, the 14C content of the fossil materials is completely decayed away. This value was not calculated by Equation (5).
For the FAME and HVO biofuel materials the mean radiocarbon contents (pMC) measured in the three laboratories were 96.68 ± 0.19 and 102.49 ± 0.12 pMC, respectively (Table 3; Figure 1a and 1b). There is a good agreement among the individual data for each of the mentioned group (within one standard deviation). The recent organic materials 14C activity should be 100 pMC in the year of 2020 by the standard, but these materials can slightly be older, thus contain a bit more radiocarbon, inheriting from the radiocarbon bomb-peak (Hua and Barbetti Reference Hua and Barbetti2004; Turney et al. Reference Turney, Palmer, Maslin, Hogg, Fogwill, Southon, Fenwick, Helle, Wilmshurst, McGlone, Bronk Ramsey, Thomas, Lipson, Beaven, Jones, Andrews and Hua2018; Kontuľ et al. Reference Kontuľ, Svetlik, Povinec, Brabcová and Molnár2020). Our samples were produced in 2018, that is why the HVO samples have higher radiocarbon content than 100 pMC. The results of the FAME samples are a bit lower than 100 pMC, because it contains methyl group originated from fossil material (Holmgren et al. Reference Holmgren, Gosling, Marinangeli, Makrek, Faraci and Perego2007). The mean measured pMC values at the three laboratories are close to the expected 9.13 (Mixed 1) and 9.37 (Mixed 2) pMC values, respectively 9.36 ± 0.31 (Mixed 1) and 9.96 ± 0.23 (Mixed 2) pMC (Table 3; Figure 1c and 1d). The mean difference between the mean measured pMC and pMCe is 0.24 ± 0.31 (Mixed 1) and 0.59 ± 0.23 (Mixed 2) pMC. The mean difference calculated using the measurement values of the three laboratories is under 0.6 pMC for the Mixed 1 and Mixed 2 samples. Higher than 1 pMC difference was not observed.

Figure 1 Results of the AMS measurements in the three different laboratories. Plots show pMC data of (a) FAME, (b) HVO, (c) EVO, (d) Mixed 1, and (e) Mixed 2 fuel samples and blends.
The EVO corrected pMC (pMCEVO) values also show good agreement between the three laboratories and the calculated value also close to the expected pMC value of the Mixed 1 and Mixed 2 blended samples (Table 3; Figure 1c and 1d). The mean difference is not higher than 0.3 pMC at the three labs in the case of the EVO corrected pMC values. The mean difference between the mean, EVO corrected pMC and pMCe is –0.10 ± 0.18 (Mixed 1) and 0.25 ± 0.13 (Mixed 2) pMC in the EVO corrected samples compared to the expected pMC values. It shows the importance of correction by the measured value of the prepared fossil component (EVO), as the deviation from the expected pMC value is less than half after blank correction.
The mean, calculated biobased carbon contents (Cb) are 9.68 ± 0.31% (Mixed 1) and 9.72 ± 0.22% (Mixed 2) without correction, and 9.37 ± 0.18% (Mixed 1) and 9.42 ± 0.13% (Mixed 2) with correction by the fossil (EVO) component (CbEVO) (Figure 2a). The highest relative difference from the expected value (Cdiff) of Mixed 1 sample was 0.51% observed in the non-corrected measurements but the highest difference is only –0.29% after the correction by the fossil component (Cdiff by CbEVO) (Figure 2b). The highest difference from the expected value (Cdiff) of Mixed 2 sample was 0.67% observed in the non-corrected measurements, (0.36% after the correction [Cdiff by CbEVO]) (Figure 2b). These results show that all three participating laboratories could determine the biobased carbon content of the fuel samples within 1% relative uncertainty.
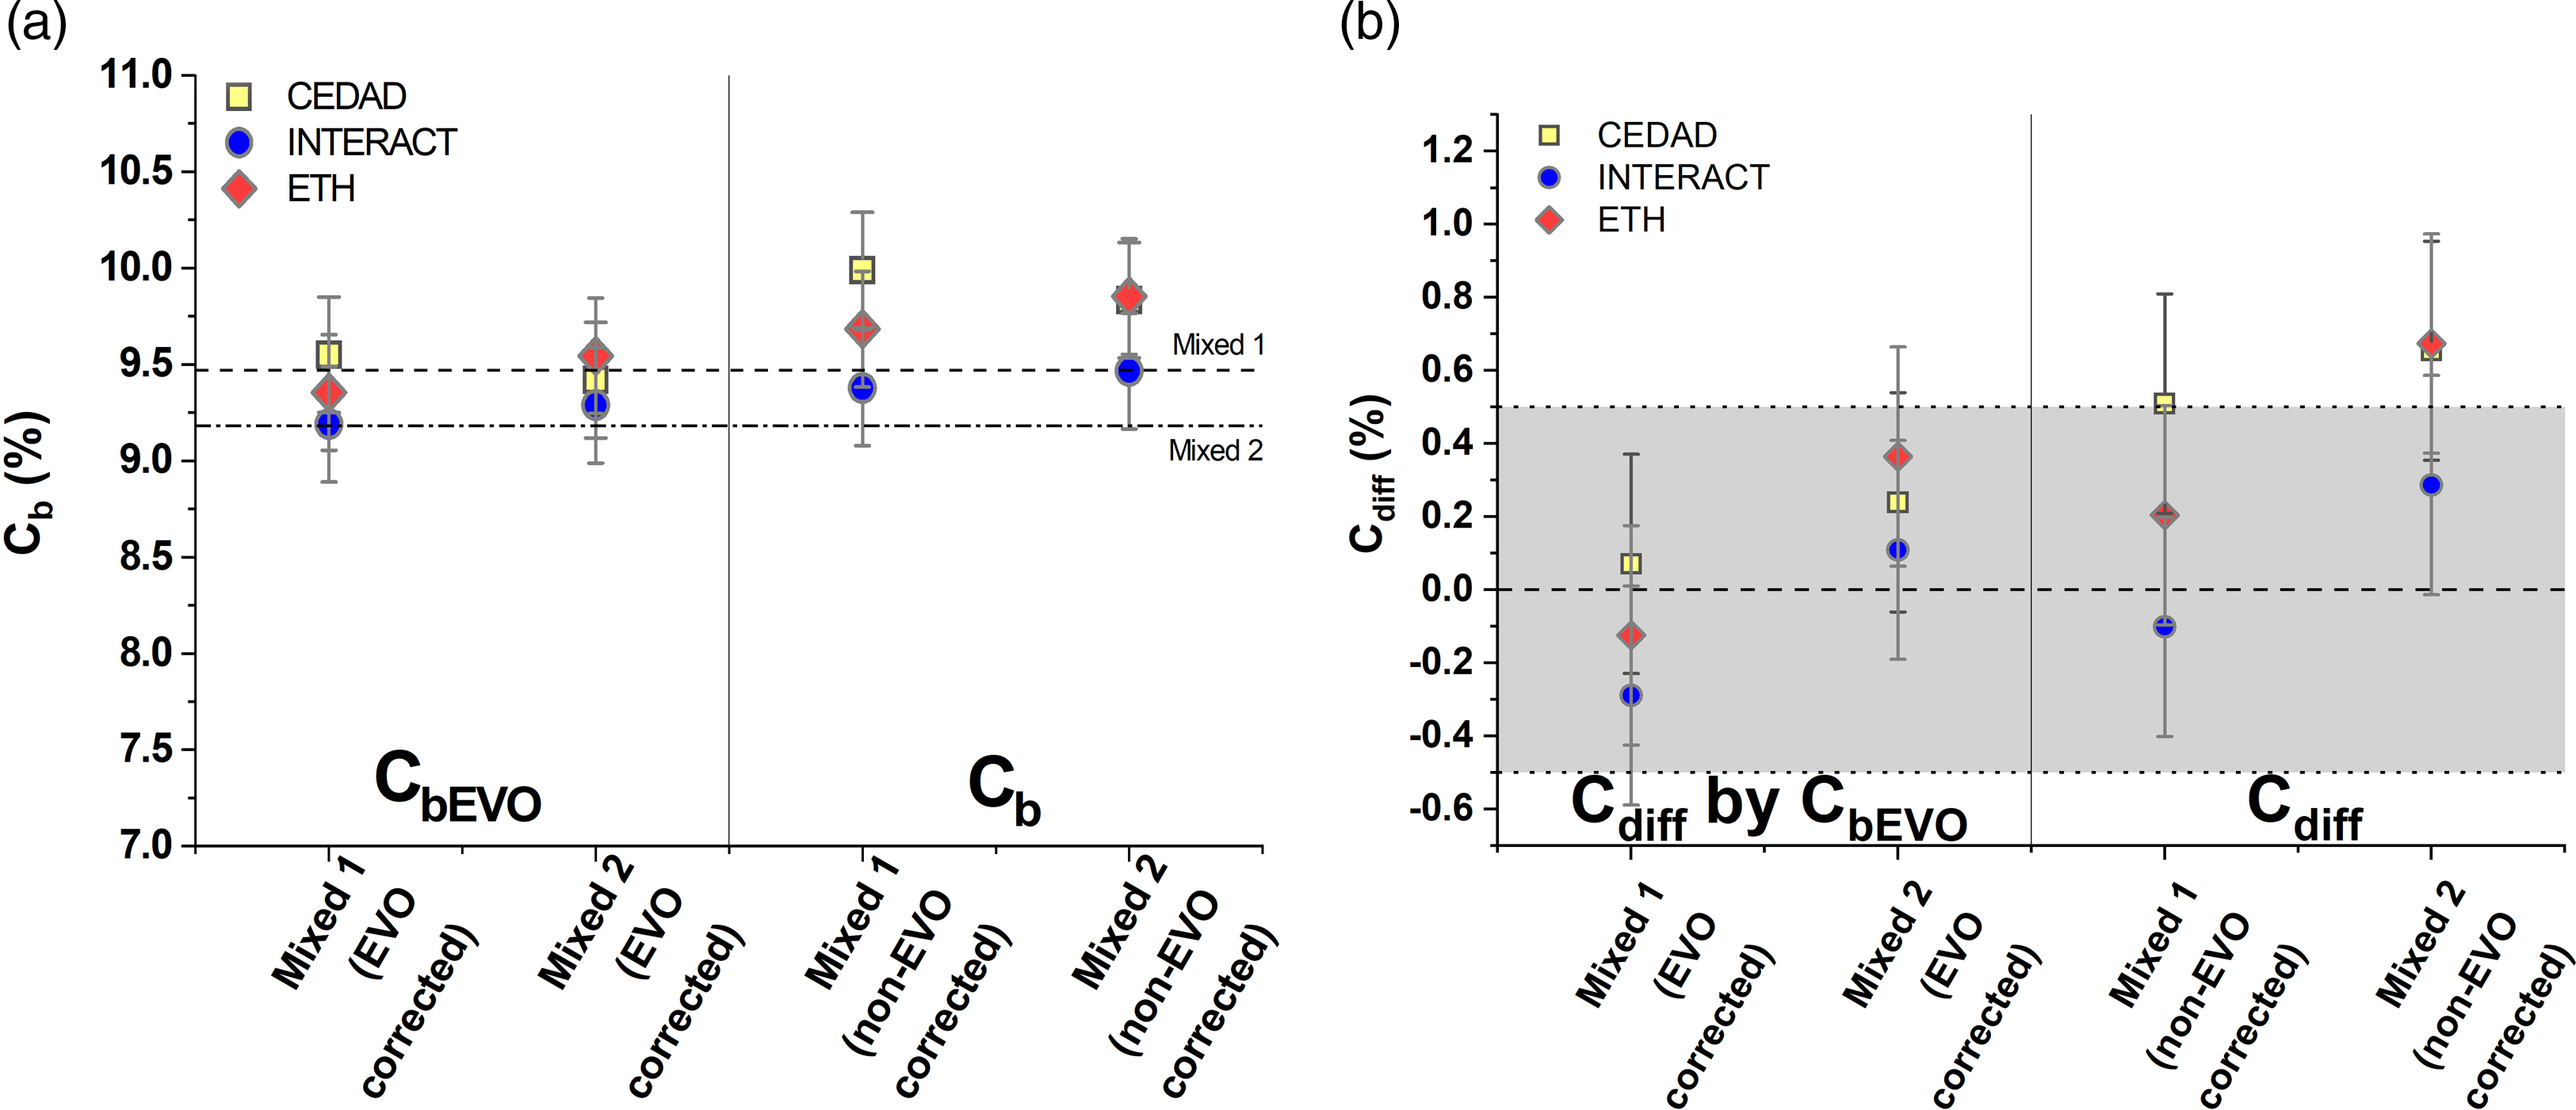
Figure 2 Plot (a) shows the calculated biogenic carbon content of the samples with (CbEVO) and without EVO correction (Cb). Plot (b) shows the difference of the determined bio carbon content of the mixed samples from the actual bio carbon content (EVO corrected (Cdiff by CbEVO) and non-EVO corrected data (Cdiff). The gray area shows the 0 ± 0.5% difference from the actual bio C content.
CONCLUSION
Three AMS 14C laboratories were involved in the intercomparison campaign for biobased carbon content measurement (ETH Zürich, CEDAD Lecce, INTERACT Debrecen). The laboratories prepared and measured the samples with different methods and machines to present the robustness, precision, and accuracy of the 14C-based biocomponent ratio measurements. The calculated 14C/12C ratio (pMC) and biobased carbon content results are in good agreement among the three laboratories and the real, actual biobased content of the distributed samples. All of the laboratories could determine the biobased carbon content within 1%, which shows that the applied methods can meet the most expectations even at the industrial field. The findings based on our intercomparison with three laboratories cannot be generalized for every AMS 14C laboratory, but the precision and accuracy of the presented results are similar to those found in the literature (Oinonen et al. Reference Oinonen, Hakanpää-Laitinen, Hämäläinen, Kaskela and Jungner2010; Krajcar Bronić et al. Reference Krajcar Bronić, Barešić, Horvatinčić and Sironić2017; Varga et al. Reference Varga, Major, Janovics, Kurucz, Veres, Jull, Peter and Molnár2018; Haverly et al. Reference Haverly, Fenwick, Patterson and Slade2019).
ACKNOWLEDGMENTS
The authors would like to thank MOL Plc. for the fuel samples. AMS analysis at the ETH were supported by the Laboratory of Ion Beam Physics. The work was performed under the auspices of IAEA (International Atomic Energy Agency) in the frame of the CRP (Coordinated Research Projects): Enhancing Nuclear Analytical Techniques to Meet the Needs of Forensic Sciences.
The research was supported by the European Union and the State of Hungary, co-financed by the European Regional Development Fund in the project of GINOP-2.3.4-15-2020-00007 “INTERACT” and prepared with the professional support of the Doctoral Student Scholarship program of the co-operative doctoral program of the Ministry of Innovation and Technology financed from the National Research, Development and Innovation found. This work was carried out in the frame of a János Bolyai Research Scholarship (to Mihály Molnár) of the Hungarian Academy of Sciences.
SUPPLEMENTARY MATERIAL
To view supplementary material for this article, please visit https://doi.org/10.1017/RDC.2023.7


 Open access