


1. Introduction and Background
Atmospheric wind is generally not steady: it oscillates and produces blasts. However, models of drifting snow depend on the basic assumption that forcing winds are steady and uniform. There has been little research to verify this hypothesis given the measurement problems and the lack of available instrumentation for drifting and blowing snow. As a result, too little is known about the possible role played by wind gusts in drifting snow. The present study aims to provide an overview of this issue and a better understanding of gust factors using the first dataset recorded at the Lac Blanc pass (2700ma.s.l.), French Alps.
Only a few studies have been conducted to address the relation between wind gusts and drifting-snow gusts. ‘Gust speed’ is a term used to describe wind speed over a short duration. The gust factor, G w(s/D), is defined as the ratio between the peak wind gust of a specific duration, s, and the mean wind speed for a period of time, D. The gust factor is often used to evaluate the maximum wind force acting on a structure in wind engineering (Reference Mitsuta and TsukamotoMitsuta and Tsukamoto, 1989), because a short-duration gust has a greater effect on structures than mean wind speed, with pressure and force fluctuations resulting in fatigue on structural components. Generally, for design purposes, a gust speed lasting 3 s is used.
It is common, when studying wind gusts, to take into account only wind speeds exceeding a certain threshold value, because the practical value of knowledge of gust factors is in most contexts only important for wind speeds above these limits (Reference Ágústsson and ÓlafssonÁgústsson and Ólafsson, 2004). In mountain areas, the mean gust factor depends on wind speed and nearby topography (and therefore wind direction) and decreases regularly with increasing wind speed and weather station altitude. High mountains close to weather stations show strong downstream wind gusts (Reference Ágústsson and ÓlafssonÁgústsson, and Ólafsson, 2004). When studying typhoons, Reference Mitsuta and TsukamotoMitsuta and Tsukamoto (1989) showed that the gust factor is independent of mean wind speed higher than 14ms–1 and proposed a formula describing the influence of averaging gust time, s, and D, the sampling duration:
where p is a constant depending on the roughness condition and height of measurement: it decreases with increasing height. Thus, the gust factor decreases with average time and with measurement height.
In the Alps (Reference Michaux, Naaim-Bouvet, Naaim, Lehning and Guyomarc’hMichaux and others, 2002), it was shown that the exceedance probability of the gust factor follows a Fisher–Tippett distribution law according to Reference DeavesDeaves (1993):
where a is a scattering parameter and G 0 is a reference gust factor. It was shown that the exceedance probability depends on the wind direction (i.e. on the surrounding topography) and on sampling duration. The study of the snowdrift gust factor has demonstrated that a snowdrift is larger when it is generated by a regular, sufficiently strong wind than when it appears with sporadic wind gusts. Moreover, in the case of sporadic wind gusts, the equilibrium between wind speed and flow is not reached, but these results (Reference Michaux, Naaim-Bouvet, Naaim, Lehning and Guyomarc’hMichaux and others, 2002) must be confirmed because it has recently been shown that the acoustic sensors used for this study are not sufficiently accurate (Reference Cierco, Naaim-Bouvet and BellotCierco and others, 2007).
There are only a few papers available in the literature on unsteady drifting flux; moreover, the data presented are partially contradictory. Reference MeunierMeunier (1999) describes this non-steady flow as a function of three variables: mean velocity, amplitude, and frequency of oscillations. For PVC, polystyrene or glass spheres, he distinguished two types of wind blasts. The first is a low-amplitude wind gust (mean velocity 7.8 ms–1; amplitude 0.6 ms–1) with a low frequency (0.2 Hz), for which the flux was late relative to the increase in wind speed and correlated well with wind speed during the decrease. Moreover, for this type of wind blast, the flux measured with unsteady wind was smaller than the corresponding flux with constant wind. The second type of wind blast corresponds to oscillations with a low frequency but a high amplitude. In this case, the flux measured with unsteady wind was stronger than the corresponding flux with constant wind.
Reference Butterfield, Clifford, French and HardistyButterfield (1993) found that in unsteady airflow, the drifting saltating sand mass flux correlated well with wind speed, for low variations in wind speed. He observed two stages in his wind tunnel experiments: mass flux responded initially within 1 s or less to moderate changes in wind velocity and corresponded to the time for saltating particles to saturate the flow. Further system regulation occurred over periods of 100 s as the boundary layer and bed adjust to the new mass flux. The primary response time was found to increase with decreasing shear velocity. Moreover, Butterfield observed that sudden velocity excursions transgressing the entrainment threshold condition may induce initial transport spikes several times the magnitude of the mean mass flux. The response to wind decelerations occurred in a more complex two-stage process: mass flux lags 2 s or more behind decelerations. Similar experiments have also been conducted with artificial snow (snow ice pellets from snow guns) at the climatic Jules Verne wind tunnel (Reference Michaux, Naaim-Bouvet, Naaim, Lehning and Guyomarc’hMichaux and others, 2002). The results were consistent with those of Reference Butterfield, Clifford, French and HardistyButterfield (1993), and the trends were essentially the same. The response time increased with decreasing wind. However, for a wind speed near the threshold, mass flux may lag up to 70 s behind wind, whereas mass flux lags up to 8 s for the higher wind speeds (approximately three times the threshold speed). This longer time to approach partial equilibrium can be attributed to the splash function (Reference McElwaine, Maeno and SugiuraMcElwaine and others, 2004) of snow particles. In fact, the primary response of the system results from grain–bed collision processes that greatly differ from sand to snow due to the bonds between snow particles, as pointed out by Reference Naaim-Bouvet and NaaimNaaim-Bouvet and Naaim (1998). The fetch necessary to reach saturation seems to be several tens of centimeters, according to wind tunnel experiments carried out by Reference Kosugi, Nishimura and MaenoKosugi and others (1992). Reference KobayashiKobayashi (1972) showed that this fetch ranged from 30 to 60 m, whereas Reference TakeuchiTakeuchi (1980) estimated from his field study that the snowdrift flux reached saturation ~350m downwind from the starting point. Contrary to Reference Butterfield, Clifford, French and HardistyButterfield (1993), however, the initial transport spike and the second system regulation were not observed in the experiments by Michaux and co-workers (Reference Michaux, Naaim-Bouvet, Naaim, Lehning and Guyomarc’hMichaux and others, 2002). However, it should be pointed out that an acoustic sensor was used, which was probably not sufficiently accurate and sensitive. Snow mass flux lagged 1 s or more behind decelerations of the free-stream velocity.
2. Description of the Experimental Site
For the present study, the observation facilities (Fig. 1) consist of an instrumented high-altitude experimental site located 2700ma.s.l. at the Lac Blanc pass near the Alpe d’Huez ski resort in the French Alps (Reference Naaim-Bouvet, Bellot and NaaimNaaim-Bouvet and others, 2010), dedicated to blowing-snow studies for the past 20 years. The area consists of a relatively flat terrain ~300m in length. The slope then becomes steeper in both the northern and southern parts. Farther away, the terrain is flat again and lakes occupy many depressions. In the eastern part of the site stands a high alpine range called Grandes Rousses culminating at ~3500 m, while a lower summit (Dôme des Petites Rousses; 2900ma.s.l.) lies to the west. The flow is canalized by the surrounding topography.

Fig. 1. Experimental set-up at the Lac Blanc pass.
In 2000, several parameters (air temperature, wind direction and speed, snow depth, water equivalent of precipitation) were recorded every 15 min. Although the sensor for standard meteorological measurements is reliable and accurate, this was still not the case for all blowing-snow sensors. Different techniques are available, but extensive and time-consuming tests are sometimes still needed before the results can be interpreted quantitatively (Reference LehningLehning and others, 2002; Reference Cierco, Naaim-Bouvet and BellotCierco and others, 2007; Reference Naaim-Bouvet, Bellot and NaaimNaaim-Bouvet and others, 2010; Reference Bellot, Trouvilliez, Naaim-Bouvet, Genthon and GalléeBellot and others, 2011).
The snow particle counter (SPC-S7, Niigata Electric) used in this study is based on an optical method (Reference Sato, Kimura, Ishimaru and MaruyamaSato and others, 1993) and determines the number and size of particles passing though a beam with a sampling area of 10 mm2. The diameter and the number of blowing snow particles are detected by their shadows on photosensitive semiconductors. The SPC detects particles 50–500 μm in size, divides them into 32 classes, and records the number of particles every 1 s. Assuming spherical snow particles, the horizontal snow mass flux, q, is calculated as follows (Reference Sugiura, Nishimura, Maeno and KimuraSugiura and others, 1998):
where qd (kgm–2 s–1) is the horizontal snow mass flux for the diameter d (m), n d is the number of drifting-snow particles, ρ p is the density of the drifting-snow particles (917 kgm–3), A is the sampling area (m2) and Δt is the sampling duration (s).
One SPC (Fig. 2) was set up in 2008 at the Lac Blanc pass. During winter 2008/09, we compared snow mass flux recorded by the SPC with those deduced from snow bags. These traps consisted of butterfly nets, i.e. a metallic frame with a nylon bag attached. The mixture of air and snow grains goes through the traps and while the snow is being collected in the bag, the air escapes through the pore. The cross section is 0.007776 m2.

Fig. 2. Snow particle counter.
It was found that for the given event, the SPC and snow bags showed good agreement (Reference Naaim-Bouvet, Bellot and NaaimNaaim-Bouvet and others, 2010, fig. 10; y = 1.05x, R 2 = 0.49, where y is the flux recorded by the SPC and x is the flux deduced from snow bags).
Thus, the data used in this study were collected from an SPC, a cup anemometer, a wind vane and a snow depth sensor set up nearby during winter 2010. Two data loggers recorded the snow flux and the wind speed every 1 s. The average direction and snow height were also recorded on another data logger every 10 min.
Heights of the SPC and cup anemometer above the snow layer vary during the winter, mainly because the height of snow increases from 0 to 2 m at the place of measurement. Regularly, both the anemometer and the SPC were manually raised. The cup anemometer is set up 28cm above the SPC.
3. Gust Factors
In this study, the definition of the wind gust factor, G w(s/D), was extended to drifting snow. G s(s/D) is the ratio between the peak snow flux gust of a specific duration, s, and the mean snow flux for a period of time, D. Wind and snow flux data from 5 January to 17 March 2010 collected at the Lac Blanc pass were used to investigate these gust factors.
3.1. Wind gust factors
The height of the anemometer was low (<1m in most cases), so we chose not to filter the data, as is usually done. The gust factor, G s(1s/10min), obtained ranged from 1 to 5.5 and was widely scattered (Fig. 3), indicating a greater mean value at low values. This can be explained by an increase in turbulence intensity of thermal origin at lower wind speeds (Reference Mitsuta and TsukamotoMitsuta and Tsukamoto, 1989). The value of the wind gust factor depends on the wind direction. Winds were separated into four classes: northerly, southerly, easterly and westerly. The probability, P, of having a gust factor greater than 2 is 7% for northerly winds and 14% for southerly and easterly winds (Fig. 4) and >60% for westerly winds. Nevertheless, there were few data available for westerly winds (only 2% of the total). The results are coherent with those previously obtained by Reference Michaux, Naaim-Bouvet, Naaim, Lehning and Guyomarc’hMichaux and others (2002) and Reference Ágústsson and ÓlafssonÁgústsson and Ólafsson (2004).

Fig. 3. 1 s peak to 10 min mean gust factor, G w(1s/10min), versus mean wind speed.

Fig. 4. Exceedance probability for northerly, easterly, southerly and westerly winds (7142 data points).
We then crossed wind data with snow flux data; the results are shown in Figure 5. The trends are the same as those observed in Figure 3. It should be pointed out that non-null snow fluxes were recorded even for mean wind speeds less than 1 ms–1, probably due to snowfall. The gust factor obtained ranged from 1 to 3.5.

Fig. 5. G w(1s/10min) versus mean wind speed for drifting-snow events.
Figure 6 shows that the exceedance probability of the gust factor follows a Fisher–Tippett distribution law according to Reference DeavesDeaves (1993) (see Equation (2)). However, no kink in the data was observed, as noted by Reference DeavesDeaves (1993) and Reference Michaux, Naaim-Bouvet, Naaim, Lehning and Guyomarc’hMichaux and others (2002). There is no significant difference between the complete set of data and the data including only drifting-snow events.

Fig. 6. The Fisher–Tippett distribution law for the exceedance probability for all the recorded events and for drifting-snow events.
3.2. Snowdrift gust factors
The study of the snowdrift gust factor gave high values ranging from 1 to 600 (Fig. 7). The same order of magnitude had already been observed by Reference Michaux, Naaim-Bouvet, Naaim, Lehning and Guyomarc’hMichaux and others (2002) using an acoustic sensor. It should be noted that such values are artificially high due to the possibly intermittent nature of drifting snow near the threshold velocity. For example, the maximum value 600 corresponds to the following particular case: for 10 min, there was only 1 s during which drifting snow occurred. To avoid such artifacts, we selected only uninterrupted drifting-snow events: if the minimum value of snowdrift flux recorded with a scan rate of 1 s during the time period (10 min) is equal to 0, then the snowdrift event is rejected. In this way, the snowdrift factors decrease and become <40 (Fig. 8).

Fig. 7. 1 s peak to 10 min mean wind gust factor, G w(1s/10min), versus 1 s peak to 10 min mean drifting-snow gust, G s(1s/10min), for all drifting-snow events.

Fig. 8. G w(1s/10min) versus G s(1s/10min) for uninterrupted drifting-snow events.
Two zones can be distinguished in Figure 8: zone A exhibits low drifting-snow gust factors for relatively high wind gust factors, and zone B exhibits high drifting-snow gust factors for relatively low wind gust factors. However, the data in Figure 8 could show discrepancies: the height of the sensors differs from one event to another, and some aeolian structures (e.g. sastrugi or small dunes) can disturb the wind field. We therefore chose to restrict the study to specific events that are short enough to be homogeneous in terms of snow height or threshold velocity and long enough to permit statistical processing.
Zone A: low snowdrift gust factors
The size distribution of snow particles at a given height is usually represented by a gamma density function (Reference BuddBudd, 1966; Reference SchmidtSchmidt, 1982; Reference Nishimura and NemotoNishimura and Nemoto, 2005; Reference Gordon and TaylorGordon and Taylor, 2009). The aim of these studies was to describe the mean size distribution over a longer time rather than within a wind gust.
where d denotes the particle diameter, α is the shape parameter determining skewness, and β is the scale parameter determining the width/scale of the distribution. αβ is equal to the mean and αβ 2 is equal to the variance. Near the surface, a value of 4–5 was reported by Reference Nishimura and NemotoNishimura and Nemoto (2005), whereas a value of 1–2 was obtained by Reference DoverDover (1993), and Reference Sato, Kimura, Ishimaru and MaruyamaSato and others (1993) found α=10 at heights of 0.03 and 0.1 m.
However, for the selected events during winter 2010, it was shown that low snowdrift gust events were systematically characterized by a snow particle size distribution (Fig. 9 and 10) that differed from the two-parameter gamma probability density function (or with an unusual α value, which corresponds in fact to narrow size distribution).

Fig. 9. Characteristic histograms of particle widths collected at the Lac Blanc pass on 4 March 2010. The solid line indicates the approximations obtained by the two-parameter probability function. (a) Mean snow flux over 10 min at 14.30 ; (b) maximal snow flux between 14.20 and 14.30. α = 86 and 83, respectively. Mean particle width 94 μm and 103 μm, respectively.

Fig. 10. Characteristic histograms of particle widths collected at the Lac Blanc pass on 4 March 2010. The solid line indicates the approximations obtained by the two-parameter probability function. (a) Mean snow flux over 10 min at 15.30; (b) maximal snow flux between 15.20 and 15.30. Mean particle width 200 μm and 206 μm, respectively.
A representative example of events that occurred on 4 March 2010 is presented in the following paragraph. To avoid interpretation errors due to variation in measurement height during experiments, only the events during which the variation of snow depth recorded by the sensor was <2 cm were selected. Mean and instantaneous characteristic histograms are shown in Figures 9 and 10.
During this 280 min drifting-snow event, the gust factor for snowdrift never exceeded a value of 2.5 (Fig. 11). Mean (over 10 min) and instantaneous (1 s sampling) characteristic histograms are quite similar: admittedly the size of the most frequent class rose, but the increase in mean diameter was <10%. The drifting-snow event occurred just after snowfall, and the measurements were made close to the surface. Relatively high snow flux (0.06 g cm–2 s–1) was recorded, which is coherent with fresh snow and therefore relatively low threshold velocity, and measurements were made near or inside the saltation layer.
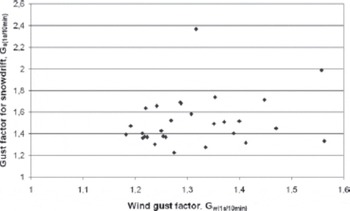
Fig. 11. G w(1s/10min) versus G s(1s/10min) at a height of 8 cm on 4 March 2010.
The SPC was very close to the surface (8 cm). It should be noted that for this configuration, the relative measurement error could be very high. In fact, it is important to remember that the SR50, the snow depth sensor, has a beam angle of ~22˚ and no objects should obstruct the intended target within this 22˚ beam, explaining why the SPC is 1 m away from the SR50 (Fig. 1). Consequently, the measured height was not exactly the height of the SPC above the snow surface, mainly due to aeolian structures (e.g. sastrugi) which appear at the Lac Blanc site (see Fig. 1). A maximal absolute measurement error of 10cm can be expected.
As mentioned above, throughout the winter, low snowdrift factors are systematically characterized by a snow particle size distribution that differed from the two-parameter gamma distribution, which has never been reported and appeared several times during the winter season, and seems to appear with fresh snow and very close to the surface. It resembles the frequency distribution resulting from abrasion, which is a key process responsible for grain-size fining due to friction and collisions that occur between the particles and the bed, reducing the size of each particle (Reference Le Bouteiller, Naaim-Bouvet, Mathys and LavéLe Bouteiller and others, in press). However, these events generally occur after a snowfall that buries the sensor. The snow particle sensor will then appear as a result of wind erosion. In this case it is possible that the self-steering wind vane (Fig. 2) is not properly adjusted any more, so the measurement is disturbed.
Zone B: high snowdrift gust factors
When high snowdrift gust factors were observed, the size distribution of the snow particles fit well with a gamma density function both for the 1 s peak and the 10 min mean drifting-snow events. Two representative examples of events that occurred on 13 and 31 January are presented in Figures 12 and 13. During the gust, the value of α remains approximately the same, but the increase in mean diameter was >20%.

Fig. 12. Characteristic histograms of particle widths collected at the Lac Blanc pass on 13 January 2010 at a height of 25 cm. The solid line indicates the approximations obtained by the two-parameter probability function. (a) Mean snow flux over 10 min at 14.30; (b) maximal snow flux between 14.20 and 14.30. α = 3.1 and 3.4 respectively; mean particle width 126 μm and 165 μm, respectively.

Fig. 13. Characteristic histograms of particle widths collected at the Lac Blanc pass on 31 January 2010 at a height of 29 cm. The solid line indicates the approximations obtained by the two-parameter probability function. (a) Mean snow flux over 10 min at 12.10; (b) maximal snow flux between 12.00 and 12.10; α = 3.9 in both cases; mean particle width 150 μm and 184 μm, respectively.
For both events, the relationship between snow flux and wind speed fit well with a power law: On 13 January 2010:
On 31 January 2010:
Q0.25 and Q 0.29 denote the mean mass transport rate, Q (kgm–2 s–1), over 10 min at heights of 0.25 and 0.29 m, respectively, and U the mean wind speed in ms–1 over 10 min at the height of the cup anemometer. The drifting-snow gust factor, G s(1 s/10 min), was greater than initially expected by the authors.
For sand, the mass flux responded initially within 1 s or less to moderate changes in wind. This response time corresponds to the time for saltating particles to saturate the flow. It was found to increase with decreasing shear velocity. This time could also greatly differ between sand and snow due to the bonds between snow particles. For example, in a cold wind tunnel, with snow from snow guns that sinters very quickly on the ground, mass flux may lag up to 70 s behind wind for wind speed near the threshold (Reference Michaux, Naaim-Bouvet, Naaim, Lehning and Guyomarc’hMichaux and others, 2002). Therefore, if the most favorable case is considered, fresh snow has a similar behavior to sand, with a mass flux response within 1 s.
Consequently, a preliminary rough approximation can be:
where a denotes the exponent of the power law that best fits the mean data, QαUa .
However, high gust factors, greater than the threshold value ( G w(1s = 10min) ) a , appeared (Fig. 14a and 15a). This occurred mainly for small snow fluxes (<0.005 g cm–2 s–1). Such spikes may result from the sensor’s poor accuracy for small fluxes, but could also be consistent with results from Reference Butterfield, Clifford, French and HardistyButterfield (1993), who observed that sudden velocity may induce transport spikes several times the magnitude of the mean mass flux near the threshold velocity.

Fig 14. Gust factor as a function of drifting-snow gust on 13 January 2010 at a height of 25 cm. (a) G w(1s/10min) versus G s(1s/10min); (b) G w(3s/10min) versus G s(3s/10min); (c) G w(8s/10min) versus G s(8s/10min).

Fig 15. Gust factor as a function of drifting-snow gust on 31 January 2010 at a height of 29 cm. (a) G w(1s/10min) versus G s(1s/10min); (b) G w(3s/10min) versus G s(3s/10min); (c) G w(8s/10min) versus G s(8s/10min).
It is known that visibility is related to the snow flux (Reference LiljequistLiljequist, 1957), and one of the main problems during snowstorms is the lack of visibility for drivers. In this context, the study of drifting-snow gusts, which can lead to an interruption of visual input for a limited amount of time, could be of great interest. Usually (Reference Van der HorstVan der Horst, 1990), TTC represents ‘the time required for two vehicles to collide if they were to continue their speed and were to remain on the same path’, and minimum TLC is defined as the time remaining before crossing the edge of the lane when a corrective action is performed. The median values of the minimum TTC tend to be 1.5–2.5 s. The minimum TLCs are generally greater and vary with speed. It was found that on straight roadways the median values of TLC ranged from ~11 s at 20 kmh–1 to ~3.5 s at 120 km h–1 (Reference Godthelp, Milgram and BlaauwGodthelp and others, 1984). We therefore tested two gust durations, 3 s and 8 s, in this range. As expected, the values of drifting-snow gust factors decreased with increasing gust duration (Fig. 14 and 15) and the previously observed spikes progressively disappeared. The snowdrift gust factor with a gust duration of 8s can be very roughly approximated by ( G w(8s = 10min) ) a . It must be noted that for the selected events the threshold velocity ranged from 2 to 4.1 ms–1, which corresponds to fresh snow. Consequently, the results obtained can be applied only for this case. It should be remembered that only events during which the variation of snow depth recorded by the sensor was <2 cm were selected so as to avoid interpretation errors. This condition is very restrictive, which is why during winter 2009/10, only events involving fresh snow were selected. It is likely that such snow leads to the highest drifting-snow gust.
4. Conclusions and Perspectives
A more advanced study than those done in the past (Reference Michaux, Naaim-Bouvet, Naaim, Lehning and Guyomarc’hMichaux and others, 2002) was conducted using the SPC and removing sporadic drifting-snow events from the analysis, identifying preliminary trends.
For a gust duration of 1 s, low drifting-snow gust factors (i.e. drifting-snow gusts smaller than or of the same order of magnitude as wind gusts) are associated with a snow particle size distribution that differs from the two-parameter gamma probability function both for the mean over 10 min and instantaneous (1 s sample) characteristic histograms. This particle size distribution appeared several times during the winter very near the surface and after snowfall. It could be a signature of an abrasion phenomenon. It might also be a measurement bias. This hypothesis must be investigated in greater depth next winter. Although not the objective of the present paper, this configuration leads to low drifting-snow gusts.
In the other cases, excluding snowfall, which has not been studied in this experiment, the size distribution of the snow particles fits well with a gamma density function both for the 1 s peak and 10 min mean drifting-snow events. In addition, for this event and a 1 s gust duration, high drifting-snow gust factors (i.e. drifting-snow gusts much higher than wind gusts) were observed. These gust factors are greater than the expected threshold value ( G w(1s = 10min) ) a , where a denotes the exponent of the power law that fits the mean data, QαUa , better. Nevertheless, it should be noted that the highest spikes are often associated with low drifting-snow fluxes near the threshold velocity. In terms of visibility for drivers, for example, it makes sense to study drifting-snow gust duration between 1 and 10 s.
The values of drifting-snow gust factors decrease with an increasing gust duration, and spikes disappear progressively. Therefore, the snowdrift gust factor with a gust duration of 8 s can be very roughly approximated by ( G w(8s = 10min) ) a .
These trends remain to be confirmed. Winter 2010 had particularly heavy snowfall, with the SPC frequently buried. The dataset allowing statistical processing is therefore limited. For example, there is no event with a high threshold velocity. Moreover, the cup anemometer is probably not sensitive enough to measure wind speed in a very short averaging time, and the classic snow depth sensor is not well adapted to measuring snow depth at the exact location of the SPC. We therefore plan to use an ultrasonic anemometer and to set up a compact laser sensor to determine the snow depth and an additional snow particle sensor to continue this study in a following winter season to provide more accurate analysis of the data.
Acknowledgements
We gratefully acknowledge the assistance of F. Ousset (Cemagref) and X. Ravanat (Cemagref) for preparing experiments and collecting data.


