Introduction
Variations in the mass of continental and sea-ice fields have implications for the rate of sea-level change, and the Earth’s radiation budget and ocean thermohaline circulation, respectively. Until recently, the fluctuation in turnover of continental ice mass was only known to an accuracy of around 20%, and fluctuations in sea-ice mass to within perhaps a factor of two. Over the past decade, data acquired by satellite radar altimeters have contributed significantly to reducing the uncertainty in the knowledge of the mass imbalance of the interior of the large ice sheets (Reference Zwally, Brenner, Major, Bindschadler and MarshZwally and others, 1990; Reference Wingham, Ridout, Scharroo, Arthern and ShumWingham and others, 1998; Reference Zwally and BrennerZwally and Brenner, 2001). However, the magnitude of fluctuations of some 30% of the continental ice mass, principally around the coastal areas of Antarctica (Reference WinghamWingham and others, 1998) and Greenland (Reference ThomasThomas and others, 2001a, Reference Thomasb), remains uncertain. In addition, the variability in the mass of the Earth’s sea-ice cover remains poorly quantified, leaving as matters of speculation the effects of climate variability and potential feedbacks through the atmosphere and ocean (Reference Laxon, Peacock and SmithLaxon and others, 2003).
This paper briefly summarizes the objectives of the European Space Agency’s (ESA’s) first dedicated cryosphere mission, CryoSat (ESA, 2003), scheduled for launch in 2005. Firstly, a description is given of CryoSat’s key features and instrument operating modes, together with recent examples from Arctic airborne simulator campaigns that are illustrative of the general characteristics of the new altimeter modes. Secondly, we introduce plans for post-launch mission calibration and validation activities. Finally, we summarize the current mission status and future development prospects.
Cryosat Background
CryoSat is the first of the Earth Explorer Opportunity satellite missions to be approved and selected as part of ESA’s Living Planet Programme (see www.esa.int/livingplanet/cryosat).CryoSat originated as a science-driven mission concept submitted to ESA in 1999, for which the proposal was written by a team of 20 scientific investigators (Reference WinghamWingham and others, 1999).
The CryoSat mission is designed to determine interannual fluctuations and trends in the mass of the Earth’s major land-and sea-ice fields, and to address the scientific issues described in the previous section. The natural variability in sea- and land-ice elevation observed by an altimeter is determined by changes in mass flux from the atmosphere and ocean, as well as changes in snow and ice density. Thus, in order to determine trends, CryoSat must repeatedly sample ice elevation over the polar regions throughout its nominal 3 year lifetime. Mean rates of change will be determined at specific areal scales (see below), at which averaging allows reduction in uncorrelated error sources.
It is recognized that a residual uncertainty
![]() will remain in elevation trends (and thus mass and thickness trend estimates) at the end of the mission, simply as a consequence of the finite period of the satellite measurements. Thus, the CryoSat system was designed from the principal requirement that the measurement uncertainty,
will remain in elevation trends (and thus mass and thickness trend estimates) at the end of the mission, simply as a consequence of the finite period of the satellite measurements. Thus, the CryoSat system was designed from the principal requirement that the measurement uncertainty,
![]() at the end of mission adds no more than 10% to the limit of uncertainty imposed by natural variability
at the end of mission adds no more than 10% to the limit of uncertainty imposed by natural variability
![]() (Table 1):
(Table 1):
Table 1 Overview of the CryoSat science and measurement requirements. The instrument or system requirements are expressed in terms of the residual uncertainty in the measurements
![]() (due to satellite performance and data processing) for each zone of interest, and for each of the associated SIRAL instrument operating modes. Values are expressed in units of cma–1 over specific averaging areas, assuming a nominal satellite operating lifetime of 3 years
(due to satellite performance and data processing) for each zone of interest, and for each of the associated SIRAL instrument operating modes. Values are expressed in units of cma–1 over specific averaging areas, assuming a nominal satellite operating lifetime of 3 years

where
Substitution of Equation 1 into Equation 1 leads to CryoSat measurement requirements of approximately ![]() in Table 1. Further details of the method for deriving the precise values in Table 1 are provided in the CryoSat mission requirements document (ESA and UCL, 1999).
in Table 1. Further details of the method for deriving the precise values in Table 1 are provided in the CryoSat mission requirements document (ESA and UCL, 1999).
To address these measurement challenges, CryoSat requires precise instruments that are designed to accurately survey the surface topography of the ice sheets and, for the first time, the surface of the sea ice. The CryoSat instrument design that was selected to address the above measurement requirement combines high-spatial-resolution radar altimeter measurements with existing pulse-limited radar technology (Reference PhalippouPhalippou, 1998; Reference RaneyRaney, 1998; Reference ZelliZelli, 1998). Microwave radar altimeters (e.g. on ERS-2, Envisat, TOPEX/Poseidon, GFO and Jason) have become an important tool, used routinely in oceanography to estimate sea-surface heights with an accuracy of 2–3 cm (Reference Fu and CazenaveFu and Cazenave, 2001). However, accurate altimeter operation over polar snow and ice surfaces which have rapidly varying elevation, such as steeply sloping terrain, requires a more specialized design than that of existing radar altimeters. CryoSat therefore has new, unique instrument attributes in comparison with previous radar altimeters: these are described in the following section.
Mission Profile
CryoSat (Fig. 1) is designed for 3 years of nominal mission operations, preceded by a several-month commissioning phase. During the commissioning phase the instrument will be calibrated and initial data product validation activities will take place. This section provides a brief mission overview: further details are available in the CryoSat Mission and Data Description document (ESA, 2001c).

Fig. 1. The CryoSat satellite viewed from beneath, with labelling of instruments.
The CryoSat satellite (Fig. 1) will be launched in 2005 from Plesetsk, Russia, on a Rockot vehicle, based on a converted SS-19 ballistic missile. The two-stage launcher (missile plus booster), and its new upper stage ‘Breeze’, will lift and manoeuvre the satellite into a non-sun-synchronous, drifting, low-earth, polar orbit. CryoSat’s orbital parameters were selected to achieve an optimum trade-off between good ground-track coverage and a high density of orbit crossover points (particularly over the low-latitude area of the Greenland ice sheet). The ‘science orbit’ will have a mean altitude close to 717 km and inclination of 92˚, resulting in a 369 day repeat cycle and 30 day pseudo-sub-cycle (ESA, 2001 a, b, c). These characteristics satisfy the requirement for synoptic coverage of Arctic sea ice on a 30 day repeat basis, while maintaining long-repeat, high-spatial-density coverage of the ice sheets. In addition, the science orbit achieves the best sampling and areal statistics for later determination of trends in the elevation data, while avoiding the aliasing artifacts that can occur with exact sub-cycles.
Satellite-borne pulse-limited radar altimeters have previously been optimized for ocean observations. A consequence of their typically low-inclination, sun-synchronous orbit is that they have been unable to acquire measurements at latitudes exceeding 81.5˚. This leaves a significant data gap in altimeter coverage in the central Arctic Ocean, including parts of North Greenland and Ellesmere Island. Over Antarctica, previous European Remote-sensing Satellite-1 and -2 (ERS-1 and -2) and Envisat radar altimeter data leave a large gap which includes some of the faster-flowing ice streams along the Siple Coast of West Antarctica, as well as some key ice streams evacuating ice into the Ronne Ice Shelf via the Transantarctic Mountains from the East Antarctic ice sheet. Thus, CryoSat will be placed in an unusually high-inclination orbit which reaches 88° latitude. This will all but eradicate the remaining gap in altimeter coverage at both poles.
The CryoSat satellite bus which will carry the instrument payload is approximately 4.5 m long, 2.3 m wide and 2.2 m high (Fig. 1). The platform has a simple rigid structure with no moving parts, and the total wet mass is approximately 720 kg (including 36 kg propellant and the instrument payload described in the following section). Electrical power will be generated by solar arrays and stored on board by a lithium-ion battery. Spacecraft attitude will be controlled using a combination of magnetorquers and cold-gas microthrusters, while precise attitude information will principally be provided by three star-tracker heads and a magnetometer (Fig. 1).
Instrument data (described in the following section) will be stored on board the satellite in a solid-state recorder scaled to handle 320 Gbits d–1 generated by the satellite payload. These data will be downlinked via a single ground station in Kiruna, northern Sweden, each time the satellite passes within visibility of the X-band antenna. Lower-volume telecommand and on-board housekeeping data are communicated between the satellite and ground using an independent S-band helix antenna (Fig. 1).
Instrument Payload
SIRAL
SIRAL (SAR/Interferometric Radar ALtimeter) is the primary payload of CryoSat. SIRAL is a high-resolution Ku-band (2.2cm wavelength) radar altimeter that has heritage from the French Poseidon instrument from TOPEX/Poseidon and Jason altimeter missions. The second-generation SIRAL instrument combines conventional pulse-limited altimeter hardware with new synthetic aperture and interferometric signal processing. These new features will allow CryoSat to generate satellite radar altimetric coverage of the steep margins of the ice sheets, and to systematically monitor changes in the freeboard (and thus thickness) of Arctic sea ice.
Conventional pulse-limited radar altimeters transmit radar pulses separated at intervals of time such that the received echoes are uncorrelated: subsequent averaging allows reduction of fading noise. At the typical satellite orbital velocity of 7 kms–1 the interval between pulses is about 500 μs. The distinguishing feature of SIRAL compared to previous altimeter instruments is that it sends bursts of pulses separated by intervals of only 50 μs. Though the return echoes are correlated, the bursts are instead treated using ‘aperture synthesis’ data-processing techniques. The SIRAL modes are briefly described below:
SAR mode
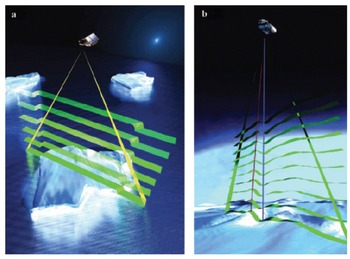
The key to CryoSat’s ability to measure the freeboard and to retrieve the thickness of sea ice (Fig. 2) is its greatly improved spatial resolution in the along-track direction (compared with ERS-2). The benefit of higher resolution is the improved distinction that can be made between high-backscatter ocean surfaces in narrow leads and the intervening low-backscatter sea-ice floe surfaces (Reference Laxon, Peacock and SmithLaxon and others, 2003), such that their elevation difference or freeboard can be measured. Resolution improvement is achieved in this mode using data-processing techniques adapted from synthetic aperture radar (SAR) (Reference RaneyRaney, 1998), and is thus named the SAR mode.

Fig. 2. Schematic illustration of key aspects of the new operating modes of the SIRAL altimeter instrument. (a) SAR mode provides 250 m along-track resolution. (b) SARIn mode exploits two antennas with a baseline separation of 1m to obtain additional across-track interferometric data.
The footprint illuminated by the altimeter pulse on the ground has parts fore and aft of the sub-satellite nadir point. Since the satellite is moving, slight frequency shifts in the returning radar energy are caused by the Doppler effect. By processing correlated bursts of 64 sequential radar pulses together, the frequency shift information is used to divide the footprint into narrow across-track strips (i.e. Doppler beams). Each strip is about 250m wide in the along-track direction, and is limited only by the span of the range window in the across-track direction. The interval between bursts is optimized such that the satellite moves forwards by 250 m each time. Figure 2 shows a schematic illustration of how strips laid down by successive bursts are superimposed upon each other and coherently averaged to reduce noise and to produce a single waveform expressing echo power as a function of time.
SARIn mode
Conventional pulse-limited altimeters measure range accurately to the closest point on the surface, but are unable to provide information on the precise origin of the echo. Over flat ocean or sea-ice surfaces, this point is known to be directly below the satellite. However, over complex terrain, found around the sloping margins of the ice sheet, there is no way to ascribe a position or elevation to a given range measurement. This problem makes it impossible to use conventional altimeter data to measure topographic changes around the ice-sheet margins, thereby excluding some of the most dynamic areas such as the ice streams in the West Antarctic ice sheet.
The SAR interferometry (SARIn) mode is intended to provide improved elevation estimates over variable topography, and is designed specifically to overcome the problem encountered with conventional altimeters. Importantly, the term SARIn was chosen so as not to confuse this ‘non-imaging’ altimeter mode with InSAR, which is a method traditionally applied to pairs of SAR images. For the SARIn mode of operation, a second antenna and SAR receiver chain is added to form an interferometer (with 1 m baseline) across the satellite track (Fig. 1). Echoes from pulses transmitted by one of the antennas are received with both antennas simultaneously. Off-nadir echoes result in a difference in path length or phase difference (i.e. fraction of a radar wavelength: 2.2 cm). This difference with respect to the 1 m antenna separation (or baseline) gives the angle between the baseline and the echo direction.
Figure 2 illustrates SARIn mode operation over a topographic surface typical of an ice sheet. The interferometric mode allows determination of the angle from which the echo originates, as represented by the difference between the nearest point (shown in red) and the nadir point (shown in blue). This in turn allows the height of any point in the return echo to be accurately determined.
Low-resolution mode
Over the relatively flat interior ice sheets, the altimeter will operate in a conventional pulse-limited mode known as low-resolution mode (LRM).
Star trackers
In addition to the altimeter, knowledge of the precise orientation of the baseline of the two receiving antennas is essential to achieve the required measurement accuracy. CryoSat measures the baseline (and thus platform) orientation using three star trackers mounted directly on the SIRAL antenna support structure (see Fig. 1).
DORIS satellite positioning
In order that the altimeter can make accurate absolute range measurements, the orbital position of the satellite must be accurately known. CryoSat has a DORIS (Doppler Orbitography and Radiopositioning Integrated by Satellite) receiver similar to that employed by Envisat (Fig. 1). This system detects and measures the Doppler shift of signals broadcast from a global network of radio beacons (ESA, 2001a, b, c). Although precise restituted orbits are delayed by approximately 1 month due to ground processing, the DORIS system importantly provides real-time estimates on board that are accurate to 0.5 m.
LRR
Supplementary, independent reference measurements of CryoSat’s position are facilitated by a laser retroreflector (LRR). This allows tracking by the existing ground network of laser tracking stations.
SIRAL Calibration and Validation
For SIRAL altimetric measurement data to be scientifically useful, they must be both calibrated and validated (commonly referred to as ‘cal/val’). In the initial CryoSat proposal, a relatively simple approach was used to derive a first guess for the vertical accuracy of averages of single-shot measurements, with assumptions made about average rates of mass change per unit area (Reference WinghamWingham and others, 1999). Recently, these values were revised on the basis of the current mission design and expressed as guiding mission requirements. The purpose of the CryoSat cal/val is therefore to verify the measurement uncertainty
![]() (in Table 1) for each of the modes.
(in Table 1) for each of the modes.
More recently, a cal/val approach has been developed in order to specify more precise requirements for SIRAL calibration and validation. A comprehensive assessment has been made of the way measurements are made, together with the methods used to derive ice thickness. A detailed discussion and consideration of the overall error budget, along with all contributing error terms and appropriate validation methods, can be found in ESA (2001a).
In order to identify and quantify CryoSat error sources, independent collocated, and contemporaneous in situ, measurements of the snow and ice surface conditions will be performed. This requires a significant amount of forward planning such that field experiments can be scheduled during the CryoSat mission: these include deployment of ice-breaking vessels in the sea ice and field personnel on the ice, together with aircraft overflights. Preparations for these activities began with a 2001 Announcement of Opportunity for proposals for activities relevant to meeting the CryoSat cal/val objectives. The Calibration and Validation Retrievals Team (CVRT) was subsequently formed from team members of the approved initiatives. A CryoSat Validation Implementation plan is currently being consolidated that includes a detailed schedule of all activities to be performed, in accordance with the overall validation strategy.
Pre-launch campaign activities
Field campaign activities are also required prior to launch to begin to identify some of the primary error sources, and to provide simulated data as an essential input to CryoSat data-processing software development activities (ESA, 2001 b). A number of precursor campaigns have already taken place, and have provided valuable airborne simulation and in situ datasets. In the May 2002 LaRA (Laser Radar Altimeter) campaign, cooperation with US scientists permitted NASA P3 airborne deployment of the Johns Hopkins University Applied Physics Laboratory (JHU-APL) delay-Doppler processing (D2P) Ku-band (13.9 GHz) radar altimeter (Reference RaneyRaney, 1998) alongside the Airborne Topographic Mapper (ATM 2/3) laser altimeter system (Reference Raney and LeuschenRaney and Leuschen, 2003). Data were collected along several tracks over Greenland (Fig. 3) and surrounding sea-ice areas (Fig. 4) on flights between Thule Air Base, Greenland and Longyearbyen, Svalbard. This unique instrument configuration allowed D2P radar altimeter and laser altimeter data to be collocated and cross-calibrated to within ±0.01m rms height difference, although the low operating flight altitude of ∼500m (for improved laser performance) limits the D2P to a beam-limited mode of operation. Typical LaRA data products include global positioning system (GPS) and inertial navigation system (INS) ancillary data together with cross-calibrated waveforms, and are produced with product definitions and processing steps consistent with those proposed in the CryoSat data-processing concept (ESA and UCL, 2001b).

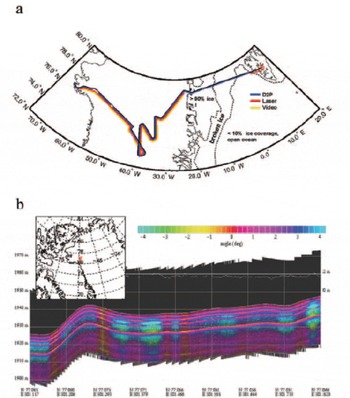
Fig. 3. (a) Map indicating LaRa campaign flight track on 18 May 2002 over the Greenland ice sheet. (b) Example of stacked D2P radar altimeter waveform data collected on this flight, simulating the CryoSat SARIn operating mode (after Reference Raney and LeuschenRaney and Leuschen, 2003).

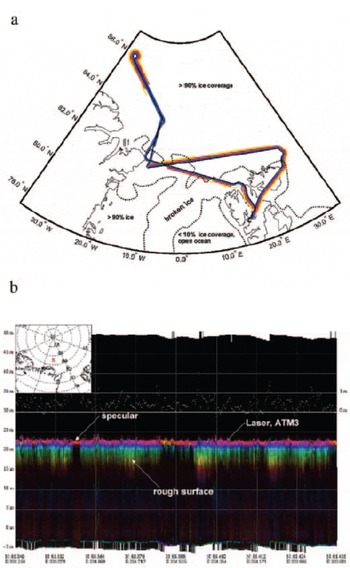
Fig. 4. (a) Map indicating LaRA campaign flight track on 23 May 2002 over Arctic perennial sea ice north of Greenland. (b) Example of D2P data collected on the flight, simulating the style of data to be acquired in the CryoSat SAR operating mode (after Reference Raney and LeuschenRaney and Leuschen, 2003).
Examples of results are indicated in the following section using higher-level (level 2) stacked waveform products, and highlight segments of along-track data. Figure 3 shows a comparison of along-track waveform power and range values measured by the ATM3 laser and D2P instruments on an 18 May 2002 flight segment over the percolation zone near Camp Century (GITS) in northwest Greenland (see named field camps on foldout 1 in Reference ThomasThomas and others (2001b)). These data effectively simulate the SIRAL SARIn mode of operation and data product characteristics. Off-nadir phase angle is identified in the echoes using the colour legend, while collocated laser range values are superimposed as the white line lying close to the first surface radar echo.
In Figure 3 it is evident that the radar waves penetrate several metres into the surface in this location. Several near-surface layers are identified by distinct peaks in waveform amplitude. Figure 5 shows a plot of the D2P radar altimeter waveform power (dB) as a function of range, corresponding to a location (77.07˚N, 58.53° W) along the flight transect shown in Figure 3. Collocated laser range is indicated by the thick vertical line. Notably, the peak return in the radar waveform is higher than the initial air/snow surface return, and corresponds to a 4 dB difference in power reflection coefficient between the buried interface and air/snow boundaries. The laser reports a range of 1937.73m and is clearly aligned with the first peak in the D2P altimeter waveform. A second larger peak (at 1935.95 m) is distinct and separated in range from the laser value and inital peak. This difference remains relatively constant at 1.8 ± 0.4m along the transect. In this location, an average annual snow accumulation of 300 kgm–2 is reported in recent compilations of historical snow-pit and shallow-firn-core data (Reference Bales, McConnell, Mosley-Thompson and CsathoBales and others, (2001). At a typical mean surface density of approximately 350 kgm–3 (Reference BensonBenson, 1962), this accumulation value corresponds to an annual layer thickness not exceeding 1 m. Thus the reflective layer is likely to have been formed approximately 2 years earlier in the summer of 2000, during anomalous surface melting at this elevation of 1940m (Reference Drinkwater and LongDrinkwater and Long, 1998; Reference Abdalati and SteffenAbdalati and Steffen, 2001).

Fig. 5. Greenland ice-sheet D2P radar altimeter waveform as a function of range from 77.07˚N, 58.53˚W on the 18 May 2003 LaRA campaign flight (see Fig. 3 for location). The collocated ATM3 footprint laser range is indicated as a bold vertical line superimposed upon the altimeter waveform. Separate altimeter waveform peaks corresponding with the air/snow and snow/ice interface responses, respectively, are indicated (after Reference Raney and LeuschenRaney and Leuschen, 2003).
Evidence shown in Figures 3 and 5 indicates that the main radar altimeter waveform peak identifies the presence of widespread subsurface reflective interfaces, while the laser reports the range to the air/snow interface. Additionally, the 4 dB power reflection difference between the surface and subsurface returns implies a dielectric contrast at this buried interface that is consistent with a firn/ice density contrast of 400–900 kgm–3 (as opposed to the smaller air/snow interface density contrast of 0–350 kgm3). This finding is consistent with previous measurements made by Reference Lytle and JezekLytle and Jezek (1994).
Occurrences of waveforms capturing distinctive systems of buried layers are currently only found in short flight segments traversing the percolation zone, and in instances where a previous summer melt surface is buried beneath a thick layer of cold, dry snow. In these circumstances, the layer depth must be sufficiently large for the surface and subsurface layer echoes to be resolved by the radar bandwidth (360 MHz). In contrasting regions where the snow-cover thickness is insufficiently deep to be resolved by the radar system, it is not possible to separate echoes from the air/snow and buried firn/ice interfaces. In these instances, the radar waveforms display only a combination of near-surface responses as a single peak. It should be noted here that space-borne ERS pulse-limited radar altimeter echoes from dry, cold Greenland firn also show no clear evidence of layers, whereas echoes from ice shelves experiencing periodic melt (where the snow/ice contrast is strong) do show some sensitivity. Thus, for layers to be traced with such clarity over long distances (as in Fig. 3) appears to require aperiodic yet spatially extensive summer surface melting, separated by uninterrupted periods of dry snow accumulation.
During the LaRA campaign, flights were also performed over Arctic sea ice to simulate the CryoSat SAR mode of operation. An example is shown in Figure 4 from the 23 May 2002 flight over the perennial ice pack north of Greenland. Waveforms indicate a larger range of surface-roughness-induced variability than was evident in the ice-sheet example. In Figure 4, intense narrow-peaked waveforms originate from specularly reflecting lead surfaces. Such waveforms punctuate more widespread and relatively broader peak waveforms following the patterns observed in previous altimetric results obtained over pack-ice surfaces (Reference Fetterer, Drinkwater, Jezek, Laxon, Onstott, Uhlander and CarseyFetterer and others, 1992). Broader waveforms originate from the rough surface topography of intervening ice floes as a consequence of off-nadir scattering (delayed in time). Over floe surfaces, it is difficult to distinguish individual reflections in the radar waveforms corresponding to reflections from the air/snow and snow/sea-ice interfaces, respectively, due to the vertical resolution limitations of the radar system. Nevertheless, a mean offset between the radar and ATM first returns of the order of a few tens of centimetres confirms that the radar waves penetrate through dry snow to the saline ice surface beneath in the manner reported by Reference Laxon, Peacock and SmithLaxon and others (2003). These preliminary results indicate that radar and laser collocated measurements contribute valuable insight into the effect of a snow cover upon the CryoSat ice-thickness retrieval accuracy.
In-flight calibration
The CryoSat satellite system has a number of ancillary measurement modes that will provide both independent internal characterization of the system errors (delays) and their changes throughout the mission lifetime. Many biases, such as the offset between the nominal and true star-tracker axis, will have been predetermined from measurements made prior to launch. However, the internal calibration modes will complement these with a series of regular measurements performed on an orbit-by-orbit basis under ground command. These will be conducted mainly over the ocean surface, when in nominal operations SIRAL would not be operating. In most cases, the calibration data will be used to make corrections to the raw data.
External calibrations will typically be performed over transponders and flat ocean surfaces. It is planned to perform such measurements during the commissioning phase and at periodic intervals thereafter. The scope of the calibration experiments and exact location of transponders is currently being planned. These locations will be confirmed in the forthcoming CryoSat calibration plan.
Summary
CryoSat construction and integration has now been completed and the satellite is presently undergoing final testing in readiness for a launch in the second half of 2005. By addressing the key deficiencies of conventional pulse-limited altimeters, the new SIRAL instrument on board CryoSat promises to revolutionize our capability to monitor changes in the polar ice masses.
Continuity in the existing 12 year historical radar altimeter time series from ERS-1 (1991–96), ERS-2 (1995V present), and Envisat RA-2 (2002–present) is of paramount importance to characterizing and understanding variability in the Earth’s ice masses. Achieving an overlap between CryoSat and RA-2 is essential to preserving this continuity, whilst at the same time facilitating cross-calibration of the respective topographic datasets. This will allow the new SIRAL altimeter to seamlessly extend the existing record and to provide additional coverage to within 2 of each pole.
Some urgency remains in the CryoSat preparations, since overlap between CryoSat, Envisat and the ongoing NASA IceSat/GLAS (Ice, Cloud and land Elevation Satellite/Geoscience Laser Altimeter System) laser mission would present an extremely valuable opportunity to verify the performance of SIRAL. In particular, airborne campaign results in this paper have indicated that collocated spaceborne laser/radar instrument data along parallel tracks can provide unique instrument cross-calibration opportunities. The potential benefit is that laser elevations could, in conjunction with the new SIRAL modes, be used to reveal the origin of biases in elevation that can arise from penetration, variable snow characteristics and topography in existing altimeter data. This would also allow the IceSat data to be accurately referenced to the decadal-change dataset compiled in the form of the historical radar altimeter time series for the Greenland and Antarctic ice sheets.
Over the latter part of 2004, Ground Segment Development and campaign activities continued, so that the flight operations and data-processing systems will be completed by mid-2005.
Acknowledgements
The generous technical support of R. K. Raney and C. Leuschen is gratefully acknowledged, as is the generous spirit of coordinated funding support by W. Abdalati of NASA’s Cryospheric programme, and the NASA IceSat programme. The D2P radar was deployed on the P3, and data acquired and pre-processed, under European Space Agency contract ESTEC 16306/02/NL/SF. This campaign would not have been possible without coordinating support from the NASA P3 flight programme and the cooperation of W. Krabill and colleagues. Media Labs are also thanked for their contribution to CryoSat illustrations.