


1. Introduction
Propulsive mechanisms for fish swimming have been studied extensively since the late 20th century (Lighthill Reference Lighthill1969; Webb Reference Webb1975; Videler Reference Videler1993; Fish & Lauder Reference Fish and Lauder2005). The theoretical analysis and comprehensive review presented in these studies have provided us with fundamental understanding of undulatory motion for slender bodies (Lighthill Reference Lighthill1969), active and passive flow control in biological marine swimmers (Webb Reference Webb1975; Colgate & Lynch Reference Colgate and Lynch2004), and exploitation of flow in different environments (Fish & Lauder Reference Fish and Lauder2005). More recently, researchers have expanded their studies on locomotion of fish to examine the underlying mechanisms that have also been observed for flight of birds and insects (Bode-Oke & Dong Reference Bode-Oke and Dong2020; Li, Dong & Zhao Reference Li, Dong and Zhao2020). These provide insights into the fundamental phenomenon for the generation of dynamic force (i.e. lift, thrust and drag) under different biological conditions and kinematics. The conceptual advancements from these studies have been the prime motivator behind the ongoing innovations in marine propulsion, aerial flight technologies and novel energy harvesting systems (Wu et al. Reference Wu, Zhang, Tian, Li and Lu2020).
Studies conducted specifically within the realm of hydrodynamic propulsion have also focused on how the motion of a fluid around a bluff body, such as a circular cylinder or hydrofoil, was utilized to harvest energy contained in the fluid and thereby generated a forward propelling force (Williamson & Roshko Reference Williamson and Roshko1988; Koochesfahani Reference Koochesfahani1989; Triantafyllou, Triantafyllou & Grosenbaugh Reference Triantafyllou, Triantafyllou and Grosenbaugh1993; Triantafyllou, Triantafyllou & Yue Reference Triantafyllou, Triantafyllou and Yue2000). These active flow manipulations are attained mostly through the influence of oscillatory kinematics generally involved with a motion in one or more degrees of freedom (Koochesfahani Reference Koochesfahani1989; Anderson et al. Reference Anderson, Stretlien, Barrett and Triantafyllou1998; Godoy-Diana, Aider & Wesfreid Reference Godoy-Diana, Aider and Wesfreid2008; Schnipper, Andersen & Bohr Reference Schnipper, Andersen and Bohr2009; Cleaver, Wang & Gursul Reference Cleaver, Wang and Gursul2012; Lagopoulos, Weymouth & Ganapathisubramani Reference Lagopoulos, Weymouth and Ganapathisubramani2019; Van Buren, Floryan & Smits Reference Van Buren, Floryan and Smits2019). Each kinematic regime is observed to coincide with specific spatio-temporal characteristics of wakes that can be associated with the nature of the force produced by the oscillating body (Anderson et al. Reference Anderson, Stretlien, Barrett and Triantafyllou1998). Numerous studies exist that characterized extensively the oscillations with a single degree of freedom, such as pure heaving or pitching (Smits Reference Smits2019). The coupled oscillation with two degrees of freedom had gained considerable attention recently on account of its greater complexity with additional motion parameters and their interdependence with induced changes in flows (Van Buren et al. Reference Van Buren, Floryan and Smits2019). Here, we aim to explore and characterize specific kinematic regimes for the coupled pitching and heaving motion of an oscillating hydrofoil, where the influence of phase offset ( $\phi$) between pitching and heaving motions on evolution of the wake is examined for a broad parameter space.
We review briefly some of the early prominent studies mentioned above. Williamson & Roshko (Reference Williamson and Roshko1988) described the formation of wake modes behind a transversely oscillating cylinder that had different spatial arrangement and temporal shedding of coherent structures. The peculiar modes observed with increasing transverse amplitude ( $A$) and wavelength ratio ( $\lambda /d$, where $d$ is the diameter of the cylinder) constituted pairs of counter-rotating vortices shed in a one-half shedding cycle (Williamson & Roshko Reference Williamson and Roshko1988). These modes were termed as $2P$, where two paired structures were shed in one oscillation cycle (Williamson & Roshko Reference Williamson and Roshko1988). In a few other modes, such pairs also shed with additional isolated vortices, which were then categorized and termed as $2P+2S$ or $P+S$, based on whether two or one isolated structures were shed in the wake (Williamson & Roshko Reference Williamson and Roshko1988). Schnipper et al. (Reference Schnipper, Andersen and Bohr2009) also observed exotic wakes behind an oscillating foil that executed pure pitching motion. Within a range of trailing edge amplitude ( $A$) and associated Strouhal number ( $St_A=2fA/U_{\infty }$, where $f$ is the frequency of oscillation), their experiments depicted modes ranging through $2P$,
$2P$,  $4P$,
$4P$,  $4P+2S$ and $8P$. The $2P$ mode observed within fixed parametric ranges for $St_A$ and $A_{D}=2A/D$ coincided with optimal values required for more efficient propulsion of fish (Muller, van den Boogaart & van Leeuwen Reference Muller, van den Boogaart and van Leeuwen2008; Schnipper et al. Reference Schnipper, Andersen and Bohr2009). Their study also evaluated the transition of $2P$ to $2S$ mode with increasing $St_A$. This transition was modelled mathematically in terms of the relative circulation strength of coherent structures formed at leading and trailing edges of the foil (Schnipper et al. Reference Schnipper, Andersen and Bohr2009). It suggested that an increase in $St_A$ contributed to strengthening of the trailing edge vortex compared to the leading edge vortex. This phenomenon eventually led to an early merger between the shed structures, and thus a transition from $2P$ to $2S$ mode (Schnipper et al. Reference Schnipper, Andersen and Bohr2009).
Similar to foils undergoing pure pitching, studies focusing on kinematics of purely heaving foils suggested the formation of deflected wake modes with increasing oscillation frequency, which included Modes A and B (Cleaver et al. Reference Cleaver, Wang, Gursul and Visbal2011, Reference Cleaver, Wang and Gursul2012; Calderon et al. Reference Calderon, Cleaver, Gursul and Wang2014). These modes were characterized primarily by dipole configuration of counter-rotating vortex structures with much closer proximity compared to those observed in paired vortices of  $2P$ mode in wakes of pitching foils (Cleaver et al. Reference Cleaver, Wang, Gursul and Visbal2011; Calderon et al. Reference Calderon, Cleaver, Gursul and Wang2014; He & Gursul Reference He and Gursul2016). Cleaver et al. (Reference Cleaver, Wang, Gursul and Visbal2011) described dual branch configurations of wakes, Mode-1 and Mode-2, comprised of a dipolar formation of counter-rotating vortex structures. Cleaver et al. (Reference Cleaver, Wang and Gursul2012) also characterized dipoles or couples that were comprised of counter-rotating structures with an equal circulation strength.
In addition to classifications of wakes highlighted above, an assessment for the association of spatial configurations of wakes and performance variation within specific kinematic regimes formed an integral part of some numerical and experimental studies. Das, Shukla & Govardhan (Reference Das, Shukla and Govardhan2016) investigated the variation in propulsive performance and characterization of wakes at increasing Reynolds numbers ( $10 \le Re \le 2000$) and Strouhal numbers ( $0\le St \le 1$), using two-dimensional simulations of purely pitching foil. Their study revealed a steep increase in propulsive efficiency observed for increasing $St$. It was found to be associated with shift in the streamwise location at which the wake deflected behind the foil. Their wake map also revealed that the transition of wake from Bénard–von Kármán ( $BvK$) to reverse Bénard–von Kármán ( $rBvK$) preceded the drag-to-thrust transition for all Reynolds numbers. The experimental results of Van Buren et al. (Reference Van Buren, Floryan and Smits2019) depicted an increased propulsive efficiency with changes in kinematics of the foil. They evaluated novel scaling relations of thrust and power of an oscillating foil, undergoing a combined heaving and pitching motion at $Re= 8000$. The propulsive benefits observed were aligned with earlier observations of Anderson et al. (Reference Anderson, Stretlien, Barrett and Triantafyllou1998), which related gains in performance with constructive interference between trailing and leading edge vortices at optimum phase lag or offset $90^\circ$. This study also offered deeper insights about the influence of the changing phase angle between pitching and heaving motion on the propulsive performance, which had not been investigated in detail previously. In particular, Van Buren et al. (Reference Van Buren, Floryan and Smits2019) suggested that changes in $\phi$ influenced the motion in terms of either pitch- or heave-dominated kinematics, and therefore effected the propulsive performance. However, more extensive analysis is still needed to identify important features of wakes that show novel spatio-temporal characteristics due to changes in phase angle and resulting transitions in kinematics of oscillating foils.
Besides extensive experimental investigations (Van Buren et al. Reference Van Buren, Floryan and Smits2019), recent two-dimensional numerical studies by Lagopoulos et al. (Reference Lagopoulos, Weymouth and Ganapathisubramani2019) and Zheng et al. (Reference Zheng, Xie, Zheng, Ji and Zhu2019) discussed the wake and performance metrics for a foil performing coupled two degrees of freedom oscillations, for a fixed phase angle  $90^\circ$ (or $270^\circ$ in the reference frame of Van Buren et al. Reference Van Buren, Floryan and Smits2019). Verma & Hemmati (Reference Verma and Hemmati2021b) also described evolution of the primary wake structures of an oscillating foil in coupled heaving and pitching motion. However, this investigation was limited to $\phi = 270^\circ$ and $330^\circ$, which corresponded to kinematic regimes for high propulsive efficiencies and production of greater thrust, respectively (Van Buren et al. Reference Van Buren, Floryan and Smits2019). Furthermore, these phase angles characterized primarily a pitch-dominated oscillatory motion, where the trailing edge amplitude was higher compared to the leading edge. Most recently, Cimarelli, Franciolini & Crivellini (Reference Cimarelli, Franciolini and Crivellini2021) conducted two-dimensional numerical simulations of pure heaving foil in order to investigate the role of kinematic and flow parameters in prompting smooth and sharp transition in configurations of wake. In the range of Reynolds numbers between 50 and 5000, they determined that increasing $Re$ beyond the critical value 200 led to a transition in configuration of wake from $rBvK$ to a stable deflected mode. The wake then attained the $rBvK$ mode again (Cimarelli et al. Reference Cimarelli, Franciolini and Crivellini2021). These studies either had focused on oscillations with a single degree of freedom, or were limited to pitch-dominated mixed motions. As such, a very limited characterization of the wakes for heave-dominated coupled motion exists in the literature for flapping foils.
There also exist serious gaps in our knowledge related to wakes of oscillating foils undergoing combined pitching and heaving motion. To address these, our major goal in this study is to understand the novel wake characteristics when the phase offset between the heave and pitch motion increases from  $0^\circ$ to $180^\circ$ for a given chord-based Strouhal number ( $St_c$) and Reynolds number. This range of phase offset also presents a vivid transition of kinematics of foils from a pitch- to heave-dominated coupled oscillatory motion. In particular, we provide detailed evidence and insights into transition of wake topology towards bifurcated vortex streets characterized by dipole-like paired vortical structures. Quantitative and qualitative characteristics of evolution are described further for such streets that constitute dipole-like vortical pairs. A mathematical model for relative circulation strength of counter-rotating structures is then proposed in terms of Strouhal number based on trailing and leading edge amplitudes. This model characterizes particularly the behaviour of wake during coupled heaving and pitching kinematics. Finally, mean flow features associated with the bifurcated dual vortex streets are also highlighted in order to provide detailed insights on time-averaged spatial development of wake under such circumstances. The paper is arranged such that the problem and methodology are explained in § 2, followed by the discussion of results in § 3. Major conclusions are then presented in § 4.
2. Methodology
The flow around a teardrop foil (figure 1) with maximum thickness ( $D$) to chord length ( $c$) ratio $D/c=0.1$ is examined numerically at a range of chord-based Strouhal numbers ( $St_{c} = fc/U_{\infty } = 0.16\unicode{x2013}0.48$), amplitude-based Strouhal numbers ( $0.06 \le St_{A} \le 0.34$) and Reynolds numbers ( $Re = U_{\infty } c/\nu = 1000\unicode{x2013}4000$). Here, $U_\infty$ is the freestream velocity, $\nu$ is the fluid viscosity, and $f$ is the frequency of oscillations. Recent experimental studies of Van Buren et al. (Reference Van Buren, Floryan, Wei and Smits2018, Reference Van Buren, Floryan and Smits2019) and Floryan et al. (Reference Floryan, Van Buren, Rowley and Smits2017), which focused on propulsive performance and scaling relations of underwater propulsors, suggested that the teardrop foil geometry represented a simplified model for fish tail fins. We further limited the detailed analyses of the wake characteristics to the cases $Re= 1000$ and 4000, where the wake features and transition effects were more profound without the additional complexities associated with higher Reynolds number flows (Zurman-Nasution, Ganapathisubramani & Weymouth Reference Zurman-Nasution, Ganapathisubramani and Weymouth2020). This choice of $Re$ also followed closely with assessments conducted by Godoy-Diana et al. (Reference Godoy-Diana, Aider and Wesfreid2008), Schnipper et al. (Reference Schnipper, Andersen and Bohr2009), Deng, Sun & Shao (Reference Deng, Sun and Shao2015), Das et al. (Reference Das, Shukla and Govardhan2016), Lagopoulos et al. (Reference Lagopoulos, Weymouth and Ganapathisubramani2019) and Cimarelli et al. (Reference Cimarelli, Franciolini and Crivellini2021).

Figure 1. Schematics of the foil kinematics and resultant velocity at the leading edge during the motion.
The foil oscillates with a combined heaving and pitching motion at a point located approximately  $0.05c$ from the leading edge. Figure 1(a) depicts the oscillating foil, where heave and pitch amplitudes are denoted by $h_L$ and $\theta _o$, respectively. The resultant trailing edge amplitude is depicted as $A_T$. For this study, $h_L/c$ and $\theta _o$ are fixed at 0.25 and $10^\circ$, respectively. Figure 1(b) further depicts the heave ( $\dot {h}_{L}$) and effective ( $U_{eff}$) velocities as seen by the leading edge of the foil. These would be helpful while modelling the vorticity production and circulation strength of vortex structures originating at the leading edge boundary layer. The phase offset ( $\phi$) varied from $0^\circ$ to $270^\circ$, which resulted directly in a variation of trailing edge amplitude ( $A_T$). The sinusoidal motion profiles of heave ( $h$) and pitch ( $\theta$), where pitching has phase advancement $\phi$ relative to heaving, are represented using
 \begin{gather} h(t)=h_{L} \sin (2 {\rm \pi}f t), \end{gather}
 \begin{gather} \theta(t)=\theta_{o} \sin (2 {\rm \pi}f t+\phi). \end{gather}
On account of variation in  $\phi$ and $A_T$, the Strouhal number ( $St_A = 2fA_{T}/U_{\infty }$) also varied in the range specified in the previous paragraph, where the maximum and minimum $St_{A}$ correspond to $\phi = 0^\circ$ and $180^\circ$, respectively. Andersen et al. (Reference Andersen, Bohr, Schnipper and Walther2017) have indicated that interesting and significant transitions in the wake of flapping foils were observable within a Strouhal number range of $0.2< St_{A} < 0.4$. This also coincides with the range corresponding to optimal propulsive efficiency in swimming mammals (Triantafyllou et al. Reference Triantafyllou, Triantafyllou and Grosenbaugh1993; Smits Reference Smits2019). Further, the specified range of $St_A$ had been observed to preserve the wake two-dimensionality of a flapping foil that involved a pure pitching or a pitch- or heave-dominated coupled motion setting (Zurman-Nasution et al. Reference Zurman-Nasution, Ganapathisubramani and Weymouth2020). This further justified the parameter space considered in the current study.
Note that the most propulsively efficient phase offset of  $90^\circ$ according to Anderson et al. (Reference Anderson, Stretlien, Barrett and Triantafyllou1998), which was also employed by Zheng et al. (Reference Zheng, Xie, Zheng, Ji and Zhu2019) and Lagopoulos et al. (Reference Lagopoulos, Weymouth and Ganapathisubramani2019), is equivalent to $\phi = 270^\circ$ in the current study following the reference coordinate system employed by Van Buren et al. (Reference Van Buren, Floryan and Smits2019).
2.1. Numerical details
The continuity and Navier–Stokes equations were solved directly using OpenFOAM, which is a finite-volume method that has been used extensively for simulating wake dynamics of oscillating foils and panels (Senturk & Smits Reference Senturk and Smits2018; Hemmati, Van Buren & Smits Reference Hemmati, Van Buren and Smits2019; Zheng et al. Reference Zheng, Xie, Zheng, Ji and Zhu2019; Bose, Gupta & Sarkar Reference Bose, Gupta and Sarkar2021; Verma & Hemmati Reference Verma and Hemmati2021a,Reference Verma and Hemmatib; Verma, Khalid & Hemmati Reference Verma, Khalid and Hemmati2022b). The oscillatory foil dynamics was modelled using the overset grid assembly (OGA) method, based on a stationary background grid and a moving overset grid that are merged for the simulation (Petra Reference Petra2019). Extensive details of the method can be found in Verma & Hemmati (Reference Verma and Hemmati2020, Reference Verma and Hemmati2021b).
The computational domain is depicted in figure 2, which highlights the C-type overset boundary containing the foil. The boundary conditions at the inlet were prescribed a uniform fixed velocity (Dirichlet) and a zero normal gradient (Neumann) for pressure. At the outlet, a zero-gradient outflow boundary condition was implied (Deng et al. Reference Deng, Sun and Shao2015). The top and bottom walls are further prescribed a slip boundary condition that models effectively the open surface flows and resembled closely the experimental conditions (Hemmati et al. Reference Hemmati, Van Buren and Smits2019; Van Buren et al. Reference Van Buren, Floryan and Smits2019). At the foil boundary, a no-slip condition for velocity and a zero-gradient condition for pressure was ensured. Figure 3 depicts further the non-homogeneous hexahedral grid comprising a C-type grid to model the foil geometry and motion. This region overlaps a rectangular background grid. Higher refinement was provided in critical overlapping regions, such that the near body vortex shedding and wake interactions were captured accurately. The grid expanded further towards the domain boundaries at an expansion factor of less than  $1.02$. The flow was solved using the overPimpleDyMFoam solver, which integrated the functionality of OGA and the PIMPLE algorithm. Second-order accurate backward and central difference schemes were employed for temporal and spatial discretizations, respectively (Senturk & Smits Reference Senturk and Smits2018). The momentum equations were solved using the preconditioned biconjugate gradient (PbiCGSTAB) method, whereas the preconditioned conjugate gradient (PCG) method was employed for the Poisson equation (Deng et al. Reference Deng, Sun and Shao2015; Zheng et al. Reference Zheng, Xie, Zheng, Ji and Zhu2019).

Figure 2. Schematics of the computational domain (not to scale) with boundary conditions.

Figure 3. Schematics of the grid and overset grid assembly method.
A spatial convergence analysis was also completed at  $Re=8000$, $h_{L}/c=0.25$, $\theta _{o}=15^\circ$, $\phi =270^\circ$ and $St_c=0.67$. This enabled a comparative evaluation with experiments of Van Buren et al. (Reference Van Buren, Floryan and Smits2019). Table 1 and figure 4 summarize the grid convergence results involving three grids, where Grid1, Grid2 and Grid3 comprised approximately $4.7\times 10^5$, $8.5\times 10^5$ and $1.7\times 10^6$ elements, respectively. Here, the ratio ( $\delta ^*$) of minimum grid size element ( $\Delta x$) to Kolmogorov scale ( $\eta$) was kept below 10, within the critical region near the foil (see table 1). The Kolmogorov scale was calculated based on kinematic viscosity ( $\nu$) and the dissipation rate of turbulence kinetic energy ( $\epsilon$), given by the relation $\eta \approx (\nu ^3/\epsilon )^{0.25}$ (Pope Reference Pope2000). The first cell layer size also corresponds to 0.012 $c$, 0.007 $c$ and 0.004 $c$ for Grid1, Grid2 and Grid3, respectively. This is fairly similar to the study of Senturk & Smits (Reference Senturk and Smits2018), and it is even finer (on order of magnitude) compared to the grid utilized by Zheng et al. (Reference Zheng, Xie, Zheng, Ji and Zhu2019, Reference Zheng, Xie, Ji, Zhu and Zheng2020). The coefficient of thrust ( $\overline {C_T}=\bar {T} /0.5 \rho s c U_{\infty }^{2}$), which was averaged over the final 10 oscillating cycles following the statistical convergence, was used as a quantitative estimate for spatial grid convergence. The relative error ( $\epsilon _T=|\overline {C_{T}}_{,exp}-\overline {C_{T}}| / \overline {C_{T}}_{,exp}$) calculated with respect to the experimental results (Van Buren et al. Reference Van Buren, Floryan and Smits2019) was below $5\,\%$ for Grid2.
Table 1. Grid convergence analysis for the oscillating foil. Here,  $N_{total}$ represents the sum of hexahedral elements in the background and overset grids.

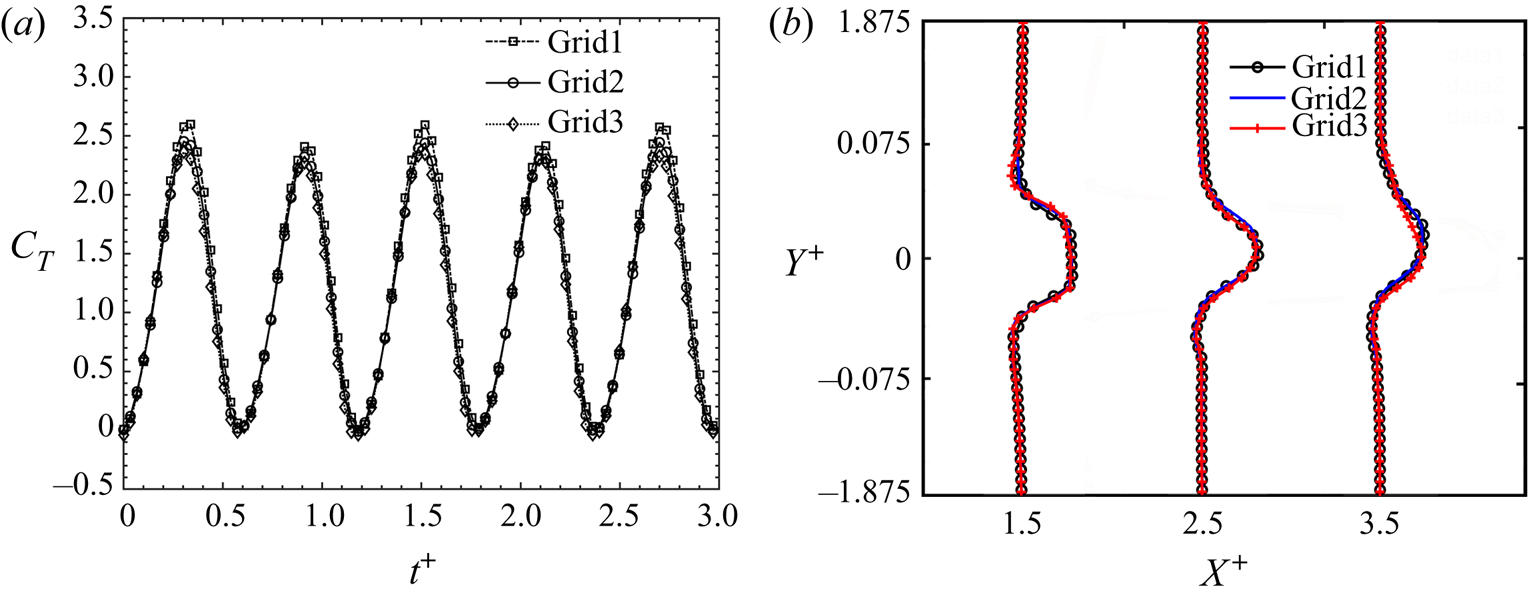
Figure 4. Comparison of (a) unsteady variation of  $C_T$, and (b) cross-stream velocity profiles at increasing streamwise distance ( $x^+$) for three grids.
Figure 4 shows the instantaneous  $C_T$ variation and cross-stream distribution of mean streamwise velocity ( $\overline {U_{x}^+}$) at increasing streamwise distance $(X^+)$ for the three grids discussed in table 1. These results show clearly that the propulsive performance and wake characteristics of the foil are not sensitive to the spatial grid resolution. This further provided sufficient confidence to use Grid2 for our analysis. The time step size ( $\delta t$) was also set, such that the ratio of eddy turnover time ( $\tau _{\eta }$) to $\delta t$ for the smallest dissipative eddy (Pope Reference Pope2000) yields at least 100 time steps. This ensured that our simulations had adequate resolution to capture essential turbulent characteristics, which aligned with the recommendations of Merrill & Peet (Reference Merrill and Peet2017). The Courant number ( $Co$) was also maintained below 0.5, similar to the simulations of Hemmati et al. (Reference Hemmati, Van Buren and Smits2019). Validation of the numerical solver with experiments (Van Buren et al. Reference Van Buren, Floryan and Smits2019) is also depicted in figure 5. Specifically, figure 5(a) shows that the computationally predicted $\overline {C_{T}}$, for $0< h_{L}/c<0.25$, $\theta _{o}=15^\circ$, $\phi =270^\circ$ and $St_c=0.67$, was in good agreement with experiments of Van Buren et al. (Reference Van Buren, Floryan and Smits2019). Figure 5(b) depicts further the instantaneous contribution of the transverse force ( $P_{F_Y}$) and pitch moment ( $P_{M_Z}$) to the total power ( $P_o$) within one oscillation cycle. The computational predictions follow closely the quantified variation observed from experiments (Van Buren et al. Reference Van Buren, Floryan and Smits2019). The implications of two-dimensional simulations on the wake dynamics, compared to three-dimensional simulations, are also important within the scope of the current study. There are several studies (e.g. Das et al. Reference Das, Shukla and Govardhan2016; Zheng et al. Reference Zheng, Xie, Zheng, Ji and Zhu2019; Zurman-Nasution et al. Reference Zurman-Nasution, Ganapathisubramani and Weymouth2020) that revealed prominence of three-dimensional effects at $Re > 5000$ for oscillating foils. These studies also suggest that two-dimensional simulations are sufficient for capturing coherent flow structures at the relatively low $Re$ considered here, e.g. 1000–4000. This range of Reynolds numbers aligns well with biological applications of swimming fish and small marine mammals (Godoy-Diana et al. Reference Godoy-Diana, Aider and Wesfreid2008; Deng et al. Reference Deng, Sun and Shao2015; Smits Reference Smits2019). We have verified thoroughly that three-dimensional effects do not affect our analyses by completing a sensitivity study (besides our grid-sensitivity study and Kolmogorov scale ratio analyses) on three- versus two-dimensional simulations. However, the results are not shown here, for brevity, since they align clearly with the observations noted in the previous studies mentioned above.

Figure 5. Comparison of (a) numerically obtained variation of  $\overline {C_{T}}$, and (b) unsteady contributions of transverse force and pitch moment to the total input power of the oscillating foil with experiments of Van Buren et al. (Reference Van Buren, Floryan and Smits2019).
Extensive efforts for verification and validation of the numerical solver with respect to domain size, spatial and temporal grid, OGA solver and boundary conditions can be found in Hemmati et al. (Reference Hemmati, Van Buren and Smits2019) and Verma & Hemmati (Reference Verma and Hemmati2020, Reference Verma and Hemmati2021b).
3. Results and discussions
We begin by looking at the kinematics of the oscillating foil at increasing phase offset, chord-based Strouhal number and Reynolds number. In particular, these aspects are helpful in evaluating and modelling production of vorticity, and therefore the circulation strength for vortical structures. The shedding of these structures also coincides with the transition of a pitch- to heave-dominated coupled motion. We will then provide a qualitative discussion on the transition and formation mechanisms of peculiar wake modes for increasing  $\phi$. This reveals the transition to bifurcated dual vortex street characterized by dipole-like paired vortices. Quantification of evolutionary characteristics, such as circulation strength and the separation distance between the shed vortical structures, is then evaluated in order to model the formation of wake mode, and transition in spatial topology with respect to the kinematics of oscillating foil. Initially, the wake analyses are focused on the case $Re=1000$, which allows for a more detailed and vivid characterization of coherent structures. This is then expanded to a higher Reynolds number $Re=4000$, wherein effects of Reynolds numbers are expected to be negligible (Das et al. Reference Das, Shukla and Govardhan2016; Senturk & Smits Reference Senturk and Smits2019; Gungor & Hemmati Reference Gungor and Hemmati2021). Finally, the mean flow characteristics are evaluated, which highlight spatio-temporal features of wake that are common to the configuration of dual vortex street characterized by dipole-like pairs.
3.1. Evaluation of kinematics
The kinematics of oscillating foil in combined heaving and pitching motion is described within the range  $0^\circ \le \phi \le 270^\circ$ at $0.16\le St_c \le 0.48$. Instantaneous variations in trailing and leading edge amplitudes ( $a_{T}^+$, $h_{L}^+$), and effective angle of attack ( $\alpha$), are depicted in figure 6 for one oscillation cycle, whereas the effect of increasing $\phi$ on $a_{T}^+$ and $\alpha$ is particularly observable in figures 6(a,c). Figure 6(d) depicts further variations in the peak angle of attack ( $\alpha _{o}$) with respect to increasing phase offset and $St_c$. The effective angle of attack for a foil with combined heaving and pitching motion is the resultant of both pitch- and heave-induced angle of attack (Lagopoulos et al. Reference Lagopoulos, Weymouth and Ganapathisubramani2019). This is expressed mathematically as
 \begin{equation} \alpha={-}\theta-\arctan \left(\dot{h} / U_{\infty}\right), \end{equation}
where  $\dot {h}$ is the heave velocity of the foil. The variation of $\phi$, corresponding to the peak angle of attack (i.e. $\phi = 90^\circ$), is consistent for increasing $St_c$.

Figure 6. Temporal variation of (a) trailing edge amplitude ( $a_{T}^+$), (b) leading edge (heave) amplitude ( $h_{L}^+$), and (c) instantaneous $\alpha$, within one single oscillation cycle. (d) Variation of peak $\alpha$ with respect to $\phi$ and $St_c$.
The maximum  $a_{T}^+$ as observed from figure 6(a) is attained for $\phi = 0^\circ$, which then decreases with $\phi$ approaching $180^\circ$. Increasing $\phi$ from $180^\circ$ to $270^\circ$ results in a higher peak $a_{T}^+$ within one oscillation cycle. On comparing the ratio of peak $a_{T}^+$ and $h_{L}^+$ with changing $\phi$, it can be deduced that a smooth shift from pitch- to heave-dominated kinematics occurs with the phase offset approaching $180^\circ$. Then it reverts back to the pitch-dominated motion as $\phi$ increases beyond $180^\circ$. Our understanding about the influence of variations in such kinematics on evolution of wakes is still incomplete and therefore needs more attention. Moreover, the variation in $\alpha$ also depicts an increase in its peak, which then decreases to a minimum at $\phi = 270^\circ$. This is also observed in figure 6(d). The peak angle of attack holds considerable importance in terms of governing the dynamics of leading edge vortex and stall characteristics of the oscillating foil (Visbal Reference Visbal2009; Carr Reference Carr2012). In order to investigate these aspects, specifically when a transition occurs from pitch- to heave-dominated coupled motion of a foil, we now discuss newly identified important observations with respect to evolution of wake that coincides with the aforementioned transition in kinematic regimes.
3.2. Evaluation of wake mode transition at  $Re= 1000$

To understand the configuration of wake and its transition for a range of phase offset, amplitude and  $St_c$ at $Re= 1000$, we draw representative wake maps shown in figure 7. Specifically, figures 7(a) and 7(b) correspond to phase spaces characterized by $\phi$ versus $St_{c}$ and $A_{c}$ versus $St_{c}$, respectively. Figure 7(b), in particular, allows a comparison of transitions in wake topology with studies conducted on oscillating foils in pure pitching motion (Schnipper et al. Reference Schnipper, Andersen and Bohr2009). The nomenclature of wake modes is also aligned with the studies conducted by Williamson & Roshko (Reference Williamson and Roshko1988) and Schnipper et al. (Reference Schnipper, Andersen and Bohr2009), which considered the number of shed vortical structures in one oscillation cycle for a cylinder and teardrop foil, respectively. For $St_c$ below 0.32 in figure 7(a), it is observed that three wake modes corresponding to wavy Bénard–von Kármán ( $wBvK$) (Lentink et al. Reference Lentink, Muijres, Donker-Duyvis and van Leeuwen2008), $2P+2S$ and $2P$, (Schnipper et al. Reference Schnipper, Andersen and Bohr2009) are prominent at $Re= 1000$. More details of the wake categorization and transition at $Re=1000$ can also be found in Verma & Hemmati (Reference Verma and Hemmati2022). For $St_c=0.4$ and $Re= 1000$, the heave-dominated kinematics corresponding to $90^\circ \le \phi \le 180^\circ$ also depicts the dominance of $2P$ mode along with a characteristic bifurcation (marked by $B$ in figure 7a) noticed between the two shed vortex pairs of $2P$, particularly at $\phi = 180^\circ$. A transition from $rBvK$ to $BvK$, followed by the similar bifurcation of $2P$ pairs, is further observed at $St_{c}= 0.48$.

Figure 7. Phase map representation of identified wake modes at increasing  $St_c$, $\phi$ and $A_{c}$ for $Re= 1000$.
It is worthwhile to observe if such wake mode transitions in terms of number of shed vortex structures, or characteristic bifurcations of shed  $2P$ pairs, could coincide with a threshold value of $St_A$, as investigated by Schnipper et al. (Reference Schnipper, Andersen and Bohr2009), who focused particularly on purely pitching foils. Schnipper et al. (Reference Schnipper, Andersen and Bohr2009) observed that the transition from $2P$ to standard von Kármán ( $2S$) mode coincided with the iso-line represented by $St_A= 0.11$. Furthermore, the transition of $2S$ to $rBvK$ mode coincided with the line for $St_A= 0.18$ (Schnipper et al. Reference Schnipper, Andersen and Bohr2009). In order to evaluate such coinciding transitions of wake modes with iso-lines of constant $St_A$ in our study, we explain the wake modes at $Re= 1000$ on an $A_{c}\unicode{x2013}St_{c}$ phase space diagram shown in figure 7(b). Here, $A_{c}$ is the normalized trailing edge amplitude calculated as $2A_{T}/c$. The product of $A_c$ and $St_c$ yields lines of constant $St_A$ on the phase space represented in figure 7(b). The two iso-lines drawn on the phase diagram correspond to $St_A= 0.1$ and 0.2, respectively. The range between the observed iso-lines coincides with $2P$ mode. The region beyond $St_A= 0.2$ marks a transition towards $rBvK$ mode. Such findings therefore reveal a close resemblance to the observations reported by Schnipper et al. (Reference Schnipper, Andersen and Bohr2009). The transition from $2P$ mode to $rBvK$ also goes through a $BvK$ type or standard von Kármán wake mode as observed at $St_{c}= 0.48$. Further, the bifurcation of $2P$ pairs is found to lie below the line of $St_A= 0.1$, whereas increasing $St_A$ beyond 0.1 does not reveal any bifurcations on the phase diagram. Besides the similarity observed in the trends of transition in wake mode configuration, with increasing $St_A$, the bifurcation of $2P$ pairs observed at some kinematic settings also reveals a qualitative similarity with the visualizations of $2P$ mode by Schnipper et al. (Reference Schnipper, Andersen and Bohr2009) and Andersen et al. (Reference Andersen, Bohr, Schnipper and Walther2017). However, specific details and features of the topological transitions in spatial arrangements of vortex structures, constituting the $2P$ mode, were not identified or investigated. We will therefore provide in-depth qualitative and quantitative descriptions of the characteristics of evolution while the $2P$ mode undergoes transitions in spatial topologies and encounters bifurcation of shed vortex pairs at certain kinematic settings observed in figure 7.
The wake formations at increasing  $\phi$ are depicted in figure 8, at $Re=1000$ and $St_c= 0.4$. A dominant shedding of counter-rotating vortex pairs in each half oscillation cycle is observed commonly for all the cases presented here. However, the changes in spatial configurations of paired structures are observed for increasing $\phi$. At $\phi = 0^\circ$, a $2P$ mode (Williamson & Roshko Reference Williamson and Roshko1988; Schnipper et al. Reference Schnipper, Andersen and Bohr2009) appears, which is characterized by horizontally pointed pairs. The counter-rotating vortex structures TEV $_{ac}$ and LEV $_{c}$, marked on figure 8(a), represent a $2P$ vortex pair. Here, subscripts $ac$ and $c$ denote the anticlockwise and clockwise rotating vortical structures, respectively. Another shed structure, LEV $_{ac}$, undergoes mutual interaction with the leg of TEV $_{ac}$. It is important to mention here that the abbreviations TEV $_s$ and LEV $_s$ denote the coherent structures formed at the trailing and leading edge of the foil, respectively. For the pitch-dominated motion profile at $\phi = 0^\circ$ (see figure 6), TEV $_{ac}$ is stronger than LEV $_{ac}$ based on their circulation strength and size in figure 8(a). It results eventually in the merger of similar sign LEV $_s$ and TEV $_s$ of the neighbouring pairs, traversing downstream in the wake. A similar $2P$ configuration was observed and discussed previously by Williamson & Roshko (Reference Williamson and Roshko1988), Schnipper et al. (Reference Schnipper, Andersen and Bohr2009) and Hultmark, Leftwich & Smits (Reference Hultmark, Leftwich and Smits2007) in the wake of a transversely oscillating cylinder, a pitching foil and flexible robotic fins in sinusoidal oscillations, respectively. These $2P$ modes have also presented similarities in spatial configurations of thrust-producing wakes by swimming fish (Muller et al. Reference Muller, van den Boogaart and van Leeuwen2008; Schnipper et al. Reference Schnipper, Andersen and Bohr2009).

Figure 8. Wake modes at increasing  $\phi$ and $Re= 1000$. Panels (a–f) represent $\phi$ corresponding to $0^\circ$, $45^\circ$, $90^\circ$, $120^\circ$, $180^\circ$ and $225^\circ$, respectively, while $St_c=0.4$.
In order to elaborate further on the effects of increasing  $\phi$, we observe that at $\phi = 45^\circ$, $2P$ vortex pairs are tilted and point in the upstream direction. No noticeable merger or interaction is observed between the neighbouring structures of these pairs, as shown in figure 8(b). These pairs also advect symmetrically along the wake centreline. The shed TEV possesses higher strength of circulation, in a qualitative sense, similar to the observations made at lower $\phi$. Quantitative assessments for circulation are, however, presented in the next subsection for understanding the effects of changing $\phi$ on generation of vorticity. Moreover, wake formation at increasing $\phi$ up to $90^\circ$ depicts shedding of counter-rotating vortices with a decreased separation distance ( $\zeta$) between their centres compared to the cases with lower values of $\phi$. A similar observation can be made for $\phi = 120^\circ$, where resemblance to dipole-like $2P$ pairs now become more vivid. We refer to such vortex pairs as $2P^D$ pairs in order to highlight them as dipole-like paired configurations, which appear in stark contrast to the $2P$ pairs observed at $\phi = 0^\circ$ and $45^\circ$, respectively. Also, the wake still possesses a symmetry with respect to its centreline until $\phi = 120^\circ$. Beside mutual interaction and merger of vortices, we do not observe any bifurcation of the shed pairs and dipole-like ( $2P^D$) structures observed at increasing $\phi$. However, two vortex streets constituting fully developed $2P^D$ pairs diverge away from the wake centreline with $\phi$ approaching $180^\circ$ (see figure 8e). Structures forming such fully developed dipole-like configurations possess similar strengths of circulation and size, which was also reported by Cleaver et al. (Reference Cleaver, Wang and Gursul2012), Calderon et al. (Reference Calderon, Cleaver, Gursul and Wang2014), He & Gursul (Reference He and Gursul2016) and Verma & Hemmati (Reference Verma and Hemmati2021b). Experimental studies of Cleaver et al. (Reference Cleaver, Wang and Gursul2012) and Calderon et al. (Reference Calderon, Cleaver, Gursul and Wang2014) discussed the formation of dipoles and couples behind oscillating foils in purely heaving motion and further explained their prominent association and coincidence with deflected wake modes (i.e. Mode A or Mode B). Here, the dual vortex streets seen at $\phi = 180^\circ$ in figure 8(e) retain a symmetry along the wake centreline. This observation could indicate qualitatively that the entrainment effects of shed dipole-like structures (Calderon et al. Reference Calderon, Cleaver, Gursul and Wang2014) are equally balanced, thus preventing the overall wake deflection in the upward or downward direction as noted in previous studies (Cleaver et al. Reference Cleaver, Wang and Gursul2012; Calderon et al. Reference Calderon, Cleaver, Gursul and Wang2014). Increasing $\phi$ to $225^\circ$, as shown in figure 8(f), depicts an absence of diverging vortex streets, where trailing edge vortices are more stretched in the streamwise direction. An additional single vortex highlighted as $S$ in figure 8(f) is also shed with a coincident shedding of a $2P$ pair. This mode therefore falls in the category of $2P+2S$ (Williamson & Roshko Reference Williamson and Roshko1988; Schnipper et al. Reference Schnipper, Andersen and Bohr2009). It is now evident that while the bifurcation of $2P^D$ pairs resembles the observed $2P$ mode configuration of Schnipper et al. (Reference Schnipper, Andersen and Bohr2009), an elaborate evaluation is still warranted in order to understand the transitioning spatial topologies of $2P$ mode shown in figure 8. Furthermore, the kinematics investigated by Schnipper et al. (Reference Schnipper, Andersen and Bohr2009) followed a pure pitching motion rather than a combined heaving and pitching motion assumed in our current study.
3.3. Formation mechanism of $2P^D$ pairs and symmetric bifurcation

We now examine the formation process of  $2P^D$ pairs at $Re=1000$ by assessing the temporal evolution of shed vortical structures for the case $St_{c}= 0.4$ and $\phi = 180^\circ$. This parameter space is selected based on observations in figures 7(a) and 8(e), which allows for a better examination and characterization of bifurcations observed in $2P$ mode. The snapshots representing contours of spanwise vorticity ( $\omega _z^+$), at each quarter phase of an oscillation cycle, are illustrated in figure 9. At the beginning of an oscillation cycle (i.e. at $t=0$) in figure 9(a), a developed LEV1 $_c$ is located close to the trailing edge, where TEV1 $_{ac}^\prime$ is formed in the previous half oscillation cycle. At $t=T/4$ in figure 9(b), LEV1 $_{c}$ is detached from the trailing edge, where a new anticlockwise TEV $1_{ac}$ starts forming behind the foil. Also, a new LEV2 $_{ac}$ appears developed at approximately the mid-chord region. LEV1 $_c$ forms a dipole-like paired configuration with TEV $1_{ac}$ at the end of the half oscillation cycle (i.e. $t=T/2$) in figure 9(c), while LEV2 $_{ac}$ is on the brink of detachment from the trailing edge. With the oscillations proceeding to $t=3T/4$ in figure 9(d), the first dipole-like pair ( $D1$) is observed, which consists of vortical structures LEV1 $_c$ and TEV1 $_{ac}$. Simultaneously, a new trailing edge structure (TEV $2_{c}$) begins to form and pairs with LEV2 $_{ac}$, which is now detached from the trailing edge. By the end of one oscillation cycle in figure 9(e), TEV2 $_c$ and LEV $2_{ac}$ form a second dipole-like pair ( $D2$). Both $D1$ and $D2$ are marked in figure 9(e). This description of the formation mechanism of $2P^D$ pairs is quite similar to that of a $2P$ pair observed in the wake of oscillating cylinders (Williamson & Roshko Reference Williamson and Roshko1988) and foils (Schnipper et al. Reference Schnipper, Andersen and Bohr2009; Andersen et al. Reference Andersen, Bohr, Schnipper and Walther2017) with a single degree of freedom motion. Such $2P$ pairs were also seen in wakes corresponding to $\phi = 0^\circ$ in this study, as observed in figures 8(a) and 13(a). However, what distinguishes the $2P^D$ pair observed at $\phi = 180^\circ$ from the previously discussed $2P$ pairs is the approximate equality of circulation strength and size of the fully developed leading and trailing edge vortical structures ahead of their complete detachment from the foil's trailing edge. On account of these features, the mutual induced velocity of the dipole-like pair contributes to its movement away from the wake centreline, thus leading to the bifurcated dual vortex streets observed in figure 8(e). The dipole-like formation is also different from the dual branch Mode-1 described by Cleaver et al. (Reference Cleaver, Wang, Gursul and Visbal2011) for purely heaving foils. There, the dipole configuration constituted a weak trailing edge structure and another collective structure that was formed on account of a merger between strong leading and trailing edge vortices. This collective structure was formed and shed within one half oscillation cycle. In the case of $2P$ mode characterized by a fully developed $2P^D$ pair, we do not observe the formation of any collective structure similar to those reported by Cleaver et al. (Reference Cleaver, Wang, Gursul and Visbal2011). The above described process, therefore, hints at a spatial wake topology that is unique to foils with a combined heaving–pitching motion with different characteristics in terms of the vortex pair configuration, despite similarities in their formation process.

Figure 9. Temporal snapshots representing contours of  $\omega _z^+ = \omega _z c/U_{\infty }$, and depicting formation of a $2P^D$ pair and bifurcation within the $2P$ mode at $St_c= 0.4$, $\phi = 180^\circ$ and $Re= 1000$.
The above mentioned details of formation mechanism further allow us to relate the correspondence of the  $2P^D$ pairs to the heave-dominated regime at $Re= 1000$ (see figure 7a). As observed here, only heave-dominated cases at $Re= 1000$ present a viable scenario, where the generated trailing and leading edge vorticities attain equal circulation strength and size after getting detached from the foil's trailing edge. It results in a net induced velocity of the dipole-like pair, pushing it away from the wake centreline and thus leading to bifurcations. As the kinematics transition to the pitch-dominated regime, the trailing edge vorticity gains enough strength relative to the leading edge vorticity that an eventual merger between similar sign structures occurs (see figure 8a). Hence it leads to a symmetric $rBvK$ wake profile. Quantitative assessment described in the next subsection provides further evidence for our qualitative observations described above.
3.4. Quantitative assessment of evolution characteristics
The quantitative assessment of circulation strength ( $\varGamma ^+=\varGamma /U_{\infty }c$) and separation distance between the centres of vortices ( $\zeta ^+=\zeta /c$) can provide deeper insights into changes in evolution characteristics of the shed vortex structures with increasing $\phi$ at $Re= 1000$. These would also help us to understand particular features associated with changes in spatial topology of $2P$ wake, and appearance of bifurcations of $2P^D$ pairs. Specifically, we focus on the computed values of $\varGamma ^+$ and $\zeta ^+$ just at the instance (shown in figure 8) when the counter-rotating vortex structures form pairs ahead of the foil's trailing edge. The estimation process for $\varGamma$ involves calculating the surface integral of vorticity on a rectangular contour window using
 \begin{equation} \varGamma = \iint_{S}(\boldsymbol{\nabla} \times \boldsymbol{V}) \boldsymbol{\cdot} \boldsymbol{dS}. \end{equation}
To calculate  $\zeta$, the location of maximum vorticity magnitude, within the rectangular window surrounding the vortex, is evaluated for each structure that form either a co-rotating or counter-rotating pair. The coordinates of centres $(X,Y)$ are then used to find $\zeta$:
 \begin{equation} \zeta = \sqrt{\left(X_{2}-X_{1}\right)^{2}+\left(Y_{2}-Y_{1}\right)^{2}}, \end{equation}
where subscripts  $1$ and $2$ indicate the centre coordinates of two similar-sign or counter-rotating vortical structures, respectively. Figure 8 depicts three windows around vortex structures TEV $_{ac}$, LEV $_c$ and LEV $_{ac}$. TEV $_{ac}$ and LEV $_c$ form a pair of counter-rotating vortices, which eventually transitions to a dipole-like configuration as $\phi$ increases to $180^\circ$. TEV $_{ac}$ and LEV $_{ac}$ also undergo mutual interaction on account of their similar sense of rotation. These aspects further motivate us to understand the evolution of marked vortex structures, quantitatively.
Figure 10 shows the variation of circulation ( $\varGamma ^+$) and separation distance ( $\zeta ^+$) with increasing $\phi$ for the heave-dominated kinematic settings ( $\phi =45^\circ \unicode{x2013}180^\circ$), since the major focus is on characterizing the bifurcated vortex street observed for $2P$ mode in this range of $\phi$. As seen from figure 10(a), $\varGamma ^+$ for TEV $_{ac}$ drops consistently as $\phi$ increases from $45^\circ$ to 180 $^\circ$. However, the paired vortex structure LEV $_c$ depicts an opposite trend compared to TEV $_{ac}$, although the variation of $\varGamma ^+$ is not as significant as in case the of TEV $_{ac}$. Despite the observed variations for these paired vortex structures, the newly shed LEV $_{ac}$ depicts no changes with respect to increasing $\phi$. This signifies clearly that the dominant evolution characteristics of a leading edge vortex remain approximately similar as it attains a paired configuration with the TEV, while kinematics transition from a pitch-based motion setting to a heave-dominated oscillation. The trailing edge vorticity, however, is influenced greatly by the changes in trailing edge amplitude that were discussed previously for figure 6(a). The variation of $\zeta _1$ and $\zeta _2$, corresponding to the distance calculated between counter-rotating ( $LEV_{c}$ and TEV $_{ac}$) and co-rotating ( $LEV_{ac}$ and $TEV_{ac}$) vortex structures, is depicted further in figure 10(b). Similar to the qualitative discussion provided with respect to figure 8, we observe a decrease in $\zeta _1$ as $\phi$ increases from $45^\circ$ to $180^\circ$. On the other hand, $\zeta _2$ shows an increase up to $\phi = 90^\circ$, followed by a slightly decreasing trend towards $\phi = 180^\circ$. The birfurcated vortex streets observed at $\phi = 180^\circ$, which were characterized qualitatively by a fully developed dipole-like configuration, do possess a reduced separation distance between the counter-rotating vortex structures, along with their equal magnitude of $\varGamma ^+$. Comparing these quantitative characteristics to the dipoles observed in deflected wakes of purely heaving and pitching foils (Cleaver et al. Reference Cleaver, Wang and Gursul2012; Calderon et al. Reference Calderon, Cleaver, Gursul and Wang2014; Deng et al. Reference Deng, Sun and Shao2015; He & Gursul Reference He and Gursul2016), the dipole-like $2P^D$ pairs constituting bifurcated wake streets also resemble similar evolution characteristics. However, the resultant wake still possessed a symmetry along the wake centreline, which therefore differs from the deflected wake modes observed previously (Cleaver et al. Reference Cleaver, Wang and Gursul2012; Calderon et al. Reference Calderon, Cleaver, Gursul and Wang2014; Deng et al. Reference Deng, Sun and Shao2015).

Figure 10. Variation of (a) circulation strength ( $\varGamma ^+$) and (b) separation distance ( $\zeta ^+$) between counter-rotating and co-rotating vortex structures (highlighted in figure 8), with respect to $\phi$.
To understand further the transition from a paired configuration of counter-rotating structures with unequal circulation to the dipole-like arrangement characterized by equal strength structures ( $2P^D$ pairs), we model mathematically the circulation estimates of a single leading edge vortex and trailing edge vortex at the instant of their shedding from the foil's trailing edge. This will also highlight any existing dependence of vortex evolution characteristics on $\phi$. A single leading edge vortex structure is formed as a result of boundary layer roll-up near the leading edge, on one side of the foil. Hence its circulation estimation ( $\varGamma _{LEV}$) can be obtained by calculating the vorticity transport in the boundary layer (Schnipper et al. Reference Schnipper, Andersen and Bohr2009). This transport also assumes no-slip conditions on the foil, while considering contributions from the freestream ( $U_\infty$) and heave velocity ( $\dot {h}$) at the leading edge (see figure 1). Similar assumptions were also in place for the models developed by Schnipper et al. (Reference Schnipper, Andersen and Bohr2009), although their analysis was limited to pitching motion and did not include the dependence on heave velocity. Based on the estimation of vorticity production in the boundary layer, given by Tietjens, Prandtl & Rosenhead (Reference Tietjens, Prandtl and Rosenhead1957), we can calculate $\varGamma ^+$ for a leading edge vortex just at the instant of its shedding in one half oscillation cycle using the relation
 \begin{equation} \varGamma_{LEV}=\tfrac{1}{2} \int_{0}^{T / 2} (U_{\infty}^{2}+\dot{h}^2)\, \mathrm{d} t. \end{equation}
Here,  $U_{\infty }$ represents the freestream velocity, while the heave velocity ( $\dot {h}$) could be evaluated using the time derivative of (2.1). The integral can be subdivided as
 \begin{gather} \varGamma_{L E V}=\frac{1}{2}\left[\frac{U_{\infty}^{2} T}{2}+\int_{0}^{{T}/{2}} h_{o}^{2} 4 {\rm \pi}^{2} f^{2} \cos ^{2}(2 {\rm \pi}f t) \,{\rm d}t\right], \end{gather}
 \begin{gather} \varGamma_{L E V}=\frac{1}{2}\left[\frac{U_{\infty}^{2} T}{2}+h_{o}^{2} 4 {\rm \pi}^{2} f^{2} \frac{1}{8}\left(\frac{\sin (2 {\rm \pi}f T)}{{\rm \pi} f}+2 T\right)\right]. \end{gather}
The  $\sin$ term evaluates to zero in the above equation, which therefore simplifies the expression to
 \begin{equation} \varGamma_{L E V}=\frac{U_{\infty}^{2}}{4 f}+\frac{h_{o}^{2} {\rm \pi}^{2} f}{2}. \end{equation}
Here,  $f$ represents the frequency of oscillation (i.e. $f= 1/T$). Further, using the foil diameter ( $D$) and diameter-based Strouhal number ( $St_D= f D/U_{\infty }$), we can again rewrite the last expression as
 \begin{equation} \varGamma_{L E V}=\frac{D^{2} U_{\infty}+2\,St_{D}^{2}\,U_{\infty} h_{o}^{2} {\rm \pi}^{2}}{4 D\,St_{D}}. \end{equation}
Now, the circulation for the trailing edge vortex ( $\varGamma _{TEV}$) can be estimated in a way similar to that followed by Schnipper et al. (Reference Schnipper, Andersen and Bohr2009), where they assumed that the freestream contribution to the vorticity is negligible. The expression can be written as
 \begin{equation} \varGamma_{T E V}=\tfrac{1}{2}\left(\int_{0}^{{T}/{2}} U_{T E}^{2}(t)\,{\rm d} t\right) \approx \tfrac{1}{2} {\rm \pi}^{2} A_{T}^{2} f. \end{equation}
In terms of  $St_{D}$ and $A_D = 2A_{T}/D$, we can further rewrite the above expression as
 \begin{equation} \varGamma_{T E V}\approx\tfrac{1}{2} {\rm \pi}^{2} A_{D}^{2}\,S t_{D}\,D U_{\infty}. \end{equation}
Now, in order to obtain an approximate estimate for the ratio of  $\varGamma$ for the leading and trailing edge vortex structures, we can divide (3.10) by (3.8). This ratio can be represented in its final form:
 \begin{equation} \frac{\varGamma_{T E V}}{\varGamma_{L E V}}\approx\left[\dfrac{2{\rm \pi}^{2} A_{D}^{2}}{\dfrac{1}{S t_{D}^{2}}+\dfrac{2 h_{o}^{2} {\rm \pi}^{2}}{D^{2}}}\right]. \end{equation}
Here, the second term in the denominator is a constant value since the heave amplitude is not varying in our study. We can denote it as  $\kappa =2h_{o}^2{\rm \pi} ^2/D^2$. Also, after making some more simplifications to the above expression, we can also obtain a dependence on the amplitude-based Strouhal number ( $St_A= 2fA_{T}/U_{\infty }$), thus
 \begin{equation} \frac{\varGamma_{T E V}}{\varGamma_{L E V}}\approx\frac{1}{2}\left[\frac{{\rm \pi}^{2}\,S t_{A}^{2}}{1+\kappa\,S t_{D}^{2}}\right]. \end{equation}
 The above expression clearly highlights that at a constant  $St_D$, dependence of the ratio $\varGamma _{TEV}/\varGamma _{LEV}$ on $St_A$ is quite similar to the case of a pitching foil developed by (Schnipper et al. Reference Schnipper, Andersen and Bohr2009), although with a difference in constant of proportionality. We can still modify the above relationship to further obtain a dependence on the heave-based Strouhal number, $St_h= 2fh_{o}/U_{\infty }$. This formulation can be applied for cases where the variation of heave amplitude is also taken into account. This relationship becomes
 \begin{equation} \frac{\varGamma_{T E V}}{\varGamma_{L E V}}\approx\left[\frac{{\rm \pi}^{2}\,S t_{A}^{2}}{2+ {\rm \pi}^{2}\,S t_{h}^{2}}\right]. \end{equation}
By relating (3.13) to the qualitative depiction of wake modes on the  $A_{c}\unicode{x2013}St_{c}$ phase diagram in figure 7(b), we identify that there is a wake mode transition from $2P$ to $rBvK$ type with increasing $St_A$ from 0.1 to 0.2 and beyond. This is consistent with the observations of Schnipper et al. (Reference Schnipper, Andersen and Bohr2009), who found that a similar rise in relative strength of trailing edge structures was responsible for transition of wake from $2P$ to an $rBvK$ mode. We can also relate this derived model to our quantitative details of kinematics (figure 6) and circulation estimates depicted in figure 10(a), at constant $St_h= 0.2$ and $St_c= 0.4$. Specifically, the kinematics indicated that with increasing $\phi$ from $45^\circ$ to $180^\circ$, the peak trailing edge amplitude decreases to a minimum. This would result in a decrease in $St_A$, which, based on (3.12) and (3.13), should lead to a decrease in $\varGamma _{TEV}$. Ahead of $\phi = 45^\circ$, the variation of $\varGamma _{TEV}$ in figure 10 confirms this qualitative trend based on the strength of fully developed TEV $_{ac}$. Note that the parameters $St_D$ and $St_h$ are kept as constants in (3.12) and (3.13), respectively. The bifurcation of dipole-like vortex pairs ( $2P^D$ pairs) within $2P$ mode can be also be linked to (3.13). As stated, when $St_A$ reduces on account of increasing $\phi$, the relative trailing edge circulation strength ( $\varGamma _{TEV}$) also decreases. At the specific $St_A$ (corresponding to $\phi = 180^\circ$ and $St_c= 0.4$ in our phase space diagram), $\varGamma _{TEV}/\varGamma _{LEV}$ at the instance of shedding is such that the fully developed $2P^D$ pairs, ahead of their complete detachment from foil's trailing edge, constitute vortex structures of equal $\varGamma ^+$ and lowest $\zeta$. This was confirmed quantitatively in figure 10(a) wherein we see an equal magnitude of $\varGamma _{TEV_{ac}}^+$ and $\varGamma _{LEV_{c}}^+$ at $\phi = 180^\circ$, $St_c= 0.4$ and $St_h= 0.2$. This contributes towards a transverse induced velocity leading to advection of the $2P^D$ pairs away from the wake centreline, thus causing bifurcation.
It is clear that the approximations for circulation ratio obtained in Schnipper et al. (Reference Schnipper, Andersen and Bohr2009) for purely pitching motion and (3.13) are quite comparable when  $St_h$ is constant. However, (3.13) still provides a valid and easy extension of the previous approximation (Schnipper et al. Reference Schnipper, Andersen and Bohr2009) for an oscillating foil in coupled heaving and pitching motion, as considered here. Thus far, the validity of the proposed model is qualitatively interpreted only in terms of its accuracy in predicting the trend between relative circulation strength ( $\varGamma _{TEV}/\varGamma _{LEV}$) and $St_A$ for cases corresponding to heave-dominated kinematics at $Re= 1000$ and $St_h= 0.2$ (figure 7). In order to evaluate quantitatively the model's predictive capability at a wider parameter space, an approximate relationship is derived for the relative circulation strength in terms of $\phi$, by transforming $St_A$ into heave-based ( $St_h$) and pitch-based ( $St_{\theta }$) Strouhal numbers. This is achieved by evaluating the vector addition of $St_h$ and $St_{\theta }$ (Van Buren et al. Reference Van Buren, Floryan and Smits2019), and incorporating the phase offset $\phi$ between the pitch and heave motion. This is represented as
 \begin{equation} St_{A}^{2}=St_{h}^{2}+St_{\theta}^{2}+2\,St_{h}\,St_{\theta} \cos\phi. \end{equation}
Here,  $St_{\theta }$ is defined as $2fc\theta _{o}/U_{\infty }$. Substituting (3.14) in (3.13), we obtain
 \begin{equation} \frac{\varGamma_{T E V}}{\varGamma_{L E V}}\approx\left[\frac{{\rm \pi}^{2}\left(S t_{h}^{2}+S t_{\theta}^{2}+2\,S t_{h}\,S t_{\theta} \cos \phi\right)}{2+{\rm \pi}^{2}\,S t_{h}^{2}}\right]. \end{equation}
 Now we introduce coefficients ( $c_{n}$) in each term of (3.15), to account for the multiplicative constants similar to the approach followed by Van Buren et al. (Reference Van Buren, Floryan and Smits2019) and Verma, Freeman & Hemmati (Reference Verma, Freeman and Hemmati2022a). The resulting expression is therefore written as
 \begin{equation} \frac{\varGamma_{T E V}}{\varGamma_{L E V}} = \left[\frac{c_{1}\,S t_{h}^{2}+c_{2}\,S t_{\theta}^{2}+c_{3}\,S t_{h}\,S t_{\theta} \cos \phi}{c_{4}+c_{5}\,S t_{h}^{2}}\right]. \end{equation}
 The coefficients  $c_{n}$ are determined by performing linear regression over the entire parameter space represented in the phase maps (see figure 7). The ranges of $St_h$, $St_\theta$ and $\phi$ correspond to $0.08 \le St_{h} \le 0.24$, $0.05 \le St_{\theta } \le 0.17$ and $0^\circ \le \phi \le 180^\circ$. Figure 11 depicts plots for calculated estimates of $\varGamma _{TEV}/\varGamma _{LEV}$, determined through numerical simulations, and output of the expression represented by right-hand side of (3.16). The coefficients correspond to $c_1 = 2.02$, $c_2 = -0.51$, $c_3 = 0.97$, $c_4 = 0.11$ and $c_5 = -0.96$. As is evident in figure 11, we observe a collapse of $\varGamma _{TEV}/\varGamma _{LEV}$ and the model outputs (3.16), which therefore indicates a reasonable accuracy of the model at an increasing range of $St_h$, $St_\theta$ and $\phi$. We also depict vertical iso-lines in figure 11 that correspond to the model output $\approx 0.4$ and 1.5. These further mark the approximate bounds where a particular wake topology will dominate for a specific combination of $St_h$, $St_{\theta }$ and $\phi$. Kinematic setting corresponding to the left of iso-line 1 shows a dominant $2P+2S$ wake mode, based on the observations from phase maps depicted in figure 7. Between iso-lines 1 and 2, the $2P$ mode dominates the wake. The specific bounds associated with the $2P$ wake mode with vortex bifurcation ( $2P^D$ pairs) occur within the region bounded by iso-lines 1 and 2. The region to the right of iso-line 2 depicts the dominance of the $rBvK$ wake mode while the $2P$ mode is entirely absent. Overall, (3.16) constitutes a novel relationship that best describes the transition of wake topology for an oscillating foil with combined motion, based on most critical kinematic parameters, including pitching ( $St_\theta$) and heaving ( $St_h$) Strouhal numbers, and phase offset ( $\phi$).

Figure 11. Scaling of estimated  $\varGamma _{TEV}/\varGamma _{LEV}$ and model (3.16) outputs at increasing $St_h$, $St_\theta$ and $\phi$.
3.5. Evaluation of wake mode transition at $Re= 4000$

To identify the topological transition features of wake modes, the validity of the mathematical model (i.e. (3.13) and (3.15)) and the existence of bifurcations in  $2P$ mode at increased $Re$, we now present the phase maps in $\phi \unicode{x2013}St_{c}$ and $A_{c}\unicode{x2013}St_{c}$ phase spaces at $Re= 4000$ in figure 12. We observe that at low $St_c < 0.24$, $wBvK$ mode is supplemented by the shedding of two additional single vortical structures, thus representing the configuration as a $wBvK+2S$ mode. At $St_c > 0.32$, existence of bifurcation is revealed, although an additional $rBvK$ vortex street also co-exists with $2P$ mode. Thus the resulting wake mode is categorized as $rBvK+2P$. The $rBvK+2P$ mode also appears at an increased $St_c$ of 0.48.

Figure 12. Phase map representation of identified wake modes at increasing  $St_c$, $\phi$ and $A_c$ for $Re= 4000$.
On the  $A_{c}\unicode{x2013}St_{c}$ phase space shown in figure 12(b), we observe a transition from $wBvK+2S$ to $2P$ mode that coincides roughly with the line of $St_A= 0.1$. Beyond $St_A= 0.2$, the $2P$ mode transitions to either $rBvK$ or $rBvk+2P$ mode. We also observe that the bifurcations in $rBvK+2P$ mode do not coincide or fall within any threshold $St_A$, which is in contrast to the observations at $Re= 1000$ (see figure 7b). These bifurcations are noticeable at increased $St_c$ and in the entire range of $A_c$ assumed in our study. On account of the above noted observations in $A_{c}\unicode{x2013}St_{c}$ phase space, it can be deduced further that the mathematical relationship outlined in (3.13) and (3.15) may not provide an accurate prediction of wake transition at a higher $Re$ of 4000. The limitation of our model, as stated above, could also indicate that there are other possible effects on vorticity production at higher $Re$, besides strengthening of the trailing edge vortex structures with increasing $St_A$ (as suggested by (3.13)). This would then make the approximation of leading and trailing edge vortex strengths inaccurate in (3.4) and (3.9). These relationships used in Schnipper et al. (Reference Schnipper, Andersen and Bohr2009) have been validated only at $Re$ close to 1000, which were further confirmed in our study as well. Thus an extensive analysis is still needed to address this limitation in the application of our mathematical model over a range of $Re$. It is also important to note that studies and models concerning phase space representation of wake modes and their transition (Godoy-Diana et al. Reference Godoy-Diana, Aider and Wesfreid2008, Reference Godoy-Diana, Marais, Aider and Wesfreid2009; Deng et al. Reference Deng, Sun and Shao2015; Sun, Deng & Shao Reference Sun, Deng and Shao2018; Zheng et al. Reference Zheng, Xie, Zheng, Ji and Zhu2019) were also limited to $1000 < Re< 1500$. The mechanism of transitioning wake topology and bifurcations of vortex pairs in $2P$ mode at $Re= 4000$ could further reveal differences in wake evolution that could hint at weakness of the mathematical model in predicting the changes in spatial topologies of $2P$ mode.
In order to highlight the transitions in wake topology and presence of bifurcations in  $rBvK+2P$ mode at $Re= 4000$, figure 13 depicts qualitatively the modes in the range $0^\circ \le \phi \le 180^\circ$ at $St_{c} = 0.4$. The wake is dominated by a $2P$ mode at $\phi = 0^\circ$, which is similar to the observations at $Re= 1000$ (see figure 8a). The paired trailing and leading edge vortex structures retain coherence only for a short while, after which the similar-sign neighbouring structures merge to form a single coherent structure shown in figure 13(a). At $\phi = 45^\circ$, an $rBvK$ mode is observed in figure 13(b), which is characterized by shedding of strong trailing edge structures that advect close to the wake centreline. In addition, we see dipole-like paired counter-rotating structures ( $2P^D$ pairs) that possess weaker strength compared to the trailing edge structures characterizing the $rBvK$ mode. Further, one of the vortical structures constituting this $2P^D$ pair also undergoes stronger stretching in comparison to its counterpart. This $2P^D$ pair, however, does not diverge away from the wake centreline as seen in figure 13(b). On account of the combined presence of features characterizing $rBvK$ and $2P$ modes, the resulting wake configuration was termed $rBvK+2P$ in figure 12(b).

Figure 13. Wake modes at increasing  $\phi$ and $Re= 4000$. Panels (a–f) represents $\phi$ corresponding to $0^\circ$, $45^\circ$, $90^\circ$, $120^\circ$, $180^\circ$ and $225^\circ$, respectively, while $St_c=0.4$.
Vortex streets that depict clear bifurcation in addition to the advecting  $rBvK$ structures are observed along the wake centreline with increasing $\phi$ to 90 $^\circ$ (figure 13c). The counter-rotating vortical structures constituting these streets also resemble the dipole-like configuration observed previously for $2P^D$ pairs at $Re= 1000$. We see further that the vortical structures associated with $rBvK$ mode have more circulation strength and larger size compared to the dipole-like paired structures. This characteristic, however, undergoes a reverse transition at $\phi = 120^\circ$, where the dipole-like paired vortices possess qualitatively a greater strength and size compared to $rBvK$ structures. We see further that during this transition at $\phi = 120^\circ$, the similar-sign vortices associated with bifurcated vortex streets and the $rBvK$ street, respectively, merge and form single coherent structures approximately around the middle (streamwise) of the wake. A bifurcation of dipole-like pairs is again visible while increasing $\phi$ to 180 $^\circ$ (figure 13e), although the weaker $rBvK$ street along the wake centreline is now more vivid compared to $\phi = 120^\circ$. The transition and appearance of bifurcated vortex streets in the wake associated with higher $Re$ therefore show different wake features compared to the wakes identified at lower $Re$ in figure 8. Here, we first observe formation of dipole-like $2P^D$ pairs in conjunction with $rBvK$ structures at $\phi = 45^\circ$. Typically, the individual vortices forming the $2P^D$ pair possessed lower strength and size compared to the vortical structures that constitute the $rBvK$ street. However, the $2P^D$ pairs undergo a consistent increase in their strength and size compared to the $rBvK$ structures with increasing $\phi$ from $45^\circ$ to $180^\circ$. The diverging vortical streets comprising the $2P^D$ pairs are observed at $\phi = 90^\circ$, which then appeared to resist their movement away from the wake centreline as $\phi$ increases to $120^\circ$. A re-emergence of a bifurcated vortex street was then observed at $\phi = 180^\circ$. We believe that this dynamic change in the behaviour of bifurcated dipolar streets could be associated directly with the consistent increase, and decrease, in the strength and size of structures, which constitute bifurcated vortex streets and $rBvK$ wake, respectively. A more closer attention to the formation mechanism will reveal further details of the transitions of modes observed here. Finally, at $\phi = 225^\circ$ (figure 13f), the wake again represents a $2P+2S$ mode, which was even observed and discussed in figure 8(f) at $Re=1000$. Thus the unique observations and characterization of bifurcations in $2P$ mode still hold for a higher Reynolds number, although there are additional complexities observed in terms of a combined $rBvK+2P$ mode.
3.6. Formation mechanism of $rBvK+2P$ mode and symmetric bifurcations

The wake modes observed for increasing  $St_c$ and $\phi$ at $Re= 4000$ were characterized by an $rBvK+2P$ configuration, where the $2P$ mode observed at $Re= 1000$ is supplemented with an $rBvK$ vortex street. Figure 14 shows the formation and temporal evolution of wake structures constituting the $rBvK+2P$ mode, along with observed bifurcation of $2P^D$ pairs, at $Re= 4000$. As the oscillation cycle begins (i.e. at $t=0$) in figure 14(a), we observe a very similar shedding pattern near the trailing edge compared to $Re= 1000$ (see figure 9). The counter-rotating leading and trailing edge structures form an approximate dipole-like paired configuration in each half shedding cycle, which then detaches from the trailing edge. Two dipole-like structures, marked as $D1^\prime$ and $D2^\prime$, are shown in figure 14(a). The dipole-like $2P^D$ pair then moves away from the wake centreline on account of the mutual induced velocity of the pair. However, as the dipole-like structures advect downstream, we observe that an elongated leg of the trailing edge vortex shed in the previous half shedding cycle splits into two structures. This splitting phenomenon was not observed for the $2P$ mode formation at $Re= 1000$. At $t=T/4$ in figure 14(b), we observe vortical structures TEV $1_{ac}^s$ and S $_{ac}$, which form due to the splitting of the vortex leg shown in figure 14(a). It is further seen that TEV1 $_{ac}^s$ constitutes a dipole-like configuration of diverging vortex street, while S $_{ac}$ eventually becomes a part of the $rBvK$ wake. A similar splitting process again starts at the end of the first half oscillation cycle, shown in figure 14(c). However, the sense of rotation for the trailing edge vortex leg is opposite to that of the first half shedding cycle. The resulting split structures TEV2 $_c^s$ and S $_c$ are shown in figure 14(d). These structures contribute further to the formation of $rBvK+2P$ mode. This characterization constitutes a new wake mode that has not been observed previously for bluff bodies or oscillating foils. It also accounts for a very different wake dynamics observed for oscillating foils with combined heaving and pitching motion, compared to those with either pure heaving or pure pitching kinematics.

Figure 14. Temporal snapshots representing contours of  $\omega _z^+ = \omega _z c/U_{\infty }$, and depicting formation of $rBvK+2P$ mode with bifurcation at $Re= 4000$.
The shear splitting phenomenon that explained reasonably the formation process of  $rBvK+2P$ and coinciding bifurcation could also provide insights into the disappearance and re-emergence of the birfurcated dipole streets observed and highlighted in the previous subsection. As $\phi$ increases from $45^\circ$ to $180^\circ$, we observed (figures 13b–e) that a clear bifurcation of dipole-like pairs appears in conjunction with the $rBvK$ structures for $\phi = 90^\circ$. However, at $\phi = 120^\circ$, the bifurcation was not imminent. Further increase in $\phi$ to 180 $^\circ$ depicted a reappearance of bifurcation for the dipole-like pairs. As indicated earlier, there is a consistent decrease in strength of trailing edge vortical structures relative to the structures forming at the leading edge. This change has a direct consequence on the shear splitting phenomenon where a delay in splitting of the trailing edge vortex leg occurs as $\phi$ increases from 45 $^\circ$ to $180^\circ$. We provide qualitative evidence in figure 15, which depicts the shear splitting process for wake observed at $Re= 4000$, and $\phi = 45^\circ$, $90^\circ$, $120^\circ$ and $180^\circ$, respectively. At $\phi = 45^\circ$ (figure 15a), we see that as the trailing edge vortex separates from the trailing edge, the dipole-like pair ( $D$) is well detached, devoid of any mutual interaction with the trailing edge vortex leg. As $\phi$ increases to $90^\circ$ (see figure 15b), the dipole-like pair ( $D$) now appears close to the detached trailing edge vortex while also undergoing mutual interaction with its leg. Thus a delay is observed in the splitting process with the weakening of the trailing edge vortex. Further increasing $\phi$ to $120^\circ$, the splitting is further delayed compared to $\phi = 90^\circ$. The weaker trailing edge vortex strength compared to vortical structures constituting $D$ is also observed in figure 15(c). At $\phi = 180^\circ$ (see figure 15d), only the dipole-like pair $D$ appears well developed, with the splitting process undergoing an even greater delay compared to the cases at lower $\phi$. The bifurcation of dipole streets that occurs at $\phi < 120^\circ$ could be attributed to the rapid splitting process that happens on account of the longer trailing edge vortex development. However, bifurcation observed at $\phi > 120^\circ$ largely could be a consequence of higher induced velocity of the dipole-like configuration, which further triggers the shear splitting ahead in the wake.

Figure 15. Changes in the dynamic shear splitting process with increasing  $\phi$.
The lack of bifurcated dipole-like streets at  $\phi = 120^\circ$ also needs closer attention. Figure 16 depicts the temporal evolution of the trailing edge vortex and dipole-like pair $D$. Even after the shear splitting (at approximately $t= 0.45T$ in figure 16) occurs, the short separation distance between the clockwise vortex, constituting the dipole pair ( $D$), and the trailing edge vortex promotes a merger rather than movement of $D$ away from the wake centreline. Thus we also see in figure 16(c) that the split trailing edge vortices eventually merge with the similar-sign vortical structures of neighbouring dipoles that further undergo a combined interaction near the wake centreline. Besides the determination of critical $\phi$ (i.e. $\phi = 120^\circ$) where the bifurcation disappears and dipole-induced velocity begins to dominate the wake dynamics, a more detailed investigation is underway in a separate study, which will model quantitatively the above transition process.

Figure 16. Temporal evolution of wake splitting and merging at  $\phi = 120^\circ$.
The splitting observed at  $Re= 4000$ provides additional explanations for the potential limitation of the proposed mathematical model in (3.13) and (3.15) for higher Reynolds numbers. The observations of Schnipper et al. (Reference Schnipper, Andersen and Bohr2009) indicated no splitting in their wake structures near the foil trailing edge at $Re\approx 1200$. The approximation of downward transport of vorticity, as employed in our study similar to that of Schnipper et al. (Reference Schnipper, Andersen and Bohr2009), was based on estimating the vorticity production from Tietjens et al. (Reference Tietjens, Prandtl and Rosenhead1957), which does not account for any effect of splitting mechanism in the wake of bluff bodies. As also detailed in the study by Ramesh et al. (Reference Ramesh, Ke, Gopalarathnam and Edwards2012), with regard to unsteady effects on leading edge vortex shedding with increasing $Re$, the vorticity distribution and thereby the circulation is inherently dependent on the wake-induced downwash velocity in parallel and normal directions to the foil chord. This wake-induced velocity at $Re= 4000$ will not be similar to the approximation (Ramesh et al. Reference Ramesh, Ke, Gopalarathnam and Edwards2012) that holds at $Re= 1000$ due to the onset of unsteady splitting mechanisms in the near wake. This attributes directly to the inaccuracy in estimating circulation of the leading edge, or boundary layer, vortices (i.e. (3.4)). A similar observation holds for the study of Schnipper et al. (Reference Schnipper, Andersen and Bohr2009). This provides a reasonable explanation for why our newly proposed mathematical model does not work well in predicting the transition in wake topological characteristics at higher Reynolds numbers, e.g. $Re=4000$.
The higher complexity of wake dynamics observed at  $Re= 4000$ also hints at a reason for the lack of correspondence between the $rBvK+2P$ mode (and the observed bifurcation) and the pitch- or heave-dominated kinematics. The qualitative and quantitative observations of $2P$ mode at $Re= 1000$ suggested that the equalization of strength and size of leading and trailing edge vortices are the only prominent contributing aspects for the observed bifurcated streets at higher Reynolds numbers, which coincided only with heave-dominated kinematics at low $Re$. However, the qualitative transition and formation mechanisms at $Re= 4000$ revealed a shear splitting process that was not seen at $Re= 1000$. This phenomenon also depicted varying temporal characteristics as the kinematics switch from pitch- to heave-dominated kinematics based on $\phi$. We believe that since the dominance of this splitting process (responsible for formation of bifurcated vortex streets) at $Re= 4000$ is not limited within certain regimes of prescribed kinematics for the foil, such bifurcations in $rBvK+2P$ wake mode can appear in different kinematic settings that induce similar effects, such as $St_c= 0.48$ at $Re=4000$ (see figure 12b).
3.7. Mean flow development in bifurcated dual vortex street wakes
In order to characterize the bifurcated dual vortex streets in  $2P$ and $rBvK+2P$ wake modes, we now evaluate the qualitative and quantitative time-averaged streamwise velocity ( $\overline {U_{x}^+}$) distribution in the wake. Figure 17 shows the contours of $\overline {U_{x}^+}$ for increasing $\phi$ at $St_{c}= 0.4$ and $Re= 1000$. Although we depict the contours corresponding to only cases $\phi = 0^\circ$, $90^\circ$, 180 $^\circ$ and 225 $^\circ$, the quantitative profiles in figure 18 are shown for all $\phi$ values ranging from pitch- to heave-dominated motion kinematics. These profiles are further obtained at three streamwise locations corresponding to $X^+= 1.5$, 3.5 and 5.5, respectively, as shown in figure 17(a). Due to similarities in the mean characteristics for some cases (e.g. $\phi = 90^\circ$ and 120 $^\circ$), contours for only some cases are shown, for brevity.

Figure 17. Contours of  $\overline {U_{x}^+}$ at (a) $\phi = 0^\circ$, (b) $\phi = 90^\circ$, (c) $\phi = 180^\circ$, and (d) $\phi = 225^\circ$. Solid red lines depict the streamwise locations where cross-stream profiles of $\overline {U_{x}^+}$ are extracted and shown in figure 18.

Figure 18. Profiles of  $\overline {U_{x}^+}$ along the cross-stream ( $Y^+$) direction at streamwise locations corresponding to(a) $X^+= 1.5$, (b) $X^+= 3.5$, and (c) $X^+= 5.5$.
The mean velocity excess at the wake centreline ( $Y^+= 0$) is maximum in the case of $\phi = 0^\circ$ and 45 $^\circ$, at all three $X^+$ locations (see figure 18). However, a mean velocity deficit region is also observed for $\phi = 45^\circ$, which strengthens further with increasing $X^+$. These deficit regions are also observed alongside the mean thrust jet developing in the wake.
Earlier, we discussed the upstream tilted vortex pairs depicted for  $\phi = 45^\circ$ in figure 8(b), which did not show a significant merger between the neighbouring vortex structures with a similar sense of rotation. These tilted pairs promote creation of a resultant induced velocity that acts against the freestream. Therefore, it results in the dual velocity deficit regions observed for the case $\phi = 45^\circ$. Such tilted pairs, however, were not seen at $\phi = 0^\circ$ in figure 8(a). Increasing $\phi$ to 90 $^\circ$ showed a transition of counter-rotating paired vortex structures to a dipole-like formation in figure 8(c). This coincides clearly with a reduction in the peak magnitude of the mean thrust jet, compared to the lower $\phi$ cases observed in figure 18. This jet is also shortened in terms of its streamwise extent, as shown in figure 17(b). This is also confirmed by the sharp drop in the peak velocity at $Y^+= 0$ in figure 18(c) for the wakes of $\phi \ge 90^\circ$. Despite this decrease along the wake centreline, the neighbouring minima decrease further as $\phi$ increases to 120 $^\circ$. This is observed specifically for the streamwise locations corresponding to $X^+= 1.5$ and 3.5, respectively. For $X^+= 5.5$, however, the velocity deficit regions flatten with increasing $\phi$ to 120 $^\circ$. These observations also coincide with the vortex interaction and merger observed for $\phi = 90^\circ$ and 120 $^\circ$ in figures 8(c) and 8(d), respectively. Since these merged structures advect closely along the wake centreline in figures 8(c,d), resultant induced velocity must be insignificant. Thus it leads to flat velocity profiles along $Y^+$.
At  $\phi = 180^\circ$, the cross-stream profiles for $\overline {U_{x}^+}$ show a different characteristic time-averaged wake. Near the foil, a pair of velocity minima is observed in figure 18(a), with a relatively minor drop compared to $U_{\infty }$, which is close to the wake centreline. Assessment at increasing streamwise distance from the foil reveals further that the minima locations disperse away from the wake centreline. This feature coincides with the diverging dual vortex streets seen in figure 8(e). This is confirmed qualitatively in figure 17(c), which identified the presence of diverging velocity deficit streams along the streamwise direction. As $\phi$ is increased further to 225 $^\circ$, we observe two velocity maxima or peaks that neighbour the wake centreline. This feature, observed from the quantitative profiles depicted in figure 18, is in definite contrast to the characteristics observed at $\phi = 180^\circ$. However, the twin peaks move away from the wake centreline in a fashion similar to the minima locations observed at $\phi = 180^\circ$. This feature is also noticeable in figure 17(d), where we observe two streams of relatively high mean velocity in the wake. From the above observations, it is seen that the formation of diverging vortex streets at $\phi = 180^\circ$ reflects a critical threshold characteristic, since the mean wake features deviate and follow different spatio-temporal development as $\phi$ is switched away from 180 $^\circ$. These dual dipole-like vortex streets are also suggestive of a relatively low spatial disturbance near the wake centreline region, compared to mean wake features associated with $\phi$ values higher or lower than 180 $^\circ$.
Figure 19(a) depicts further the contours of  $\overline {U_{x}^+}$ for $\phi = 225^\circ$ at $f^*=0.48$ and $Re=1000$. This kinematic and flow configuration corresponded to the $2P$ mode in which bifurcations were evident, as identified in figure 7(a). It is observable that the mean spatial development coinciding with the bifurcated dual vortex street remains largely unaffected with increased $St_c$. The diverging velocity deficit streaks appear comparatively similar to the $\overline {U_{x}^+}$ development observed in figure 17(c), which corresponds to the case $\phi = 180^\circ$ and $f^*= 0.4$. A spatial uniformity in the cross-stream distribution of $\overline {U_{x}^+}$ is also retained at this higher $St_c$ setting. Figure 19(b), however, depicts the $\overline {U_{x}^+}$ distribution at a higher $Re$ of 4000, while $\phi$ and $St_c$ correspond to 90 $^\circ$ and 0.4, respectively. This setting also coincides with the $rBvK+2P$ mode identified in figure 12(b), which underwent bifurcation and whose formation was also discussed in a previous subsection. A relatively strong thrust jet is seen along the wake centreline on account of the $rBvK$ vortex street observed in figure 13(c). We also see two bifurcated streaks that possess a relatively higher velocity compared to the surrounding flow. Such bifurcation in mean flow is again suggestive of an implication posed by dual vortex streets in $rBvK+2P$ mode. However, these weak jet streaks still appear in contrast to the velocity deficit streaks observed at lower $Re$, and which corresponded to only a $2P$ mode (see figures 17c and 19a).

Figure 19. Contours of  $\overline {U_{x}^+}$ at (a) $\phi = 225^\circ$, $f^*= 0.48$, $Re= 1000$, and (b) $\phi = 90^\circ$, $f^*= 0.4$, $Re= 4000$.
4. Conclusions
The wake characteristics of an oscillating foil in combined heaving and pitching motion were evaluated numerically with respect to increasing phase offset ( $0^\circ \le \phi \le 270^\circ$), chord-based Strouhal number ( $0.16 \le St_c \le 0.48$) and Reynolds number. Increasing Strouhal number and phase offset within the considered range constitute a transition of kinematics from pitch- to heave-dominated oscillatory motion, which brings about a unique transition in wake topology. This transition is characterized by bifurcated dual vortex streets in $2P$ mode. These streets exhibited counter-rotating vortical structures with mutual pairing within a half shedding cycle that resembled the mechanism of a $2P$ wake (Williamson & Roshko Reference Williamson and Roshko1988; Schnipper et al. Reference Schnipper, Andersen and Bohr2009). However, qualitative and quantitative characteristics of the wake evolution, such as circulation strength and separation distance, showed resemblance of vortex dipoles or couples. Both leading and trailing edge vortices were observed further to contribute to the formation of dipole-like configurations ( $2P^D$ pairs) that dominated the $2P$ mode. Although this characteristic of $2P^D$ pairs resembled some similarities with the Mode-1 configuration described previously by Cleaver et al. (Reference Cleaver, Wang, Gursul and Visbal2011), the $2P$ wake observed here exhibited no merger between similar-sign leading and trailing edge vortices. Further, the findings noted here were also in definite contrast to the observations made for typical vortex dipoles that are formed only on account of trailing edge structures (Cleaver et al. Reference Cleaver, Wang and Gursul2012; Calderon et al. Reference Calderon, Cleaver, Gursul and Wang2014; He & Gursul Reference He and Gursul2016; Verma & Hemmati Reference Verma and Hemmati2021b).
This wake mechanism was also modelled mathematically, where the relative circulation strengths of counter-rotating vortical structures was found to depend on the foil kinematics, including pitching amplitude ( $St_{A}$), heaving amplitude ( $St_h$), trailing edge amplitude ( $St_{\theta }$), and the phase offset ( $\phi$) between the heaving and pitching motion. The model suggested that at constant $St_h$, an increase in $\phi$ up to 180 $^\circ$ would lead to a decrease in $St_A$, which thereby reduces the relative circulation strength ratio of counter-rotating structures from the trailing and leading edges of the foil. The quantitative estimation of the relative circulation strength from the numerical data confirmed the model findings for $\phi$ greater than $45^\circ$, corresponding to heave-dominated kinematics at constant $St_h= 0.2$ and $St_c= 0.4$, where the bifurcations in $2P$ mode were observed. The phase map characterized by increasing $A_{c}\unicode{x2013}St_{c}$ also validated the predictions of the proposed mathematical model. With increasing $St_A$, qualitatively the wake modes depicted transition from $2P$ wake topologies to $rBvK$ mode. This agreed with previously reported wake dynamics, where an increase in $St_A$ corresponded to an increased relative strength in the trailing edge vortex, and hence led to a transition of wake towards an $rBvK$ topology. The proposed model was further found accurate in predicting the trends for circulation strength ratio of trailing and leading edge structures, at increasing $St_h$, $St_\theta$ and $\phi$, while also providing the approximate bounds (in terms of model output) where the major wake mode configurations like $2P$,
$2P$,  $2P+2S$ and $rBvK$ are dominant.
The wake mode transition identified at a higher  $Re$ of 4000 revealed a similar novel wake configuration that is characterized by secondary formation of an $rBvK$ vortex street, and accompanied with the bifurcated dual vortex streets of $2P$ mode. Besides the shear splitting phenomenon that is responsible for the growth of the $rBvK$ street in conjunction with the $2P$ mode, the transition in spatial characteristics of shed vortical structures also showed a distinct signature in the wake. Here, the coherent structures that dominated the $rBvK$ street lost their circulation strength consistently with increasing $\phi$ to 180 $^\circ$, while the $2P$ mode structures became relatively stronger. This mechanism coincided with a loss and subsequent reappearance of dual bifurcated vortex streets at $\phi = 120^\circ$ and 180 $^\circ$, respectively. Further evaluation of this unique transition mechanism at $Re= 4000$ revealed that with increasing $\phi$ from 45 $^\circ$ to 180 $^\circ$, the shear splitting process undergoes a consistent delay. This coincides with increasing strength of dipole-like paired structures. The contribution of the splitting process that was dominant at $\phi < 120^\circ$ reduced with increasing $\phi$ from 120 $^\circ$ to 180 $^\circ$. The induced velocity of the dipole pair was the dominating factor that prompted the formation of bifurcated dipole streets. The mathematical relationship between relative circulation strength of trailing and leading edge vortex structures, and $St_A$, did not hold well at higher Reynolds numbers (e.g. $Re= 4000$) in the qualitative sense. This was possibly on account of changes imposed on approximation for vorticity production at higher Reynolds numbers with increasing $St_c$. Further, the approximation of circulation of leading edge vortex structures appears inadequate on account of its failure to include effects of splitting process observed in the near wake at $Re= 4000$. The qualitative result of wake transition thus suggested that a distinct transition among $2P$ and $rBvK$ type modes does not coincide within a specific $St_A$ threshold, as observed at $Re= 1000$.
Mean spatio-temporal wake characteristics revealed low disturbance in the cross-stream mean velocity profile associated with the birfurcated dual vortex streets of  $2P$ mode. This feature was found consistent with increased streamwise distance along the wake. However, the mean velocity distribution corresponding to $\phi$ values lower or higher than 180 $^\circ$ appeared in contrast to those associated with the $2P$ mode that experiences bifurcation. For the $rBvK+2P$ mode observed at a higher $Re$, a mean thrust jet also accompanied the weak bifurcated streaks that were characterized by minor increase in velocity compared to the surrounding flow. The thrust jet was formed on account of the $rBvK$ vortex street observed in addition to the $2P$ mode at higher $Re$. Such mean flow characteristics corresponding to bifurcated dual vortex streets are therefore suggestive of novel flow control mechanisms. The dual vortex streets of $2P$ mode can be useful specifically in scenarios where the incoming flow is required to be manipulated such that the wake behind an oscillating body is free from substantial jet development or a recirculating flow. In situations where segregated mean thrust profile is warranted for design improvements, the bifurcations instilled in $rBvK+2P$ mode could be useful in flow manipulation.
Funding
This research has received support from the Canada First Research Excellence Grant. The computational analysis was completed using Compute Canada clusters.
Declaration of interests
The authors report no conflict of interest.


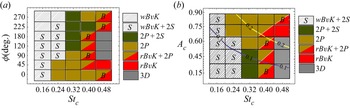


 Open access