


Many biochemical characteristics are known to predict morbidity and mortality (Emerging Risk Factors Consortium et al., Reference Kaptoge, Di Angelantonio, Lowe, Pepys, Thompson and Danesh2010; Juraschek et al., Reference Juraschek, Tunstall-Pedoe and Woodward2014; Kunutsor et al., Reference Kunutsor, Apekey and Khan2014, Reference Kunutsor, Apekey, Van Hemelrijck, Calori and Perseghin2015; Kuo et al., Reference Kuo, See, Yu, Chou, Chiou and Luo2013; Liu et al., Reference Liu, Ning, Que, Wang, Qin and Peng2014; Long et al., Reference Long, Zeng, Shi, Tian and Chen2014; Nordestgaard, Reference Nordestgaard2016; Novotny & Vitek, Reference Novotny and Vitek2003; Odden et al., Reference Odden, Amadu, Smit, Lo and Peralta2014; Pedersen, Reference Pedersen2016; Rader & Hovingh, Reference Rader and Hovingh2014; Ridker et al., Reference Ridker, Rifai, Rose, Buring and Cook2002; Stauffer et al., Reference Stauffer, Weisenfluh and Morrison2013; Wagner et al., Reference Wagner, Wallner, Molzer, Gazzin, Bulmer, Tiribelli and Vitek2015; Wu et al., Reference Wu, Hu, Chou, Huang, Chou, Lee and Li2015). A cluster of cardiovascular risk factors, including plasma lipids, are widely used for individual risk assessment. Other risk factors known to predict mortality have not been widely adopted but could supplement those currently used. In addition, longevity shows significant similarity between relatives, and whatever the cause of this similarity (see Ruby et al., Reference Ruby, Wright, Rand, Kermany, Noto, Curtis and Ball2018), a person’s risk may be predictable from data on parents’ age at death. Disease prediction through polygenic risk scores (PRSs) is becoming attractive as larger studies discover more loci and increase the precision of allelic risk estimates; genomewide association studies have identified single-nucleotide polymorphisms (SNPs) associated with overall mortality (Joshi et al., Reference Joshi, Pirastu, Kentistou, Fischer, Hofer, Schraut and Wilson2017).
For cardiovascular predictors, risk assessment is given value by availability of treatments that mitigate risk by lowering blood pressure or low-density lipoprotein (LDL) cholesterol (LDL-C). Absence of specific treatments may have restricted use of other predictors, but recognition of risk is a necessary step toward development of interventions. In addition to the clinical and public health value of reliable risk assessment through predictive biomarkers, development of treatments to delay age-related morbidity will require large clinical trials that may be more efficient if people at high risk, although currently well, can be selectively enrolled.
Biochemical test results that have consistently shown significant associations with mortality in the general population include lipids (Nordestgaard, Reference Nordestgaard2016; Pedersen, Reference Pedersen2016; Rader & Hovingh, Reference Rader and Hovingh2014; Stauffer et al., Reference Stauffer, Weisenfluh and Morrison2013), inflammatory markers (Emerging Risk Factors Consortium et al., Reference Kaptoge, Di Angelantonio, Lowe, Pepys, Thompson and Danesh2010; Ridker et al., Reference Ridker, Rifai, Rose, Buring and Cook2002), liver enzymes (Kunutsor et al., Reference Kunutsor, Apekey and Khan2014, Reference Kunutsor, Apekey, Van Hemelrijck, Calori and Perseghin2015; Liu et al., Reference Liu, Ning, Que, Wang, Qin and Peng2014; Long et al., Reference Long, Zeng, Shi, Tian and Chen2014), uric acid (Juraschek et al., Reference Juraschek, Tunstall-Pedoe and Woodward2014; Kuo et al., Reference Kuo, See, Yu, Chou, Chiou and Luo2013; Odden et al., Reference Odden, Amadu, Smit, Lo and Peralta2014; Wu et al., Reference Wu, Hu, Chou, Huang, Chou, Lee and Li2015) and bilirubin (Novotny & Vitek, Reference Novotny and Vitek2003; Wagner et al., Reference Wagner, Wallner, Molzer, Gazzin, Bulmer, Tiribelli and Vitek2015). Despite many publications on individual risk factors, it is difficult to compare them and identify which have the strongest associations. Effective comparison of predictive biomarkers requires either combination of data across multiple studies using meta-regression (Lewington et al., Reference Lewington, Bragg and Clarke2012), or studies that obtain multiple test results on all participants.
We have taken the latter approach, using data on around 13,000 participants in twin and family studies conducted over the past 25 years. These results have been combined with follow-up through a national register of death certificate data to evaluate and compare test performance. We have evaluated linear and nonlinear relationships, checked for associations specific to major cause-of-death groups and contrasted biochemical test performance against genetic indicators using parental survival data and PRSs for longevity.
Materials and Methods
Three studies on Australian adult twins and their relatives included blood collection and performance of biochemical tests. These were a twin study centered on alcohol use and alcohol use disorders (Heath et al., Reference Heath, Bucholz, Madden, Dinwiddie, Slutske, Bierut and Martin1997; Whitfield et al., Reference Whitfield, Fletcher, Murphy, Powell, Halliday, Heath and Martin1998); another on neuroticism and anxiety (Kirk et al., Reference Kirk, Birley, Statham, Haddon, Lake, Andrews and Martin2000); and a twin-family study on alcohol and smoking (Heath et al., Reference Heath, Whitfield, Martin, Pergadia, Goate, Lind and Montgomery2011; Whitfield et al., Reference Whitfield, Dy, Madden, Heath, Martin and Montgomery2008). Participants in these studies were either twins who had joined a voluntary twin registry or were siblings, parents or (in a few cases) children of twins who had participated in earlier questionnaire-based twin studies. They were not selected for any disease and were healthy enough at the time of participation to be willing to take part, to respond to questionnaires or telephone interviews, and to visit a blood collection center. Approximately 45% of those with biochemical results were twins (of which 40% were from monozygotic and 60% from dizygotic pairs), 20% were parents of twins and 35% were nontwin siblings of twins. The median age at blood collection was 45.5 years, the 25th and 75th centiles were aged 37 and 59 years, and 90% were aged between 32 and 75 years. Blood collection occurred between 1993 and 1996, 1996 and 1999, and 2001 and 2005 for the three studies, and the distributions of collection dates and follow-up times are summarized in Supplementary Figure S1.
These studies conformed to the Declaration of Helsinki and had been approved by appropriate Ethics Committees, and participants gave informed consent to the data and sample collection. Death certificate matching was approved by the QIMR Berghofer Medical Research Institute Human Research Ethics Committee and the Australian Institute of Health and Welfare (AIHW) Ethics Committee.
The biochemical tests, with the number of subjects and summary statistics for each, are listed in Table 1. Testing was done using Hitachi or Roche 747, 917 or Modular P analyzers and Roche reagents (Roche Diagnostics Australia, North Ryde NSW 2113) at Royal Prince Alfred Hospital, Sydney, except that measurements of butyrylcholinesterase (BCHE) and C-reactive protein (CRP) in the 1993−96 study were performed by spectrophotometry (Valle et al., Reference Valle, O’Connor, Taylor, Zhu, Montgomery, Slagboom and Whitfield2006) and by immunonephelometry, respectively, in the laboratory of Dr Daniel O’Connor at the University of California, San Diego. Subjects were not necessarily fasting at the time of blood collection but time since the last meal was recorded and glucose results were adjusted for fasting time.
Table 1. Statistical summary of biochemical test results for 5527 men and 7791 women with survival data and results for some or all of the listed tests
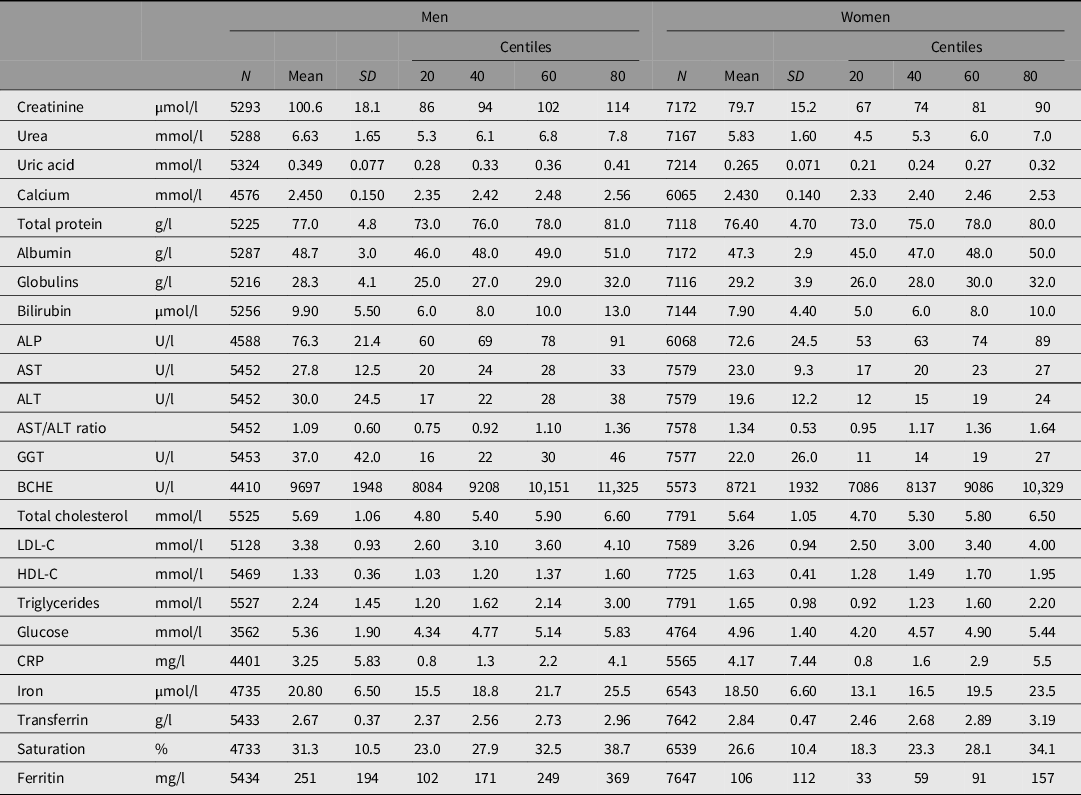
Note: ALP, alkaline phosphatase; ALT, alanine aminotransferase; AST, aspartate aminotransferase; GGT, gamma-glutamyl transferase; BCHE, butyrylcholinesterase; CRP, C-reactive protein; LDL-C, low-density lipoprotein cholesterol; HDL-C, high-density lipoprotein cholesterol.
Frequency distributions for test results were plotted, and log10 transformation was carried out for those with skewed distributions (alkaline phosphatase [ALP], alanine aminotransferase [ALT], aspartate aminotransferase [AST], bilirubin, CRP, gamma-glutamyl transferase [GGT], ferritin, LDL-C and total cholesterol, and triglycerides). Age-adjusted z-scores for each test were calculated separately for men and women, combined to give an age- and sex-adjusted value for each participant and used as predictor variables in survival analysis so that the hazard ratio (HR) for each test could be compared on a per-standard-deviation basis. To test for deviation from linear relationships between test results and risk, we used the 20th, 40th, 60th and 80th centiles to define sex- and age-adjusted quintiles, and we calculated squared z-scores for each participant so that both z-score and z-score-squared could be used in survival analysis.
Body mass index (BMI, kg/m2), habitual alcohol use (standard drinks per week) and smoking history (on a four-point scale of never/past/current < 10 cigarettes per day/current ≥ 10 cigarettes per day) were assessed using data from all studies in which these subjects participated, as described in Whitfield et al. (Reference Whitfield, Heath, Madden, Landers and Martin2018). Where subjects had participated in more than one study, the averages from all available time points were taken in order to obtain a better measure of lifetime exposure to these risks than a single observation.
Polygenic Risk Scores
Genotyping used Illumina arrays and imputation of additional SNPs was carried out using the Michigan imputation server, as described in the Supplementary text. Eight PRSs (PRS1 to PRS8, with p-value thresholds for SNP associations ranging from the genomewide p < 5 × 10⁻⁸ to inclusion of all SNPs) were calculated using allelic association effect sizes from a genomewide study on loci affecting longevity (Joshi et al., Reference Joshi, Pirastu, Kentistou, Fischer, Hofer, Schraut and Wilson2017), The longevity study was based on genotyping of approximately 600,000 people who provided information on their parents’ survival, with the parental survival being used as a surrogate phenotype. Data from that study were reanalyzed omitting data from participants included in the current study to avoid overlap between prediction and target samples.
Parental Survival
In previous questionnaire or interview studies, participants had answered questions about whether their mother and father were alive, and their current ages or ages at death. This information was used to generate the hazard function for each of the parents. The hazard functions were converted to Martingale residuals, which represent the deviation of each person from their expected survival, as explained in the Supplementary text. Martingale residuals for the participants’ mothers and fathers, and their average (mid-parent) value, were calculated. Z-scores for these Martingale residuals were calculated using the means and standard deviations (SDs), with values below −5 set to −5.
National Death Index Search
Names and dates of birth for participants were submitted to the Australian National Death Index (NDI; see https://www.aihw.gov.au/about-our-data/our-data-collections/national-death-index/about-national-death-index). Identifying information was matched against deaths occurring in Australia up to the end of October 2017. The matching algorithm used date of birth, and family and personal names weighted for frequency of names within the index. On receipt of the search results, they were ranked by matching score and checked by a person experienced with NDI data (Whitfield et al., Reference Whitfield, Heath, Madden, Landers and Martin2018).
For deaths occurring before the end of 2016, an underlying cause of death and up to 12 other conditions present were reported. Causes were missing after that time because information on date of death is received or coded earlier than the causes. Causes of death were coded by the NDI using the International Classification of Diseases, either ICD9 (up to 1996) or ICD10 (1997 onward). Only the ‘underlying cause of death’ was used in the cause-specific analysis. Causes were divided into three broad categories: cancers (malignant neoplasms: ICD9 codes 140-208, ICD10 codes C00-C97); cardiovascular diseases (diseases of the circulatory system: ICD9 codes 390-459, ICD10 codes I00-I99) and other known causes. Where no cause of death was available, the date of death was used in the analysis of all-cause mortality and the case was censored (see Austin et al., Reference Austin, Lee and Fine2016) at the date of death for the cause-specific analyses.
Statistical Methods
Details were submitted for NDI search on 33,593 people. Of these, biochemical results were available for 13,063, PRS for 14,169 and parental survival data (for both parents) for 25,784. Initial analyses were based on the maximum numbers available and were repeated using only those participants with biochemical data to allow comparison of effect sizes across a consistent subgroup of all participants.
Survival analysis was based on test results and the date of death or censoring, recoded to age at death or at October 21, 2017. IBM SPSS, release 22 (IBM Corp., Armonk, NY) was used for data management and estimation of means and correlations. Cox regression for survival analysis was performed using Stata (StataCorp LLC, College Station TX), with clustering by family (because of related subjects) to generate robust standard error estimates and confidence intervals for HR. For analysis of risk by quintiles, test results were recoded using dummy variables. Analyses were repeated after exclusion of participants who had died within 2 years of blood collection to assess whether results were dominated by short-term mortality.
To compare the strength of the tests’ or scores’ associations with mortality, while allowing for the presence of nonlinear relationships for some tests, we calculated a predicted risk for selected tests and for each participant based on the coefficients for the z-score and z-score-squared, as determined from the initial survival analysis. These risk scores were used in a further round of Cox regression to estimate the strength of association with survival, and the β values from this analysis were used as the basis for comparison — note that this will give positive coefficients even when higher test results imply lower risk.
Results
Biochemical Tests and All-Cause Mortality
Taking each test result individually, CRP, GGT, glucose and ALP results showed significant linear associations with all-cause mortality at the Bonferroni-corrected threshold of .0021 (for 24 comparisons; Table 2). A difference of 1 SD of the sample distribution for CRP was associated with a 16% difference in HR, for GGT 15%, for glucose 13% and for ALP 11%.
Table 2. Cox regression for all-cause mortality using either linear (sex- and age-adjusted z-score only) or quadratic (z-score and z-score-squared) terms for test results, with familial clustering to adjust standard errors for relatedness of participants
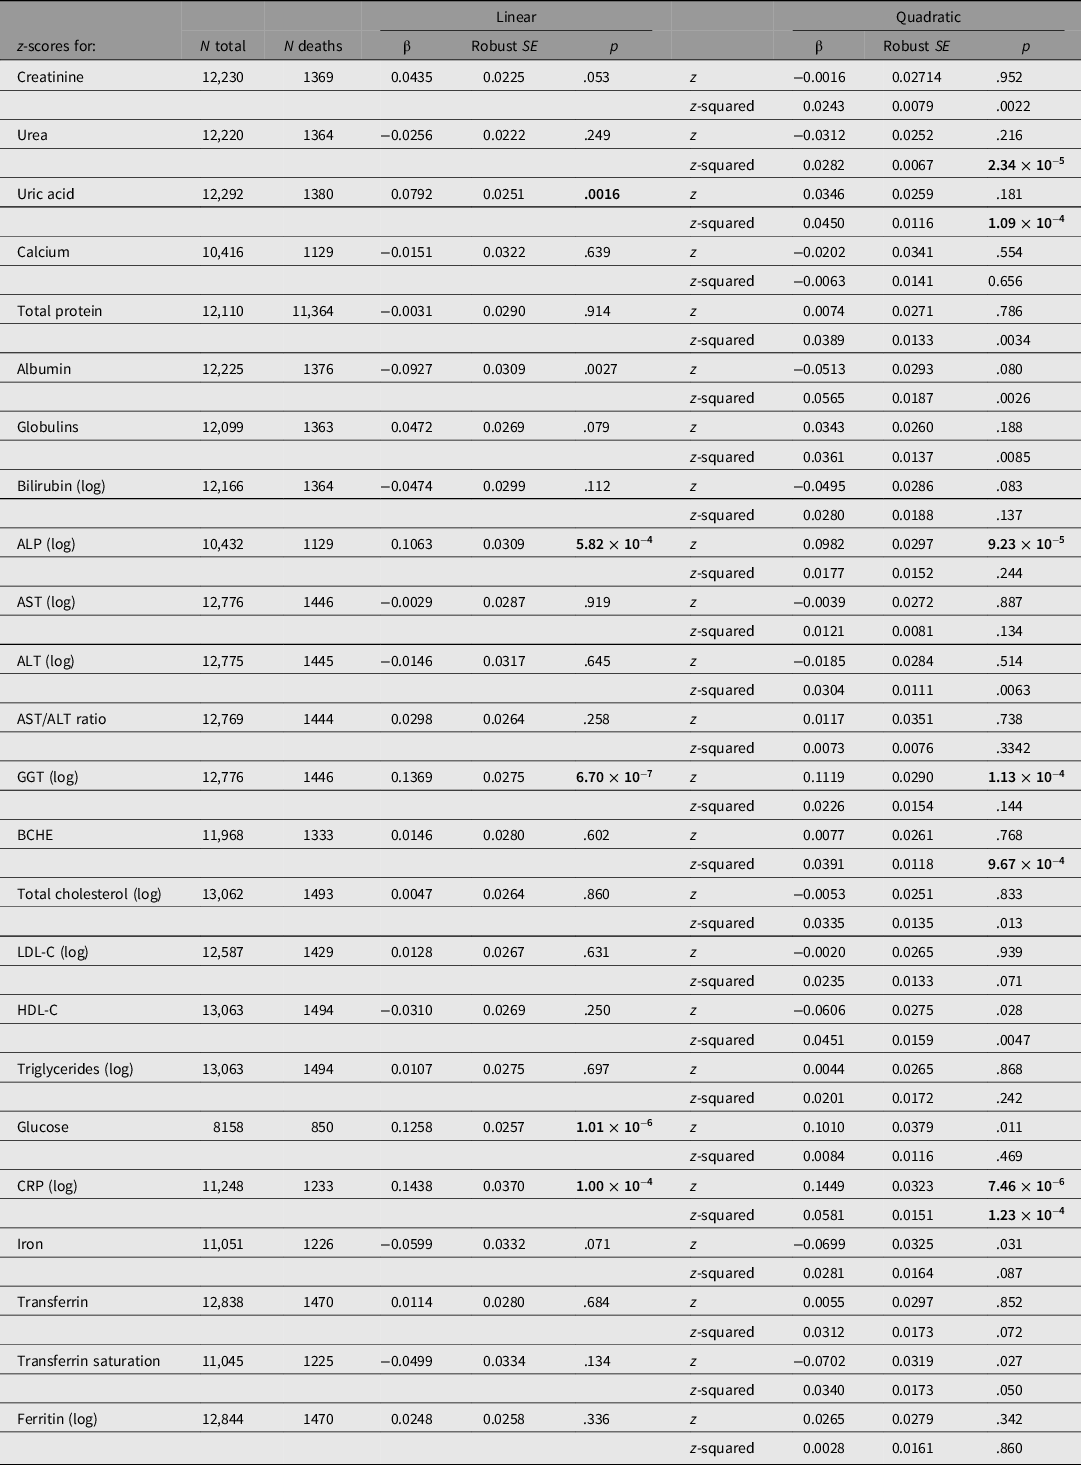
Note: HRs may be calculated from these results as expBeta. p values < .0021 (0.05/24) are shown in bold type.
ALP, alkaline phosphatase; ALT, alanine aminotransferase; AST, aspartate aminotransferase; GGT, gamma-glutamyl transferase; BCHE, butyrylcholinesterase; CRP, C-reactive protein; LDL-C, low-density lipoprotein cholesterol; HDL-C, high-density lipoprotein cholesterol. p-values below the Bonferroni-corrected significance threshold for 24 tests (.0021) are shown in bold.
These estimates are estimates of linear trend, assuming the change in risk per SD unit is constant across the observed range. To assess more complex associations, we regressed survival on z-score-squared as well as z-score and also estimated mortality by quintile of biomarker values. Results for survival by both z-score and z-score-squared are shown in Table 2. There were significant (p < .0021) associations for the z-score-squared term for urea, uric acid, BCHE and CRP.
Significant associations with all-cause mortality were still present for CRP, GGT, glucose and ALP when BMI, smoking status and usual alcohol intake were included as survival predictor variables in addition to sex (Supplementary Table S1), except for a slight decrease in the effect size (β) for GGT and a more substantial decrease for CRP. Results after exclusion of participants who died within 2 years of the blood collection (Supplementary Table S2) were similar to those for all participants.
HRs by age- and sex-adjusted quintiles of test results (based on comparison of the second to fifth quintiles against the first, lowest quintile) are shown in Figure 1, and more fully in Supplementary Table S3. Figure 1 shows results for CRP, GGT, glucose, ALP, uric acid, urea and albumin. Several of these show a pattern of risk that is not linear across quintiles but J- or U-shaped.
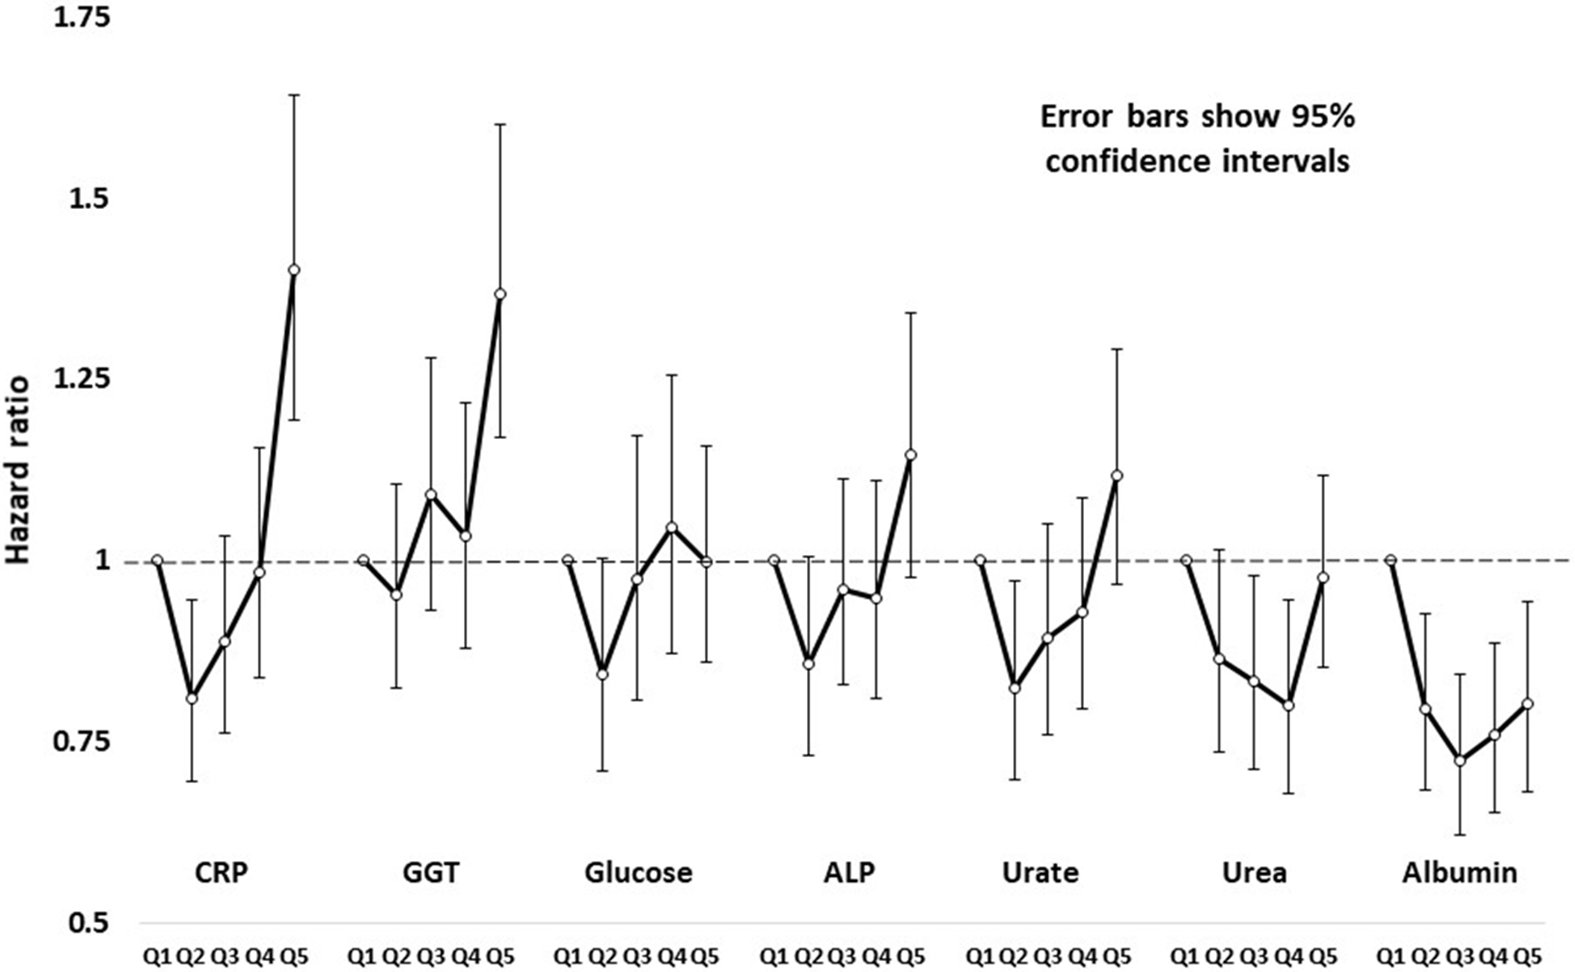
Fig. 1. Hazard ratios and robust 95% confidence intervals for all-cause mortality in study participants, by sex-specific age-adjusted quintiles of C-reactive protein (CRP), gamma-glutamyl transferase (GGT), glucose, alkaline phosphatase (ALP), urate, urea and creatinine.
Cause-Specific Mortality
We next checked whether mortality associations were specific to one group of conditions, such as cardiovascular disease, or more general. Results are shown in Supplementary Table S4. For all-cancer mortality, significant linear or quadratic associations (at p < .0021) were found for albumin and CRP. For cardiovascular mortality, albumin, ALP, BCHE, creatinine, GGT, total protein and uric acid showed significant associations. For other noncancer and non-CVD conditions, CRP, glucose, iron, urea and uric acid showed significant associations. In each case, there were additional tests showing nominally significant (p < .05) associations.
PRSs for Mortality
PRSs were first tested for association with all-cause mortality. Results, and thresholds for inclusion of independent SNPs, are shown in Table 3. PRS1 showed the strongest and most significant association with mortality (HR per 1-SD difference 1.090, p = 4.83 × 10⁻⁴), with weaker associations for PRS2 to PRS8 (Table 3). Results obtained when only the participants with biochemical results were included are shown in Supplementary Table S5.
Table 3. Prediction of all-cause mortality from polygenic risk scores (PRSs)
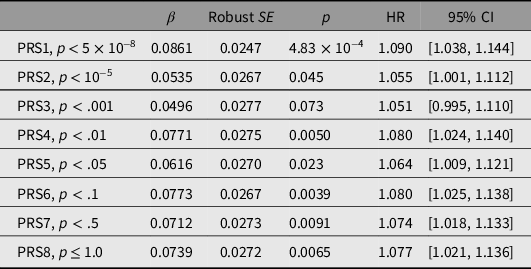
Note: HR, hazard ratio.
Standardized scores were calculated at each of the p-value thresholds shown using data from a genomewide association study on longevity (Joshi et al., Reference Joshi, Pirastu, Kentistou, Fischer, Hofer, Schraut and Wilson2017). To avoid subject overlap between the data used to calculate the scores and the evaluation of the PRS predictive performance in our subjects, the allelic effect sizes were recalculated omitting data from our studies. For each PRS, the total number of participants was 14,169 and the number who died was 1645.
Results for cause-specific mortality are shown in Supplementary Table S6. For cancer deaths, there were no significant associations with PRS. For cardiovascular deaths, there were marginally significant associations for the PRS computed using more liberal p-value thresholds, PRS4 to PRS8. However, for deaths attributed to other causes, six out of eight scores showed significant associations, with PRS1 the strongest (HR = 1.18 per 1-SD difference, p = 1.77 × 10⁻⁴).
Parental Survival
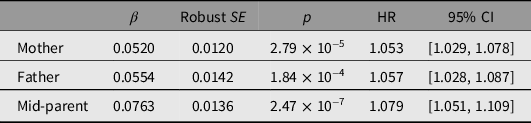
Associations between reported parental survival and survival of the study participants, as all-cause mortality and by cause-of-death group, are shown in Table 4 and Supplementary Tables S5 and S7. Reported parental survival was significantly associated with participant (offspring) survival, with an increase of 7% in HR for each 1-SD increase in mid-parent Martingale residual. The mid-parent Martingale residual was associated with risk of both cancer and cardiovascular death, with HR increasing by 6% and 21%, respectively, per 1-SD increase in standardized residual, but not with deaths attributed to other causes.
Table 4. Prediction of participant of all-cause mortality from parental survival data based on z-transformed Martingale residuals, winzorized at −5, from mothers’ and fathers’ reported survival, and average of mother’s and father’s (mid-parent). There were 3740 deaths among 25,784 participants with information on both mother’s and father’s survival
Biomarkers, PRSs and Parental Survival
We also considered whether the genomic risk scores, the parental survival characteristics, or both, were associated with the biochemical test results. Correlations between these are summarized in Supplementary Table S8. PRS1, based on loci known to have genomewide significant associations with survival, had significant associations with total and LDL-C, and CRP. Reported parental survival had significant correlations with albumin, bilirubin, CRP, high-density lipoprotein cholesterol (HDL-C), triglycerides and uric acid.
Discussion
Our aim was to compare prediction of mortality by widely available biochemical tests, genotype-based PRS and parental survival data. The results of this comparison are summarized in Figure 2. Our main findings are first that many of the tests associated with all-cause or grouped causes of mortality do not conform to the expectation of a linear increase or decrease in risk with increasing test results; second that lipids show no significant association with mortality in our cohort; and third that biochemical tests are currently more informative than genomic or family history data.

Fig. 2. Comparison of estimated effects (β-coefficients and standard errors from Cox regression) on all-cause mortality for selected biochemical tests, polygenic risk scores and parental survival data. Risk estimates for the biochemical tests were recalculated for this figure using both linear and quadratic coefficients for predicted risk as listed in Table 2. PRS1 to PRS8; polygenic risk scores; father, mother and mean; parental Martingale residuals (based on their reported survival) for mothers, fathers and mean (mid-parent) value
Lipid Risk Factors
Initially, we expected that lipids (LDL-C and HDL-C, and triglycerides) would be among the best predictors of death because of their widely used association with cardiovascular disease. In fact, lipids showed little association with all-cause mortality in this cohort (Table 2, Supplementary Table S3). Even for cardiovascular mortality (Supplementary Table S4), none of the lipid results showed significant associations. Several explanations are possible. Most participants survived to an advanced age; the estimated median life expectancy in participants with lipid results was 90 years for women and 88 for men. Many studies on lipids and cardiovascular risk have emphasized ‘premature’ cardiovascular mortality. Second, a decrease in the importance of lipid risk factors could occur because risk assessment and improved treatment have decreased cardiovascular death rates, including in Australia (see https://www.abs.gov.au/ausstats/abs@.nsf/Lookup/by%20Subject/3303.0.55.003~1968-2017~Main%20Features~Fifty%20Years%20of%20Cardiovasclar%20Mortality~2). Use of cholesterol-lowering drugs could have affected our test results and changed the association between total or LDL-C and mortality. Either better prevention or better treatment could reduce the predictive value of lipid results relative to other markers of risk, although detection and treatment of lipid abnormalities in individual patients would remain important. Third, our lipid results were not all obtained on fasting samples. However, there is evidence (Mora et al., Reference Mora, Chang, Moorthy and Sever2019) that nonfasting lipid results give equivalent risk predictions for coronary heart disease to fasting ones.
Other Biochemical Tests
The tests that did show significant linear relationships with all-cause mortality were CRP, GGT, glucose and ALP. These point to the relevance of inflammation, factors related to liver function and glycemic control.
CRP has been extensively studied, with results summarized in a meta-analysis of data from 54 prospective studies (Emerging Risk Factors Consortium et al., Reference Kaptoge, Di Angelantonio, Lowe, Pepys, Thompson and Danesh2010). In both men (Ridker et al., Reference Ridker, Cushman, Stampfer, Tracy and Hennekens1997) and women (Ridker et al., Reference Ridker, Rifai, Rose, Buring and Cook2002), CRP and LDL-C were each risk factors for cardiovascular events, and predictive performance of CRP was better than LDL-C. Our CRP results suggest a U- or J-shaped relationship with risk (Figure 1), although the test based on assuming a linear relationship was statistically significant.
For the ‘liver enzymes’, many prospective studies on mortality and morbidity have been summarized and meta-analyzed, mainly with a focus on GGT and ALT (Kunutsor, Apekey, Seddoh, et al., Reference Kunutsor, Apekey, Seddoh and Walley2014; Liu et al., Reference Liu, Ning, Que, Wang, Qin and Peng2014; Long et al., Reference Long, Zeng, Shi, Tian and Chen2014). We found significant associations with all-cause mortality for GGT and ALP but not for AST, ALT or their ratio. In this context, and because of the GGT result, we assume that the relevant source of ALP is liver rather than bone or intestine. The mechanisms linking the liver enzymes with mortality are uncertain, but at least for cardiovascular disease probably involve fatty liver (Mellinger et al., Reference Mellinger, Pencina, Massaro, Hoffmann, Seshadri, Fox and Speliotes2015; VanWagner et al., Reference VanWagner, Ning, Lewis, Shay, Wilkins, Carr and Carnethon2014; Wong et al., Reference Wong, Wong, Yip, Lo, Limquiaco, Chu and Chan2011). In addition, GGT may have pro-oxidant effects on lipids (Franzini et al., Reference Franzini, Corti, Martinelli, Del Corso, Emdin, Parenti and Paolicchi2009; Lee & Jacobs, Reference Lee and Jacobs2009).
It is worth noting that a significant association was found (Table 2) between all-cause mortality and glucose even though the blood samples were not collected at fasting or after a standard glucose load.
Initially, like others, we tested for linear associations with risk. However, examination of results by quintiles and tests for quadratic associations showed that this could miss important effects. As well as CRP, renal function tests (urea, uric acid and possibly creatinine) showed a U- or J-shaped pattern of low and high results being associated with increased mortality compared to intermediate values. For urea, creatinine and uric acid renal insufficiency (at the upper end of the distributions), and poor nutritional status and muscle mass (at the lower end) could each have adverse effects. Increased mortality associated with low results for these tests could reflect ill health and short-term mortality, but our results were very similar when participants who did not survive 2 years from baseline were excluded.
Polygenic Risk Scores
We also assessed the polygenic scores for longevity, computed at various levels of significance for the SNP associations (from p < 5 × 10⁻⁸, to inclusion of all independent SNPs). These showed significant associations for all-cause mortality, but predictive value as measured by the HRs was less than the best of the biochemical tests, including when PRS analysis was restricted to those with biochemical results. The longevity PRS may improve with larger studies (Timmers et al., Reference Timmers, Wilson, Joshi and Deelen2020), although our calculation is already based on data from about 560,000 people. Also, PRS based on specific conditions may perform better than PRS for the inherently heterogeneous phenotype of all-cause mortality. It was notable that PRS1 had opposite associations with lipid risk (LDL-C, HDL-C and triglycerides) and inflammation (CRP) (Supplementary Table S7). This will weaken the association between at least PRS1 and mortality, but this problem is inherent in the known pleiotropic (and opposite) effects on risk phenotypes at these loci.
Family History
In related questionnaire- and interview-based studies, participants had been asked whether their mother and father were living and if not, the age of each when they died. This allowed us to assess parental mortality as a predictor of mortality among participants. All-cause mortality among participants was significantly associated with their mothers’ or fathers’ survival, and slightly more strongly with the average of their parents’ data. The parent-to-offspring transmission of risk was substantially greater for cardiovascular deaths (HR for mid-parent standardized residual 1.21) than for cancer deaths (HR 1.07) or deaths from other causes (HR 1.03) (Supplementary Table S6). This is consistent with greater heterogeneity of diseases, and presumably of heritable contributions to disease risk, for cancers and for other causes than for cardiovascular disease where atherosclerosis has a central role.
Cause-of-Death Groupings
Although the death certificate data included information on the underlying cause of death and other conditions present at the time of death, there are limitations when making associations with specific causes of death. There is a substantial literature drawing attention to inaccuracy of the causes given on death certificates (Coady et al., Reference Coady, Sorlie, Cooper, Folsom, Rosamond and Conwill2001; Lloyd-Jones et al., Reference Lloyd-Jones, Martin, Larson and Levy1998; Maclaine et al., Reference Maclaine, Macarthur and Heathcote1992; Modelmog et al., Reference Modelmog, Rahlenbeck and Trichopoulos1992). Nevertheless, we did find associations between three groups of causes of death and the potential predictors.
Cancers of any type were treated as a single group. This may assume more similarity across this group than truly exists, but there were significant nonlinear associations with CRP and to a lesser extent with albumin (Supplementary Table S4). There was no significant association with the PRSs, but parental survival was significant for cancer mortality (Supplementary Tables S5 and S6). It should be noted here that we had no information on parental causes of death, so the parental survival data relate to their death from any cause.
For cardiovascular diseases, several renal or liver tests (creatinine, uric acid, total protein and albumin, ALP, BCHE and GGT) showed significant associations. The association with GGT was expected, given previous reports, but that for ALP was unexpected. The PRSs for all-cause mortality showed marginally significant associations with CVD, possibly because the loci that contribute most strongly to PRS1 have opposing effects on lipid-related and inflammation-related risk (Supplementary Table S8). The reported parental survival was significantly predictive for cardiovascular deaths.
The category of other causes of death is heterogeneous but did show associations for CRP, glucose, iron, urea and uric acid,. For glucose, which is most obviously associated with diabetes and its complications, risk increased by about 15% for each 1-SD increase. CRP showed a similar 18% increase in risk for each 1-SD increase (Supplementary Table S4).
Looking at the cause-of-death grouping from another perspective, two of the best linear predictors of all-cause mortality, GGT and ALP, seem most associated with cardiovascular deaths. On the other hand, CRP and glucose show similar effect sizes across the cancers, CVD and other-cause groups (see Supplementary Table S4 and Supplementary Figure S2).
Overlap of Biochemical Results and Genetics for Mortality
Many test results in study participants were significantly correlated with the summary statistic (Martingale residuals) for survival in their parents, or with PRSs. This potentially gives novel insights about transmission of the biomarker-associated risks between generations, which will be explored in a further paper.
Strengths and Limitations
The strengths of our study are the length of follow-up and the direct comparisons made possible by having many potential predictors for the same group of subjects. However, there are larger studies, and meta-analyses covering much larger numbers of subjects, on individual risk factor/disease combinations. The age range of participants was wide, but 75% of deaths occurred after the age of 70 years and 50% over 80 years. Therefore, our results mostly reflect mortality associations in older people. Also, many potential associations have been examined and some of the results (e.g. subdivision by major disease groupings) should be regarded as hypothesis-generating and in need of replication. Maturation of large studies such as the UK Biobank (http://www.ukbiobank.ac.uk/) will facilitate this. Observational data alone cannot show causation, but examination of genetic effects on these biomarkers and on mortality using the Mendelian randomization approach should clarify causal relationships.
Conclusions
Comparison between tests shows that inflammation (CRP), liver function (GGT, ALP) and glycemic control (glucose) show the strongest associations with mortality, but indicators of adverse nutrition (low urea) also affect survival. The widely used lipid risk factors were less predictive than expected. Polygenic scores for mortality show promise and may improve.
Acknowledgments
We are grateful to the participants who provided information and blood samples on which this report is based; to the staff of QIMR Berghofer Medical Research Institute, Brisbane for liaison with participants and data collection and management and particularly to Richard Parker for organizing the NDI search and Judith Symmons for checking the matched results from the search; and to the staff of the Biochemistry Department, Royal Prince Alfred Hospital, Sydney who performed the biochemical tests. Many of the twin participants were originally contacted through the Australian Twin Registry.
Financial Support
Funding for the performance of the biochemical tests came from the US National Institutes of Health (AA14041), which also funded aspects of participant recruitment and sample collection (AA07535, AA07728, AA11998, AA13320, AA13321, AA17688, DA012854, DA019951). The National Death Index search was made possible by a donation from Mr George Landers. Funders had no role in study design, in the collection, analysis and interpretation of data, in the writing of the report, or in the decision to submit the article for publication.
Conflict of Interest
None.
Data Statement
Because of undertakings given to the participants as part of the informed consent process, raw data on which our results are based cannot be made freely available. However, it may be possible for interested researchers to make use of the data during a prearranged visit to QIMR Berghofer Medical Research Institute.
Supplementary Material
To view supplementary material for this article, please visit https://doi.org/10.1017/thg.2020.89.


 Open access